---
Construction and Building Materials Volume 52, 15 February 2014, Pages 146–154
1Dept. of Science and Engineering of Ground and Materials, University of Cantabria,
School of Civil Engineering of Santander. Avda. Los Castros s/n, Santander, 39005 Spain.
2Dept. of Structural and Mechanical Engineering, University of Cantabria, School of
Civil Engineering of Santander. Avda. Los Castros s/n, Santander, 39005 Spain.
* Corresponding author
Phone: (0034) 942200915,
Fax: (0034) 942201818
Email: [email protected]
2
ABSTRACT
This paper presents the main results of the research carried out to obtain the fatigue limit of concrete incorporating recycled aggregate from concrete. In this research, recycled aggregate concretes with partial and total coarse aggregate replacement and
control concretes with different increasing water/cement ratios have been cast to study the material’s behavior in response to repeated compressive loads. The results show
that, for the same water/cement ratio, the recycled aggregate concretes present a loss of stiffness higher than the control concrete. Furthermore, the use of recycled aggregate in concrete implies a reduction of the fatigue life. These differences are increased for low water/cement ratios, as in this case the main factor is the lower strength capacity of the aggregate. From the results obtained, recommendable mixtures for recycled aggregates exposed to fatigue loads are proposed.
3
1 Introduction
A great deal of research has recently been undertaken to find ways of using recycled aggregate in the manufacture of concrete and, in particular, in the reuse of recycled aggregates (RA) from concrete (RCA) [1-7]. The properties of RCA make it the most appropriate of all recycled aggregates for the production of recycled aggregate concrete (RAC) [8,9]. It is generally agreed that there is a loss in the physical and mechanical properties but the fatigue behavior has not been extensively analyzed. After an extensive review of the literature, Padmini et al. [3] highlighted the following aspects: RAC requires more water for the same workability than conventional concrete; the density, compressive strength and modulus of elasticity of RAC are relatively lower than that of the control concrete; and for a given w/c ratio, gas and water permeability, rate of carbonation and risk of reinforcement corrosion are higher. There is a Master Thesis of the Faculty of California Polytechnic State University entitled “Low Cycle Fatigue Behavior of Concrete with Recycled Concrete Aggregates” [10] in which the fatigue behavior of recycled concrete with different degrees of substitution and water/cement (w/c) ratios has been considered. Luo and Yao [11,12] have analyzed the deformation curves and the response to the ultrasonic pulses of recycled plain concrete subjected to low frequency fatigue and have confirmed the presence of three
stages of behavior with a lifespan of 10%, 80% and 10% of the fatigue life, respectively. This effect is observed in non-recycled concrete specimens by Do et al.
[13]. Yan et al. [14,15] have analyzed the fatigue behaviour of the axial and eccentric compression performance of recycled aggregate reinforcement concrete, finding differences with respect to the non-recycled concrete. However, the lack of a well-established test procedure for executing and evaluating fatigue tests makes it difficult
4
to correlate or extend published test results [16]. In this paper a specific methodology for determining the fatigue limit of the plain concrete is proposed.
With the support of the Spanish Ministry of Environment and coordinated by the Structures and Materials Laboratory of the Spanish Ministry of Construction, CEDEX, the experimental projects RECNHOR (2006-2010) and CLEAM (2010-2011) were developed [17-19]. The main objective of these projects was to define the regulative framework for the use of RAs in structural concrete in Spain, gathered in Annex 15 "Recommendations for the utilization of recycled aggregate concrete" of the Spanish Structural Concrete Code (EHE-08) [20,21]. This Annex only allows the use of coarse RAs made from crushed concrete waste, recommending its substitution up to a maximum limit of 20% weight of the total coarse aggregate. Part of the results of the research from these projects are presented in this paper, including the results obtained by other participants in the project [17,19,22-36].
The behavior and fatigue limit of recycled aggregate concretes with 0%, 20%, 50% and 100% of coarse RCA with different w/c ratios have been obtained.
2 Experimental program
A total of 24 mixtures under fatigue loadings have been studied. Six control concretes (CC) with natural limestone aggregate (NA) and 18 substitutions of 20%, 50% and
100% by weight of coarse NA by RCA have been prepared.
2.1. Materials
Cement CEM I 52.5 N/SR with a density of 3.11 g/cm3 and a Blaine specific surface of 361 m2/kg was used. Table 1 shows the chemical composition of this Portland cement. Fig. 1 shows the grading of the NA and RA. The coarse aggregate grading conforms to the requirement of ASTM C33 of 19.0-9.5 mm and 12.5-4.75 mm, also the RA lies
5
between the previous two, corresponding to the requirement of 19.0-4.75 mm. Table 2 shows the physical and mechanical properties of these coarse aggregates. The original concrete of the RA had a minimum compressive strength of 25 MPa as is indicated in the Spanish standard [20] and was provided by a waste management plant after treatment of construction and demolition waste.
An addition of 20% of recycled aggregate provides density values of around 5% lower than in the case of the control concrete and no significant changes with respect to the compressive strength. However, where the substitution is 100%, there is a significant loss of compressive strength.
2.2. Mix proportions
Concretes of strength class between 25 and 50 MPa were prepared and the study was carried out in three phases.
§ Phase 1: mixes with water/cement (w/c) w/c = 0.65 and w/c = 0.50, using dry aggregates (concretes H-0.65 and H-0.50 respectively).
§ Phase 2: mixes with w/c = 0.65 (H-0.65AS) and w/c = 0.50 (H-0.50AS), with saturated coarse aggregate (natural and recycled).
§ Phase 3: mixes with w/c = 0.55 (H-0.55ARS) and w/c = 0.45 (H-0.45ARS), using saturated recycled aggregates.
The mix designs are shown in Table 3. For the mix design, the start point is the mixture design by Fuller method for the control concrete. After that, the recycled concrete has designed with the same grading than the control concrete, replacing percentages of natural gravel by recycled coarse aggregate. The effective w/c ratio was calculated considering that, when using dry aggregates, they absorb 70% of their total absorption capacity during batching and when using saturated aggregates, by weighting them
6
before and after the saturation process [9,17,35]. The used w/c ratio and the cement content is very similar to the used by [10] so comparison between different researches can be establish.
2.3. Specimens
288 cylindrical specimens, according to [37,38] were prepared and cured along 365 days in a controlled atmosphere of 20±5 °C and 97 ± 2% humidity environment. The reason for this age of curing corresponds to the long duration of fatigue tests. Tests from a few minutes to several days have been carried out. In this time lapse the properties of concrete can significantly change in young concretes. All fatigue specimens were instrumented with two strain gauges glued in two opposite generatrix.
The densities and porosity of the hardened concrete were determined according to standards [39]. Load rates of 8 kN/s were applied for the tensile splitting [40] and 10 kN/s for compressive strength tests [41,42]. Also, the modulus of elasticity in the compression of the concrete was determined [43]. The concrete properties with 365 days of age are shown in Table 3.
2.4. Fatigue test
Series of 10 specimens of each mix under fatigue in compression have been tested following the Staircase method [44-46]. This methodology has been successfully applied to the determination of the fatigue limit of flash butt welding as described in the
standard [47] relating to railway applications or composite materials [48] and biological materials [49].
Each specimen is tested under 10 Hz frequency until failure or up to a maximum of 2·106 cycles maintaining the stress limits. In this way, it has been considered that the concrete has infinite life for a given stress interval when the fatigue life exceeds 2·106
7
cycles. The first test of each series was performed with an upper stress limit around 50% of the compressive strength of concrete and 5 MPa for the lower limit. The second fatigue test of the same mix is performed depending whether the previous test or specimen has failed or exceeded 2·106 cycles. If the first specimen exceeds infinite life, the second test (with a new different specimen) is performed maintaining the lower limit
and increasing the upper limit by a constant value, δ, of 5 MPa. If the specimen fails before reaching the 2·106 cycles established as infinite life, the second test is performed maintaining the lower limit and decreasing the upper limit by the same value
δ of 5 MPa. A lower value of δ should provide higher precision in the fatigue limit determination, although more tests are required. In this case, the process described is repeated 10 times for each mix, always using different specimens. Table 4 describes the test parameters of the different stress levels, j.
After the series of tests, the following considerations have been taken in order to determine the fatigue limit. SMF is defined as the least frequent event: failure “X” or not failure “O” before the 2·106 cycles. If the number of tests on each series exceeding the infinite life (denoted with "O") is greater the SMF is considered VALID and NOT VALID
if the number of failed tests (denoted with "X") is greater. Under these considerations,
σ0 is the lowest strength level where an SMF is found. For each tested σi stress level, i is the number of level from σ0 and ni is the number of SMF of the i level. The parameters A, B and N are then calculated according to (1), (2) and (3), Staircase method [46].
∑
=
i
n
i8
∑
=
n
iN
(2)∑
=
i 2n
i
B
đ
(3)Under these conditions, the fatigue limit is calculated by (4).
N
A
0 FL
⎟
⎠
⎞
⎜
⎝
⎛
±
+
=
2
1
δ
σ
σ
(4)In (4), the sign “+” is taken when the SMF is VALID and “-“ if SMF is NOT VALID.
The standard deviation (s) is calculated based on the expression (5).
0.029
N
A
-B·N
1.62·
2 2⎟⎟
⎠
⎞
⎜⎜
⎝
⎛
+
=
δ
s
(5)Finally, the material fatigue limit is expressed as in (6).
[MPa]
s
FL±
=
σ
σ
FL (6)Formula (6) is valid only if (7) is verified.
0.3
N
A
-B·N
2 2>
(7)9
3 Results and discussion
3.1. Strain versus cycles
The plot of the strain versus number of cycles has revealed two distinct classes of behavior depending on whether the specimen has failed or exceeded the 2·106 cycles. Fig. 2 and Fig. 3 show the two types of the reported behavior.
If the specimen reaches 2·106 cycles, Fig. 2, a moderate quasilogarithmic increase in the maximum and minimum strain from the first to the last cycle is observed. In this type of behavior, the difference between the maximum and minimum strain slightly increases throughout the test.
If the specimen fails before 2·106 cycles, Fig. 3, three different stages (A, B and C) are observed [13,50-52]. In this case, the three stages representing approximately 15%, 70% and 15% of the total life time respectively unlike those observed by other authors [11,12]. The first stage A is similar to that observed one in concretes exceeding 2·106 cycles. This is characterized by a quasilogarithmic increase in the maximum and minimum strain, the increase rate of the maximum strain being slightly higher than the minimum. This stage corresponds to the initial formation of microcracks.
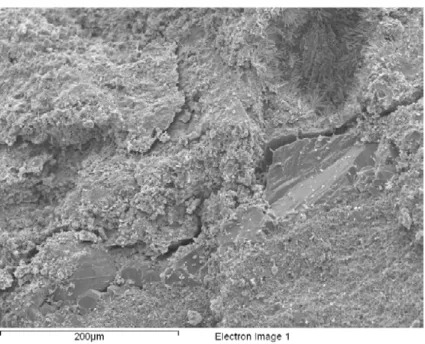
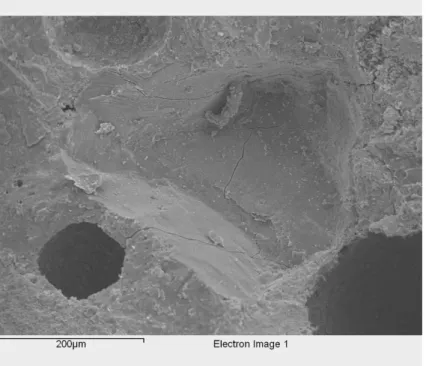
In order to observe the microcracks of RAC, some samples have been analyzed by SEM. In all cases the micrographs were obtained from samples with failure before 2·106 cycles. A sample of about 10 mm2 from the main fracture surface of the sample was selected. After that, it was metallized with gold to obtain a higher resolution micrograph. Fig. 4 shows the generation of microcracks in a pore of the cement paste of concrete. The second stage B, shows an almost linear increase in strain, which is reached by the accumulation of damage due to fatigue cycles. In this second stage, the crack growth causes a loss of stiffness evidenced by the slight separation of the gap
10
between the maximum and minimum strain. The stress limits are also constant so the stiffness in this stage decreases linearly. The stage is associated with the growth and stabilization of the formed cracks. Fig. 5 shows the growth of cracks through the cement paste and the cement-paste interface. A third and final stage C is observed. In this stage the interconnections of cracks cause the collapse of the concrete under fatigue loading. The increase in deformation, unlike the previous stages A and B, is exponential: an accelerated loss of stiffness is accompanied by a greater separation between the upper and lower envelopes of maximum and minimum strain with the cycles. Fig. 6 shows the interconnections of cracks causing the collapse of the concrete. Micrographs representing the three stages of deterioration were obtained from a single sample. The three typical microcracks (generation, growth and interconnection) can be found on the main fracture surface of the specimen.
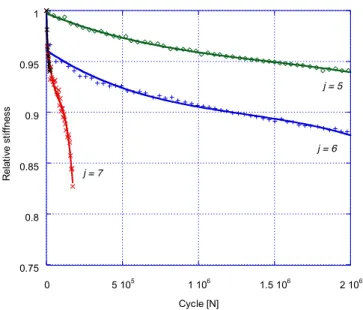
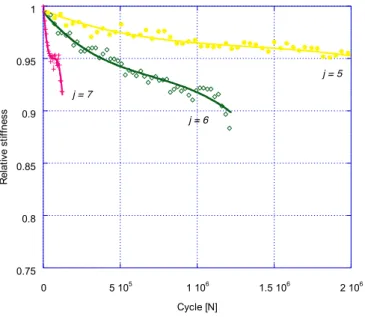
3.2. Stiffness versus cycles
As an alternative analysis to the evolution of the strain versus number of cycles, the evolution of the elastic modulus or stiffness versus the number of cycles, or E-N curve, is proposed. The stress levels are constant for all cycles of a test and the differences between the maximum and minimum strain in each cycle is increased. The relative stiffness of the concrete in relation to the elasticity modulus E(N)/E0 can be obtained from the quotient of the stress-strain.
Fig. 7 to Fig. 10 show the relative stiffness evolution versus the number of cycles of the control and recycled aggregate concretes. Three different stress levels, j, over the level where the first collapse takes place have been plotted.
As in Fig. 3, three stages of behavior are identified. The first point corresponds to the conventional elastic modulus E0, at N=0. From this point, with the increase of cycles, the stiffness decreases, as a result of cumulative damage in concretes. A second
11
stage, coincident with stage B discussed above, can be identified. The final C stage is observed in the stiffness curves where the collapse takes place. In this stage, the stiffness continues decreasing following an accelerated curve of increasing negative slope. In this case, the maximal number of supported cycles Nf defines a final concrete stiffness Ef.
There are two characteristics that distinguish the fatigue behavior of the recycled concrete from the control concrete. First, the lower modulus of elasticity of recycled concrete causes a faster loss of stiffness with the accumulation of cycles, compared with control concretes in the same stress level. Likewise, the stress level (referred to the compressive strength) that causes collapse of recycled concretes is lower than those that can cause it in the control concretes, with the same w/c ratio, where the fatigue produces bond cracks in a slow and gradual process [16]. This reduction will be estimated by the fatigue limit for different degrees of substitution of NA by RA. When concrete’s w/c ratio increases, less elastic recovery is seen. Similar results have been found in [10].
3.3. Fatigue limit
Table 5 shows as example the results of 8 fatigue tests of H-0,45ARS-100% recycled concrete where “X” is a failure and “O” is a no failure before the 2·106 cycles. Table 6 shows the values obtained for the fatigue limits with their standard deviations and the percentage ratio relative to the compressive strength.
Results of Table 6 shows that the fatigue limit is between 40% and 70% of the compressive strength. The compressive strength increases due to the lower effective w/c ratio but the fatigue limit decreases with the degree of substitution. There is a drop in the fatigue limit of concrete H-0.65, with a difference between the control and the
12
100% recycled concrete of about 15%. However, in the case of H-0.50 the decrease in the fatigue limit is considerably higher, around 35%.
Regarding the recycled concrete of the second phase, the fatigue limit is over 60% of the compressive strength. Again, the fatigue limit shows a tendency to decrease with the degree of substitution although the compressive strength of the different substitution degrees is similar. In this case, for H-0.65AS the total replacement of NA by RA causes a loss of 17% in the fatigue limit. Also, the reduction in the effective w/c ratio of the H-0.50AS increases the difference between the fatigue limits of control and 100% recycled concrete to 22%.
With regard to the third phase, as in the previous stages, a decrease in fatigue limit increasing the degree of substitution is observed. The perceptual loss due to the total replacement is around 29% and 35% for the H-0.55ARS and H-0.45ARS respectively. This difference is due to the greater difference in the effective w/c.
In general, the incorporation of 20% of RA, in the worst case, supposes a decrease of the fatigue limit of around 10%. The loss is greater when the effective w/c ratio is lower; affecting the RA more in the more to resistant concretes. In this way it is noted that on increasing the effective w/c ratio, the fatigue limit values tend to approach each other, regardless of the degree of substitution. The results show that the fatigue limit is
influenced by the presence of RA, especially when the effective w/c ratio is low.
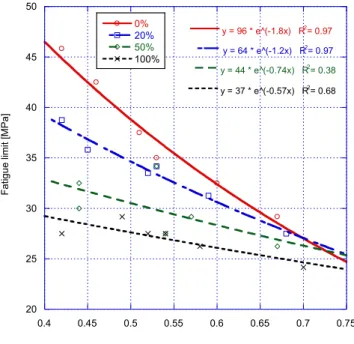
3.4. Fatigue limit versus the effective w/c ratio
Fig. 11 shows the obtained fatigue limits versus the effective w/c ratio of recycled concretes.
The patterns observed show that there is a negative exponential relationship between the w/c ratio of concrete and the fatigue limit. Such dependence increases with the
13
decrease in the degree of substitution of RA. The RA incorporation penalizes the more competent concretes the most. The incorporation of 20% of RA to a control concrete with an effective w/c ratio of 0.55 implies a loss in the fatigue limit that may be offset by a reduction in the w/c ratio of 0.05. Without this correction the loss in the fatigue limit would be slightly greater than 5%, increasing it when the incorporation is performed in control concretes with a lower w/c ratio. In the case of the complete replacement of coarse aggregate with RCA, the loss exceeds 20%.
3.5. Fatigue limit versus compressive strength
Fig. 12 shows the results obtained for fatigue limit versus the compressive strength of the corresponding concretes for the different substitution degrees.
A linear behavior of the fatigue limit versus the compressive strength is observed for the different degrees of substitution. The curves tend to converge when the compressive strengths are lower than 30 MPa. Below this value of compressive strength, the fatigue damage is ruled by the characteristics of the cement paste, the presence of recycled aggregate having no influence. Due to the characteristics of the RA, the compressive strength of the original concrete should be slightly higher to 30 MPa. This suggests that the RAC compressive strength fail by compressive strength of the cement paste. However, when the cement paste compressive strength is higher than 30 MPa the failure initiation takes place in the RA.
Taking a 60 MPa concrete, the incorporation of 20% RA reduces the fatigue limit of the concrete by around 10%. This difference is greater when higher compressive strengths are considered. When the substitution is total, the slope of the fatigue limit is approximately 25% between control and recycled concretes with the same compressive strength.
14
3.6. ITZs of coarse aggregate and new paste
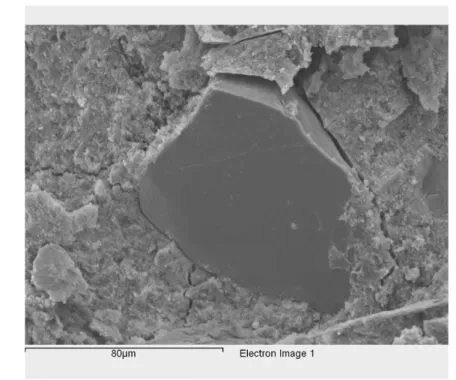
In order to observe the microstructure of RAC, some samples have been analyzed by
SEM. Fig. 13 shows main fracture transmission from the cement paste (w/c=0.53) to a natural aggregate without ITZ failure. The failure of the ITZ of the old paste and the recycled aggregate is shown in Fig. 14. It can be observed that the new cement paste is more compact and closed than the one observed in the old cement paste of the recycled aggregate, Fig. 15. Fig.15 shows the failure of the ITZ of the old mortar with the natural aggregate of the recycled aggregate. When new cement pastes are more compact than those attached to RA, failure take in the internal ITZ of the RA. With RA of higher quality than the new cement paste, the failure usually begins in the old cement paste and it is transmitted to the RA-new cement paste ITZ.
The observed effect is consistent with the obtained results in [35,36,53]. In effect, the microstructural observation of the fracture surface revealed the presence of numerous secondary fractures observable from the main fracture. Is seen, firstly, that microcracks tend to coalesce to form larger cracks along the surface observed principal fracture surface. Moreover, the majority of observed cracks are caused by pores also observed although, it appears that the crack propagated through them.
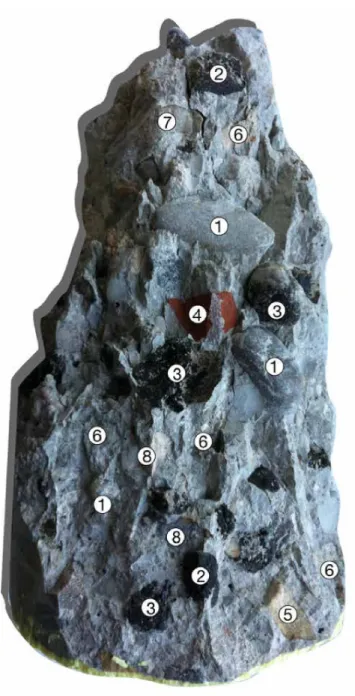
Finally, different types of fractures that can be observed in a tested sample are shown in Fig. 16 corresponding to a H-0.45-100% specimen tested in the j=5 with failure at 457000 cycles. This figure shows fatigue failure of the adhesive bond between the cement paste and natural aggregate from recycled aggregate (1). Macroscopic observation shows loss of binding between surface of recycled aggregate and new cement paste (2). However, (3) shows a recycled aggregate which fracture in the main fracture plane. In the case of ceramic aggregate due to their friability the failure take place through the aggregate (4). The natural aggregate of the old concrete has
15
different origins: siliceous aggregate, limestone and sandstone as in the case of (5) presents failure with the cement paste. The recycled aggregate mortar (6), as in the two previous cases, fails without failure of the interface. In (7) the main fracture propagation occurs also through the aggregate. In general, bond with the crushed aggregate is more resistant than the bond with rounded aggregate, as it is shown in (8).
4 Conclusions
Based on this research, the following conclusions can be obtained:
• The negative effect of the recycled aggregate on the concrete dynamic properties (fatigue) is greater than that caused on the static (compressive strength).
• It was found that the effect of the recycled aggregate on the concrete dynamic response depends not only on the quality of the recycled aggregate but also the new concrete quality.
• The replacement of natural aggregate in control concretes by recycled aggregate lead to a reduction on the fatigue limit. The lowering in the fatigue limit is greater when the fatigue limit or the strength of the control concrete is higher. By contrast, when the fatigue limit or the strength of the control concrete is close to that of the old original concrete from which recycled aggregate was obtained, the reduction is minimal.
• For a compressive strength of the new control concrete less than the compressive strength of the old original concrete, used to obtain the recycled aggregate, the processes of fatigue damage are ruled by the characteristics of the cement paste and the recycled aggregate has little influence on the fatigue
16
behavior. By contrast, when the new concrete is more resistant than the original concrete, the fatigue damage occurs in the recycled aggregate and greatly increases with the rate of substitution.
The use of recycled aggregates obtained from construction and demolition wastes is feasible for the manufacture of recycled structural concretes. Even though, applications in which the recycled concrete is subjected to important cyclic loading, the substitution of 100% of the coarse aggregate is not recommended.
Future work
This paper opens up new lines of research in relation to the fatigue behavior of recycled aggregate concrete. Future research could take as starting the data here presented to make a model of fatigue behavior of any type of recycled concrete as a function of the characteristics of recycled aggregates. Second, further work is the analysis of the surface contaminants or fines affect to the bonding of these to new cement pastes and how does this affect to the mechanical properties.
Acknowledgment
The authors wish to thank to the Spanish Ministry of Environment for the funding of this research. The results contained herein have been achieved under the RECNHOR Project (funded by the Spanish Ministry of Environment) and under the CLEAM Project
(funded by the Spanish Centre for Industrial Technology Development, CDTI) led by the Economic Interest Grouping CLEAM-CENIT, AIE (Acciona, Dragados, Ferrovial,
FCC, Isolux, OHL and Sacyr) and SMEs Informatica 68, Quilosa and Martinez Segovia and associates.
17
References
[1] Hansen TC, Narud H. STRENGTH OF RECYCLED CONCRETE MADE FROM CRUSHED CONCRETE COARSE AGGREGATE. Concr.Int. 1983;5(1):79-83.
[2] Kwan WH, Ramli M, Kam KJ, Sulieman MZ. Influence of the amount of recycled coarse aggregate in concrete design and durability properties. Constr.Build.Mater. 2012 1;26(1):565-73.
[3] Padmini AK, Ramamurthy K, Mathews MS. Influence of parent concrete on the properties of recycled aggregate concrete. Constr.Build.Mater. 2009 2;23(2):829-36.
[4] Tabsh SW, Abdelfatah AS. Influence of recycled concrete aggregates on strength properties of concrete. Constr.Build.Mater. 2009 2;23(2):1163-7.
[5] Topçu İB, Şengel S. Properties of concretes produced with waste concrete aggregate. Cem.Concr.Res. 2004 8;34(8):1307-12.
[6] Rahal K. Mechanical properties of concrete with recycled coarse aggregate. Build.Environ. 2007 1;42(1):407-15.
[7] Katz A. Properties of concrete made with recycled aggregate from partially hydrated old concrete. Cem.Concr.Res. 2003 5;33(5):703-11.
[8] Sánchez M, Alaejos P. Estudio sobre las propiedades del árido reciclado. Utilización en hormigón estructural. : CEDEX - Ministerio de Fomento; 2006.
[9] de Juan MS, Gutiérrez PA. Study on the influence of attached mortar content on the properties of recycled concrete aggregate. Constr.Build.Mater. 2009;23(2):872-7.
[10] Paul Mark Gordon. Low Cycle Fatigue Behavior of Concrete with Recycled Concrete Aggregates. Thesis - Faculty of California Polytechnic State University 2011;June 17(Master of Science in Civil and Environmental Engineering).
18
[11] Luo XW, Yao HL. Deformation and Acoustics Parameters Feature of Recycled Concrete under Cyclic Loading. Applied Mechanics and Materials 2011;80 - 81:213-6.
[12] Luo XW, Yao HL. Experimental Research on Influence of Loading Method on Dynamic Behavior of Recycled Concrete. Advanced Materials Research 2011;Advances in Mechanical Design(199 - 200):1171-4.
[13] Do M-‐‑, Chaallal O, Aïtcin P-‐‑. Fatigue Behavior of High-‐‑Performance Concrete.
Journal of Materials in Civil Engineering 1993;5(1):96.
[14] Yan HQ, Wang QY. Experimental Research on Fatigue Behavior of Recycled Aggregate Reinforcement Concrete from Earthquake-Stricken Area. Advanced Materials Research 2010;160 - 162:906-9.
[15] Yan HQ, Wang QY, Yan Ning. Experimental Research on Fatigue Behavior of Recycled Aggregate Reinforcement Concrete Made from Building Scrap. Advanced Materials Research 2011;339:448-51.
[16] Lee MK, Barr BIG. An overview of the fatigue behaviour of plain and fibre reinforced concrete. Cement and Concrete Composites 2004 5;26(4):299-305.
[17] Alaejos P, Sánchez M, Martínez F, González B, Vázquez E, Barra M, et al. Estudio Prenormativo sobre la utilización de los RCD´s en hormigón reciclado de aplicación estructural (Proyecto RECNHOR) y Reciclado de los RCD´s como áridos de hormigones estructurales (Proyecto CLEAM). : IECA - Instituto Español del Cemento y sus Aplicaciones; 2011.
[18] Arenas M, De Lope F, Serrano JC. The cleam project: CLEAM, efficient and environmentally-friendly construction. Carreteras 2010;4(170):49-56.
[19] CEDEX - Ministerio de Fomento. Informe “Reciclado de RCDs como áridos de hormigones no estructurales”, para el Proyecto CENIT CLEAM. 2009.
19
[20] Ministerio de Fomento. “Instrucción de hormigón estructural (EHE-08)”. 2008.
[21] Martín-Morales M, Zamorano M, Ruiz-Moyano A, Valverde-Espinosa I. Characterization of recycled aggregates construction and demolition waste for concrete production following the Spanish Structural Concrete Code EHE-08. Constr.Build.Mater. 2011 2;25(2):742-8.
[22] Grupo de Trabajo GT 2/5. Perteneciente a la Comisión 2 de ACHE. Utilización de áridos reciclados para hormigones estructurales. Proyecto RECNHOR. I Congreso Nacional de Áridos. ANEFA (Asociación Nacional de Empresarios Fabricantes de Áridos) 2006.
[23] Task Force of the Standing Committee of Concrete. Draft of Spanish Standard for the Use of Recycled Aggregate in the Production of Structural Concrete International Symposium on Concrete Technology for Sustainable Development. CANMET/ACI 2006.
[24] Alaejos P, Domingo A, Lázaro C, Monleón S, Sánchez M. Puente reciclado sobre el río Turia en Manises (Valencia). III Congreso de Puentes y Estructuras de Edificación. Zaragoza. Asociación Científico-Técnica del Hormigón 2008.
[25] Asociación Cientifico Técnica del Hormigón Estructural (ACHE). M-13:Hormigón Autocompactante. Diseño y Aplicación. 2008;.
[26] Thomas C, Setién J, Polanco JA. Determinación de la macroporosidad accesible y no accesible mediante análisis digital de imágenes en hormigones reciclados de
aplicación estructural. X Congreso Nacional de Materiales 2008;II:923-6.
[27] Thomas C, Polanco JA, Setién J, Lombillo I. Durabilidad en ambiente marino de hormigón con incorporación de áridos reciclados procedentes de la trituración de hormigón. XI Congreso Nacional de Materiales 2010.
20
[28] E. Dapena, P.Alaejos, A.Lobet, D.Pérez. Effect of the recycled sand content on the characteristics of mortars and concretes. Journal of Materials in Civil Engineering. 2010;23(4):414-22.
[29] Alaejos P, Sánchez de Juan M, Yepes E, Agrela F. Hormigones reciclados para ambientes agresivos: requisitos de dosificación. CONPAT (XI Congreso Latinoamericano de Patología de la Construcción) 2011.
[30] Thomas C, Setién J, Polanco JA. Daño por fatiga en hormigones reciclados. Anales de mecánica de la fractura 2011;28(1):131-6.
[31] Thomas C, Cimentada A, Setién J, Polanco JA, Rico J, Sosa I. Waste with sulfur from tested concrete specimens as aggregate for structural recycled concrete. WASTES: Solutions, Treatments and Opportunities 1St International Conference 2011;1(1):211.
[32] Thomas C, Sosa I, Setién J, Polanco JA, Medina C. Construction and demolition wastes as aggregate for recycled concrete under marine environments. WASTES: Solutions, Treatments and Opportunities 1St International Conference 2011;1(1):183-9.
[33] Thomas C, Sosa I, Setién J, Polanco JA, Lombillo I. Mechanical behavior of recycled aggregates from concrete waste. WASTES: Solutions, Treatments and Opportunities 1St International Conference 2011;1(1):205-11.
[34] Thomas C, Cimentada A, Polanco JA, Setién J, Méndez D, Rico J. Influence of recycled aggregates containing sulphur on properties of recycled aggregate mortar and
concrete. Composites Part B: Engineering 2013;45(1):474-85.
[35] Thomas C, Setién J, Polanco JA, Alaejos P, Sánchez de Juan M. Durability of recycled aggregate concrete. Constr.Build.Mater. 2013 3;40(0):1054-65.
21
[36] Thomas C, Sosa I, Setién J, Polanco JA, Cimentada AI. Evaluation of the fatigue
behaviour of recycled aggregate concrete. J.Clean.Prod.
2013;http://dx.doi.org/10.1016/j.jclepro.2013.09.036(In Press).
[37] EN 12390-1. Testing hardened concrete. Part 1: Shape, dimensions and other requirements for specimens and moulds. 2001.
[38] EN 12390-2. Testing hardened concrete - Part 2: Making and curing specimens for strength tests. 2009.
[39] EN-12390-7. Testing hardened concrete - Part 7: Density of hardened concrete. 2009.
[40] EN-12390-6. Testing hardened concrete - Part 6: Tensile splitting strength of test specimens. 2010.
[41] EN 12390-3. Testing hardened concrete - Part 3: Compressive strength of test specimens. 2009.
[42] EN 12390-4. Testing hardened concrete - Part 4: Compressive strength - Specification for testing machines. 2001.
[43] UNE-83316. Concrete tests. Determination of the modulus of elasticity in compression. 1996.
[44] RABBE P, POMEY G, BASTENAIRE F. COMPARISON OF FATIGUE VALUES,
DEPENDING ON METHOD OF DETERMINATION AND ON TYPE OF STRESSING, Rev de Metallurgie 1969;66(2):129-45.
[45] MAENNIG WW. Comparative study of the suitability of the staircase method for fatigue strength evaluation, (Vergleichende Untersuchung ueber die Eignung der
22
Treppenstufen- Methode zur Berechnung der Dauerschwingfestigkeit). Materialpruefung/Materials Testing 1971;13(1):6-11.
[46] Deubelbeiss E. Fatigue Tests Using a Modified Staircase Method. Materialpruefung/Materials Testing 1974;16(8):240-4.
[47] EN 14587-1. Railway applicatios – Track – Flash butt welding of rails – Part 1: New 220 and 260 Grade Rails in afixed plant. 2002.
[48] Braem MJA, Davidson CL, Lambrechts P, Vanherle G. In vitro flexural fatigue limits of dental composites. J.Biomed.Mater.Res. 1994;28(12):1397-402.
[49] Rassier DE, MacIntosh BR. Coexistence of potentiation and fatigue in skeletal muscle. Brazilian Journal of Medical and Biological Research 2000;33(5):499-508.
[50] Alliche A, François D. Fatigue behavior of hardened cement paste. Cem.Concr.Res. 1986 3;16(2):199-206.
[51] Kim J, Kim Y. Fatigue crack growth of high-strength concrete in wedge-splitting test. Cem.Concr.Res. 1999 5;29(5):705-12.
[52] Alliche A. Damage model for fatigue loading of concrete. Int.J.Fatigue 2004 9;26(9):915-21.
[53] Xiao J, Li H, Yang Z. Fatigue behavior of recycled aggregate concrete under compression and bending cyclic loadings. Constr.Build.Mater. 2013 1;38(0):681-8.
1 0 20 40 60 80 100 0.01 0.10 1.00 10.00 100.00
Sieve size (log. scale) [mm]
Pe rce n t p assi n g [% ] 0 20 40 60 80 100 Sand (0/6) Gravel (6/12) Gravel (12/20) RA (6/20) Pe rc e n t re ta in e d [ % ]
Fig. 1. Grading of natural aggregates (NA) and recycled aggregates (RA).
0 500 1000 1500 2000 2500 0 5 105 1 106 1.5 106 2 106 S trai n [ um/m ] Cycle [N]
Fig. 2. Strain versus cycles of a concrete specimen that exceeds 2·106 cycles.
2 0 500 1000 1500 2000 2500 0 5 105 1 106 1.5 106 2 106 S trai n [ um/m ] Cycle [N] A B C
Fig. 3. Strain versus cycles of a concrete specimen with failure before the 2·106 cycles.
3
Fig. 5. Crack growth.
4 0.75 0.8 0.85 0.9 0.95 1 0 5 105 1 106 1.5 106 2 106 R el at ive s tif fn ess Cycle [N] j = 7 j = 6 j = 5
Fig. 7. Relative stiffness of different stress levels versus the number of cycles in control concrete. 0.75 0.8 0.85 0.9 0.95 1 0 5 105 1 106 1.5 106 2 106 R el at iv e s tif fne ss Cycle [N] j = 7 j = 6 j = 5
Fig. 8. Relative stiffness of different stress levels versus the number of cycles in 20% recycled concrete.
5 0.75 0.8 0.85 0.9 0.95 1 0 5 105 1 106 1.5 106 2 106 R el at ive st iff ne ss Cycle [N] j = 7 j = 6 j = 5
Fig. 9. Relative stiffness of different stress levels versus the number of cycles in 50% recycled concrete. 0.75 0.8 0.85 0.9 0.95 1 0 5 105 1 106 1.5 106 2 106 R el at iv e st iff n es s Cycle [N] j = 5 j = 4 j = 3
Fig. 10. Relative stiffness of different stress levels versus the number of cycles in 100% recycled concrete.
6 20 25 30 35 40 45 50 0.4 0.45 0.5 0.55 0.6 0.65 0.7 0.75 0% 20% 50% 100% y = 96 * e^(-1.8x) R2 = 0.97 y = 64 * e^(-1.2x) R2= 0.97 y = 44 * e^(-0.74x) R2 = 0.38 y = 37 * e^(-0.57x) R2= 0.68 F a tig u e li mi t [MPa ]
Effective water/cement ratio [w/c]
Fig. 11. Fatigue limit versus the effective water/cement ratio of recycled concretes.
10 15 20 25 30 35 40 45 50 20 30 40 50 60 70 80 0% 20% 50% 100% y = 0.32 + 0.64x R2= 0.99 y = 1.2 + 0.58x R2= 0.98 y = 2.9 + 0.51x R2= 0.89 y = 4.5 + 0.44x R2= 0.84 F at ig ue li m it [M Pa ]
Compressive strength [MPa]
7
Fig. 13. Micrograph of the main fracture surface of a H-0,50-0% after failure in fatigue.
8
9
1 Table 1.
Table 2. Chemical composition by XRF of the cement.
Cement CaO SiO2 Al2O3 Fe2O3 SO3 K2O MgO TiO2 C
CEM I 52,5 N/SR 69.6 18.6 3.1 2.66 3.22 0.54 1.17 0.17 0.47
Table 3. Properties of the coarse aggregate.
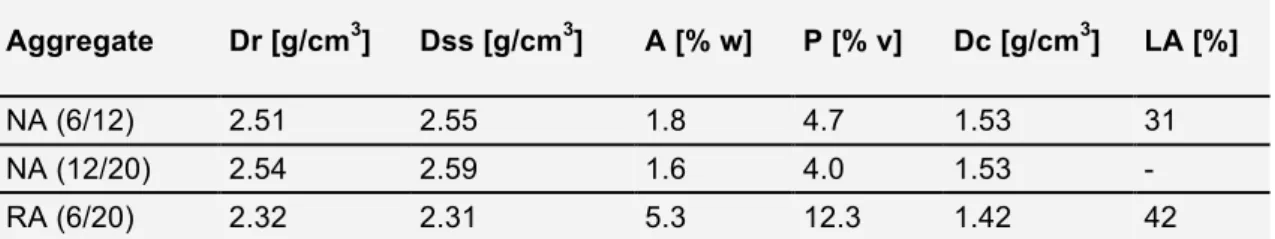
Aggregate Dr [g/cm3] Dss [g/cm3] A [% w] P [% v] Dc [g/cm3] LA [%]
NA (6/12) 2.51 2.55 1.8 4.7 1.53 31
NA (12/20) 2.54 2.59 1.6 4.0 1.53 -
RA (6/20) 2.32 2.31 5.3 12.3 1.42 42
Where Dr is the relative density of particle (g/cm3); Dss is the density of particle saturated with dry surface (g/cm3); A is the water absorption (% weight); P is the open porosity (% vol.); Dc is the aggregate density (g/cm3); LA is the Los Ángeles Index (% weight).
2
Table 4. Mix proportions, fress, physical and mechanical propierties of concretes.
Designation: H-0.65 H-0.50 H-0.65AS H-0.50AS H-0.55ARS H-0.50ARS
Substitution: 0% 20% 50% 100% 0% 20% 50% 100% 0% 20% 50% 100% 0% 20% 50% 100% 0% 20% 50% 100% 0% 20% 50% 100% Cement (kg): 275 275 275 275 380 380 380 380 275 275 275 275 380 380 380 380 325 325 325 325 385 385 385 385 Water (kg): 179 179 179 179 190 190 190 190 179 179 179 179 190 190 190 190 179 179 179 179 173 173 173 173 Sand (kg): 843 878 849 868 714 744 710 715 948 961 978 1010 806 813 822 836 875 799 831 825 814 698 742 746 Gravel (12/20) (kg): 752 565 350 0 882 665 414 0 513 378 209 0 702 522 290 0 755 628 367 0 871 748 432 0 Gravel (6/12) (kg): 226 170 105 0 122 92 57 0 490 362 199 0 330 245 136 0 254 211 123 0 168 144 83 0 RA (12/20) (kg): 0 184 455 830 0 189 471 874 0 185 408 640 0 192 427 683 0 210 490 923 0 223 515 963 Effective w/c ratio: 0.60 0.59 0.57 0.54 0.46 0.45 0.44 0.42 0.67 0.68 0.67 0.70 0.53 0.53 0.53 0.52 0.51 0.52 0.54 0.58 0.42 0.42 0.44 0.49 Fress slump (cm): 17 21 16 15 16 18 15 14 15 18 17 17 20 19 18 21 16 15 17 18 18 17 17 19 Relative density (g/cm3): 2.41 2.40 2.38 2.38 2.48 2.45 2.45 2.43 2.38 2.35 2.34 2.30 2.43 2.41 2.40 2.37 2.43 2.42 2.40 2.34 2.49 2.46 2.40 2.39 Porosity (% vol.): 12.3 12.6 11.4 11.5 10.0 9.7 10.0 10.1 13.7 14.8 16.8 18.5 10.5 11.5 13.4 12.6 10.6 12.5 13.9 15.7 9.6 9.6 10.8 13.5 Compressive strength (MPa): 47.8 49.3 47.5 53.7 62.0 64.8 63.5 65.1 62.0 64.8 63.5 65.1 57.3 54.9 51.5 50.3 60.1 56.5 48.9 43.1 72.9 67.4 61.2 53.7 Tensile strength (MPa): 3.95 4.05 4.72 4.91 4.62 4.74 4.78 4.97 2.71 2.51 2.43 2.31 3.68 3.23 2.66 2.43 3.27 2.88 2.56 2.37 4.10 3.52 2.90 2.53 Elastic modulus (GPa): 34.2 32.3 30.5 30.1 37.4 36.1 34.0 31.4 34.9 32.2 30.1 26.8 34.9 33.8 32.7 30.2 36.3 35.5 33.4 31.5 38.7 35.9 32.9 28.4
3
Table 5. Parameters of fatigue in compression stress levels.
Stress level j Lower limit [MPa] Upper limit [MPa] Midpoint [MPa] Amplitude [MPa] Frequency [Hz] 1 5 10 7.5 2.5 10 2 5 15 10.0 5.0 10 3 5 20 12.5 7.5 10 4 5 25 15.0 10.0 10 5 5 30 17.5 12.5 10 6 5 35 20.0 15.0 10 7 5 40 22.5 17.5 10 8 5 45 25.0 20.0 10 9 5 50 27.5 22.5 10 10 5 55 30.0 25.0 10
Table 6. STAIRCASE results of the H-0,45ARS-100% recycled concrete
Stress level Specimens of H-0,45ARS-100%
j Δσ [MPa] 1 2 3 4 5 6 7 8
7 35 X
6 30 X O X
5 25 O O O
4 20 O
4 Table 7. Fatigue limit of the different mixtres.
Mixture Fatigue limit [MPa] Standard deviation [MPa] % Rc [%]
H-0.65AS-0%: 32.5 1.2 68.0 H-0.65AS-20%: 31.3 1.4 63.4 H-0.65AS-50%: 29.2 3.4 61.5 H-0.65AS-100%: 27.5 4.1 51.2 H-0.50-0%: 42.5 0.4 68.6 H-0.50-20%: 35.8 2.2 55.3 H-0.50-50%: 30.0 1.6 47.3 H-0.50-100%: 27.5 4.6 42.3 H-0.65AS-0%: 29.2 2.0 63.9 H-0.65AS-20%: 27.5 2.6 65.6 H-0.65AS-50%: 26.3 0.2 70.2 H-0.65AS-100%: 24.2 2.0 79.1 H-0.50AS-0%: 35.0 0.2 61.1 H-0.50AS-20%: 34.2 1.2 62.2 H-0.50AS-50%: 34.2 0.2 66.4 H-0.50AS-100%: 27.5 4.1 54.7 H-0.55ARS-0%: 37.5 2.3 62.4 H-0.55ARS-20%: 33.5 2.3 59.3 H-0.55ARS-50%: 27.5 2.0 56.3 H-0.55ARS-100%: 26.3 0.2 60.9 H-0.45ARS-0%: 45.8 1.2 62.9 H-0.45ARS-20%: 38.8 1.6 57.5 H-0.45ARS-50%: 32.5 2.1 53.1 H-0.45ARS-100%: 29.2 2.4 54.3