DIVERGING RESULTS OF AREAL AND VOLUMETRIC BONE MINERAL
DENSITY IN DOWN SYNDROME
M. García-Hoyos
1· M.T. García-Unzueta
1· D. de Luis
2· C. Valero
1· J.A.
Riancho
1Department of Internal Medicine. University Hospital Marqués de Valdecilla
1.
University of Cantabria. RETICEF. IDIVAL. Santander. Spain.
Department of Internal Medicine. University Hospital Rio Hortega
2. Valladolid. Spain
CONFLICT OF INTEREST: M. García-Hoyos, M.T. García-Unzueta, D. de Luis, C.
Valero and J.A. Riancho declare that they have no conflict of interest.
Abstract
Summary Population with Down syndrome (DS) has lower areal BMD, in association with their smaller
skeletal size. However, volumetric BMD and other indices of bone microarchitecture, such as trabecular bone score (TBS) and calcaneal ultrasound (QUS), were normal.
Introduction Patients with DS have a number of risk factors that could predispose them to osteoporosis.
Several studies reported that people with DS also have lower areal bone mineral density, but differences in the skeletal size could bias the analysis.
Methods 75 patients with DS and 76 controls without intellectual disability were recruited. Controls were
matched for age and sex. Bone mineral density (BMD) was measure by DXA and volumetric bone mineral density (vBMD) was calculated by published formulas. Body composition also measured by DXA. Microarchitecture was measured by TBS and QUS. Serum 25OHD, PTH, P1NP and CTX were also determined. Physical activity was assessed by International Physical Activity Questionnaires (IPAQ-short form). To evaluate nutritional intake we recorded 3 consecutive days of food.
Results DS individuals had lower height (151±11 cm vs. 169±9 cm). BMD was higher in controls (LS
0.903±0.124 g/cm2 in patients and 0.997±0.115 g/cm2 in controls; FN 0.761±.126 g/cm2 and 0.838±0.115
g/cm2 respectively). vBMD was similar in the DS group (LS: 0.244±0.124 g/cm3; FN: 0.325±.0.073 g/cm3)
and controls (LS: 0.255±0.033 g/cm3; FN: 0.309±0.043 g/cm3. Microarchitecture measured by QUS was
slightly better in DS and TBS measures were similar in both groups. 25OHD, PTH and CTX were similar in both groups. P1NP was higher in DS group. Time spent on exercise was similar in both group but intensity was higher in control group. Population with DS have correct nutrition.
Conclusions Areal BMD is reduced in DS, but it seems to be related to the smaller body and skeletal size.
In fact, the estimated volumetric BMD is similar in patients with DS and in control individuals. Furthermore, people with DS have normal bone microarchitecture
Introduction
Down syndrome (DS) is the most common intellectual disability and the most frequent chromosomal abnormality among live births1,2,3. Patients with DS have a number of risk factors that theoretically could
predispose them to osteoporosis, such as reduced muscle tone and physical activity, limited sun exposure (due to institutionalization, physical disabilities or skin diseases4), frequent comorbidities (thyroid
disorders, hypogonadism, celiac disease, etc.), and drug therapies (corticoid or antiepileptic)5,6. On the
other hand, individuals with DS have a typical phenotype, including a reduced height and smaller skeletal size. Several studies7,8,9 reported that people with DS also have lower areal bone mineral density (BMD),
but few of them have taken into account the morphological differences of bone, and particularly the differences in bone size. Since the areal BMD (aBMD) estimates from the DXA machines represent the bone mineral content (BMC) divided by the projected area, it does not fully account for bone volume volume. As a consequence, BMD is underestimated in individuals with shorter height, making the true volumetric BMD (vBMD) a better index of the skeletal status than areal BMD10,11. In a previous study we
found that skeletal size differences were largely responsible for the apparent differences in aBMD between patients with DS and normal individuals. In the present study we aimed to confirm those results in a larger group of individuals with DS, to provide the reference ranges of aBMD in this population and to analyze the nutritional, anthropometric and lifestyle factors determining bone mass.
Materials y methods Study population
We included 151 men and women (75 with DS and 76 controls) over 18 years of age. Patients with DS were recruited from our DS clinic at the University Hospital Marqués de Valdecilla and the Down Syndrome Foundation of Cantabria (Spain). A convenience control group was recruited among volunteer hospital matched for age and sex distribution. Informed consent was obtained from the volunteers and the patients or their tutors. Exclusion criteria were the refusal to participate in the study, pregnancy, previous osteoporosis treatment or physical disability that does not allow the realization of the densitometry. All participants were studied in the same period (November-December) to avoid seasonal differences in vitamin D levels.
Clinical and risk factor assessment
Data were obtained with a standardized interview and physical exam by one of the authors (MGH). Items included were age, sex, height (cm.), weight (kg.) and body mass index (BMI; Kg/m2), risk factors for
osteoporosis (physical activity, sun exposure and calcium intake), comorbidities and treatments (anticonvulsant, anticoagulants, corticoid, diuretics, psychotropic) in the last 3 months, and also a history of fractures. Physical activity was assessed by International Physical Activity Questionnaires (IPAQ-short form). It can quantify days in the week and minutes in the day people practice vigorous, moderate or low intensity exercise and it allows an estimation of the metabolic rate (in MET-minute/week)12.We elaborated
a sun-exposure questionnaire to estimate the amount of exposure, their preferences, sunscreen and UV radiation use. To evaluate nutritional intake we recorded 3 consecutive days of food; participants registered all kinds of food ingested and the amounts13. Using the software Dietsource 3.0 (Nestle, Gen, Sw) the
amount of macronutrients, minerals, fatty acids and vitamins ingested was estimated.
Biochemical measurements
Blood samples were obtained in a fasting state between 09:00 and 12:00 am. Routine chemistries were analyzed the same day. Other parameters were analyzed in serum aliquots stored at -80ºC until the samples were processed. Serum total calcium and albumin measurements were determined by standard automated methods in an ADVIA 2400 Chemistry System (Siemens Medical Solutions Diagnostics, Los Angeles, CA USA). Serum concentrations of 25-hydroxyvitamin D (25-OHD), parathyroid hormone (PTH), aminoterminal propeptide of type collagen (P1NP) and C-terminal telopeptide of type I collagen (CTX) were determined by chemiluminescent immunoassay specific in a iSYS (IDS-iSYS Multi-Discipline Automated Analyser, Pouilly-en Auxois, France). The detection limit of serum 25-OHD was 5ng/ml, its intra-assay coefficient of variation (CV) was <10 and its inter-assay CV was <15. The detection limit of PTH was 6 pg/ml, with a normal range of 10-45 pg/ml. Intra-assay and inter-assay CV were 2.6% and 5.8%, respectively. The P1NP limit of detection was 0.14 ng/ml (normal range 21-78 ng/ml in men and 19-102 in women), with an intra-assay and assay CV of 2.9% and 4.7%, respectively. The intra-assay and inter-assay CV of β-CTX was 3.2% and 6.2% (normal range: 0,115-0,748 in men; 0.112-0.738 premenopausal woman and 0.142-1.351 ng/ml postmenopausal women). Testosterone and estradiol were determined by automated competitive immunoassay in an ADVIA Centaur (Siemens Medical Solutions Diagnostics). Intra-assay and inter-assay CV of testosterone were 6.2% and 4.4% respectively, and the normal range was
2.41-8.27 ng/ml in men and 0.14–0.76 ng/ml in women. Regarding estradiol, the normal range was <50 pg/ml in men and in women it varies according to follicular phase; intra-assay CV was 7.4% and inter-assay was 8.1%.
Bone mass and body composition measurements
BMC and aBMD were measured by DXA (Hologic QDR 4500, Waltham, MA) at the lumbar spine in L1-L4 (LS), femoral neck (FN) and total hip (TH) regions. In vivo precision was 0.51% in LS, 0.47% in FN, y 0.42% in TH. Results were expressed as grams per square centimeter and Z-score (defined as the number of SDs below the mean value for women of the same age). Z-score was calculated according to the NHANES III reference database for femur measurements14.Quality control was performed following the
usual standards. Due to the influence of bone size, we calculated vBMD at LS and FN using known formulas previously published15,16. Body composition was also analyzed by DXA to assess fat mass and
lean mass (both in grams and percentage) at the subtotal corporal (not including the head in the analysis). The trabecular bone score (TBS) was analyzed by the software v2.1. Quantitative ultrasound heel (QUS) measurements were performed in the right calcaneus using a Sahara sonometer (Hologic, Walthman, MA). This equipment measures the broadband ultrasound attenuation (BUA in decibel per megahertz) and the speed of sound (SOS in meters per second).This device also combines the values of BUA and SOS to yield a parameter known as the “quantitative ultrasound index” (QUI), based on the following linear equation: QUI=0.41 x (BUA+SOS)-571.
Data analysis
The results were expressed as mean±SD for quantitative variables and percentages for qualitative variables. For the comparison of groups, quantitative variables were analyzed by Student´s test if the variables have normal distribution, or Mann-Whitney test if the parameters did not have a normal distribution. The Chi-squared or Fisher´s exact tests were used to identify differences in categorical variables between groups. A univariate linear regression analysis was carried out with either aBMD or vBMD as the dependent variables. Later, a multivariate regression analyses was done using as predictors the factors that appeared as significant in the univariate analysis. A value of p<0.05 was considered statistically significant.
Results
Demographic and clinical data
Mean age was 33±10 yrs. in DS and 33±10 yrs. in controls, with a 52% of males in both groups. People with DS had lower weight (60.4±11.0 kg vs. 69.5±13.4 kg; p=1.0x10⁻⁵) and height (151±11 cm vs. 169±9
cm; p=1.0x10⁻¹³) than the controls, but the BMI was higher (26.5±4.4 vs. 24.1±3.5 kg/m2; p=0.003). The
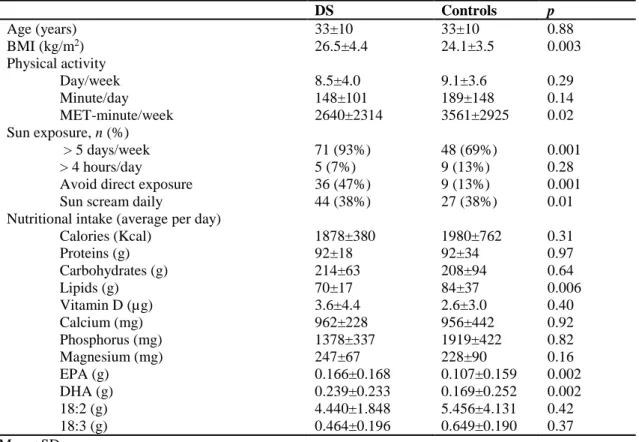
characteristics are shown in table 1. When we assessed total physical activity, people with DS exercised for a similar amount of time (in days per week and minutes per day), but the intensity (measured as MET-minute per week) was lower than that of the controls. In fact, the amount of moderate and light exercise was similar in both groups. DS participants have more frequent sun exposure in days per week, but they tried to avoid direct exposure and used sun cream more frequently.
Regarding diet, macronutrient intake was similar in DS and the control group, except lipid intake, which was higher in the DS group. In general, people with DS have a higher intake of some vitamins (such as B1, B2, B6, B12, C or A), but a similar intake of vitamin D. The intake of calcium, magnesium and phosphorus was also similar in both groups. Regarding minerals, we only found differences in potassium and copper intake. The intake of Omega-3 fatty acids, like EPA or DHA, was higher in DS group (Table 1).
As expected, patients with DS had more comorbidities than the general population. We found higher prevalence of hypothyroidism (37% vs. 0%; p<0.001), congenital heart disease (21% vs. 7%; p=0.009), epilepsy (7% vs. 0%; p=0.028), cataracts (12% vs. 1%; p=0.008) and skin disorders (12% vs. 0%; p=0.001). Accordingly, they took more frequently anticonvulsants (7% vs. 0%; p=0.028) and psychotropic drugs (22% vs. 4%; p=0.001). The prevalence of other diseases such as hypertension, diabetes mellitus, dementia, cancer (including solid organ tumors and leukemia) or celiac disease did not show statistically significant differences, but the absolute frequencies were low. The prevalence of fractures was similar, 11% in DS group and 12% in control group (p=0.35) and most of these occur in long bones (9% vs. 14%; p=0.23).
Table 1. Baseline characteristics DS Controls p Age (years) 33±10 33±10 0.88 BMI (kg/m2) 26.5±4.4 24.1±3.5 0.003 Physical activity Day/week 8.5±4.0 9.1±3.6 0.29 Minute/day 148±101 189±148 0.14 MET-minute/week 2640±2314 3561±2925 0.02 Sun exposure, n (%) > 5 days/week 71 (93%) 48 (69%) 0.001 > 4 hours/day 5 (7%) 9 (13%) 0.28
Avoid direct exposure 36 (47%) 9 (13%) 0.001
Sun scream daily 44 (38%) 27 (38%) 0.01
Nutritional intake (average per day)
Calories (Kcal) 1878±380 1980±762 0.31 Proteins (g) 92±18 92±34 0.97 Carbohydrates (g) 214±63 208±94 0.64 Lipids (g) 70±17 84±37 0.006 Vitamin D (µg) 3.6±4.4 2.6±3.0 0.40 Calcium (mg) 962±228 956±442 0.92 Phosphorus (mg) 1378±337 1919±422 0.82 Magnesium (mg) 247±67 228±90 0.16 EPA (g) 0.166±0.168 0.107±0.159 0.002 DHA (g) 0.239±0.233 0.169±0.252 0.002 18:2 (g) 4.440±1.848 5.456±4.131 0.42 18:3 (g) 0.464±0.196 0.649±0.190 0.37 Mean±SD
Bone mass, TBS and QUS measurements
Absolute values of aBMD and the corresponding Z-scores were lower in individuals with DS with respect to the control group in all localizations. In LS it was -1.40±1.23 in DS and -0.50±1.08 in controls (p< 0.001), in FN it was -0.80±0.94 in DS and -0.14±0.85 in controls (p<0.001) and in TH -1.06±0.76 in DS and -0.15±0.89 in controls (p<0.001). However there were no differences in the estimated vBMD in the two groups (Table 2). TBS was also similar in DS and the control group (1456±84 in DS vs. 1474±84 in controls; p=0.18). In fact, 90% of DS patients and 94% controls had normal bone microarchitecture (TBS>1350). Calcaneal ultrasound parameters were higher in participants with DS than in the controls. The average BUA was 79±32 dB/MHz in DS and 70±20 dB/MHz in controls (p=0.04); SOS, 1578±47 m/s in DS and 1549±33 m/s in controls (p<0.001); and QUI 108±31 in DS and 93±21 in controls (p=0.001).
Body composition
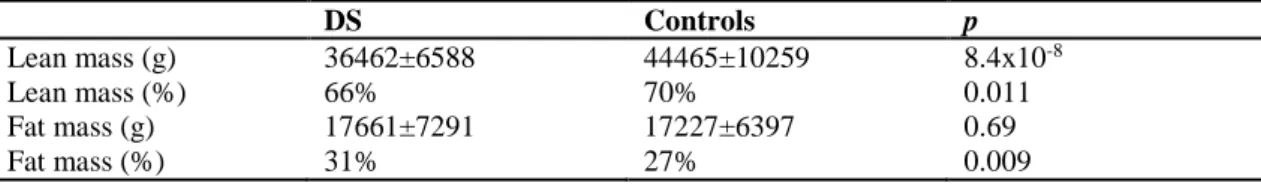
Individuals with DS have less lean mass than the controls, both in absolute values and as percentage of body weight. Regarding the fat mass, the absolute values were similar in both groups, nevertheless, but the relative proportion of body weight accounted for fat was higher in the DS group (Table 3).
Table 2. Bone mineral density and volumetric bone mineral density BMD (g/cm2) vBMD (g/cm3) DS Controls p DS Controls p LS 0.903±0124 0.997±0115 <0.001 0.244±0.124 0.255±0.033 0.06 FN 0.761±0.126 0.838±0.115 <0.001 0.325±0.073 0.309±0.043 0.10 TH 0.831±0.113 0.949±0.127 <0.001
Mean±SD. LS: lumbar spine, FN: femoral neck, TH: total hip, BMD: bone mineral density, vBMD: volumetric bone mineral density.
Table 3. Body composition
DS Controls p Lean mass (g) 36462±6588 44465±10259 8.4x10⁻⁸ Lean mass (%) 66% 70% 0.011 Fat mass (g) 17661±7291 17227±6397 0.69 Fat mass (%) 31% 27% 0.009 Mean±SD
Bone and mineral metabolism
No differences were found in serum albumin-corrected calcium (9.0±0.4 in DS vs. 9.1±0.3 mg/dl in controls, p=0.14). Serum 25OHD levels were similar in both groups (22.6±7.9 ng/ml in DS and 24.8±9.5 ng/ml in controls; p=0.14); also PTH levels were similar (24.3±10.3 pg/ml and 26.1±13.7 pg/ml respectively; p=0.61). The prevalence of hypovitaminosis D (25OHD < 20 ng/ml) was 39% in DS and 35% in controls (p=0.39). Regarding bone turnover levels, β-CTX levels were similar in both groups, but P1NP and alkaline phosphatase levels were higher in people with DS. Serum testosterone levels were lower in males with DS than in controls, whereas no differences existed in serum estradiol (Table 4).
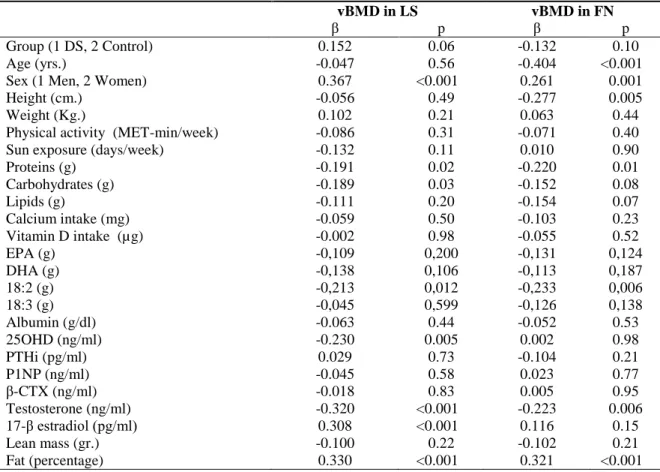
Factors associated with volumetric BMD
Some variables showed a relationship with vBMD in LS and FN in univariate regression analysis. The association was negative for age, height, protein intake and testosterone levels, and positive with the female sex and the percentage of fat mass (Table 5). In the multivariate analysis, only female sex remained positively associated with vBMD in LS (β-coefficient 0.417, p=0.042), whereas age and the fat mass (as percentage of body weight) were associated with vBMD in FN (β-coefficient -0.343, p=0.001 with age and β-coefficient 0.298, p=0.012 with fat mass).
Table 4. Bone metabolism parameters
DS Controls p
Albumin (g/dl) 4.1±0.2 4.5±0.3 <0.001
Alkaline phosphatase (U/l) 81.7±20.4 64.4±18.5 <0.001
25OHD (ng/ml) 22.6±7.9 24.8±9.5 0.14 PTHi (pg/ml) 24.3±10.3 26.1±13.7 0.61 P1NP (ng/ml) 40.4±23.3 30.8±18.0 0.005 β-CTX (ng/ml) 0.35±0.23 0.32±0.25 0.24 Testosterone (ng/ml) Men 4.3±1.6 5.3±2.0 0.02 Women 0.5±0.2 0.5±0.2 0.67 17-β estradiol (pg/ml) Men 44.5±11.5 39.7±13.8 0.10 Women 147.3±121.6 129.4±74.1 0.45
Mean±SD. 25OHD: 25-hidroxyvitamin D; PTH: parathyroid hormone; P1NP: procollagen type 1 N propeptide; β-CTX: C-terminal telopeptide of type I collagen
Table 5. Univariate regression analysis
vBMD in LS vBMD in FN
β p β p
Group (1 DS, 2 Control) 0.152 0.06 -0.132 0.10
Age (yrs.) -0.047 0.56 -0.404 <0.001
Sex (1 Men, 2 Women) 0.367 <0.001 0.261 0.001
Height (cm.) -0.056 0.49 -0.277 0.005
Weight (Kg.) 0.102 0.21 0.063 0.44
Physical activity (MET-min/week) -0.086 0.31 -0.071 0.40
Sun exposure (days/week) -0.132 0.11 0.010 0.90
Proteins (g) -0.191 0.02 -0.220 0.01 Carbohydrates (g) -0.189 0.03 -0.152 0.08 Lipids (g) -0.111 0.20 -0.154 0.07 Calcium intake (mg) -0.059 0.50 -0.103 0.23 Vitamin D intake (µg) -0.002 0.98 -0.055 0.52 EPA (g) -0,109 0,200 -0,131 0,124 DHA (g) -0,138 0,106 -0,113 0,187 18:2 (g) -0,213 0,012 -0,233 0,006 18:3 (g) -0,045 0,599 -0,126 0,138 Albumin (g/dl) -0.063 0.44 -0.052 0.53 25OHD (ng/ml) -0.230 0.005 0.002 0.98 PTHi (pg/ml) 0.029 0.73 -0.104 0.21 P1NP (ng/ml) -0.045 0.58 0.023 0.77 β-CTX (ng/ml) -0.018 0.83 0.005 0.95 Testosterone (ng/ml) -0.320 <0.001 -0.223 0.006 17-β estradiol (pg/ml) 0.308 <0.001 0.116 0.15 Lean mass (gr.) -0.100 0.22 -0.102 0.21 Fat (percentage) 0.330 <0.001 0.321 <0.001
25OHD: 25-hidroxyvitamin D; PTH: parathyroid hormone; P1NP: procollagen type 1 N propeptide; β-CTX: C-terminal telopeptide of type I collagen
Reference values in DS population
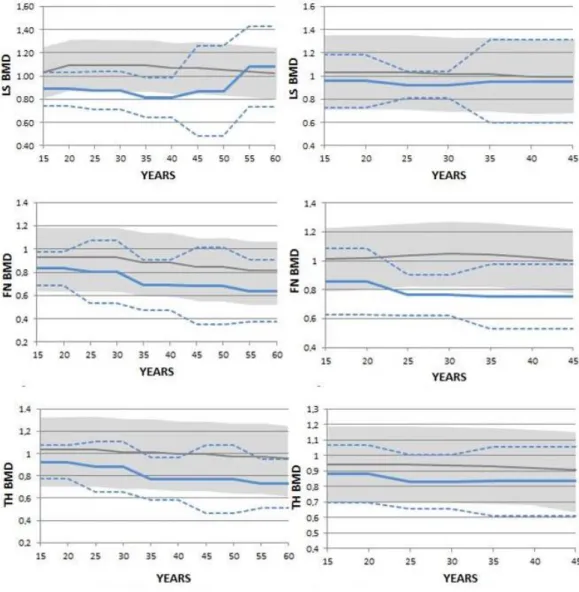
Since the volumetric values are not usually provided in the DXA output, we built reference charts for aBMD in the DS population as a tool for the everyday care of these patients. Therefore, we plotted BMD against
age in males and females with DS and also compared the distribution with the standard reference values for the normal population (Hologic reference in lumbar spine and NHANES in hip). As shown in figures 1, BMD values in the DS group were lower than in the general population, but the course over lifetime was similar in both groups.
Figure 1: BMD (g/cm2) evolution in males (left) and females (right). The DS population is representated
as a continuous blue line (mean) and discontinous (±2 SD) blue line and the general population is represented as a grey line (mean) and a grey zone (±2 SD).
LS BMD: lumbar spine bone mineral density; FN BMD: femoral neck bone mineral density and TH BMD: total hip bone mineral density.
Discussion
In this study we confirmed that people with DS have lower aBMD (g/cm2) than the general population. The
average differences were 10% in LS, 9% in FN and 12% in TH. These results are similar to other studies 7-11. Several factors might explain these differences. Patients with DS have an accelerated ageing process,
but also less bone mass have been demonstrated in the DS population at an early age17, thus suggesting the
involvement of other factors besides aging. The DS population has growth retardation and a limited growth span, resulting in shorter height7-12. Accordingly, they have smaller bones. This fact is very important
because it is known that bone size affects BMD measurement by DXA. BMD is calculated as the ratio between bone mineral content and bone area, but it does not take into account bone depth. Therefore, smaller bones tend to have lower area BMD than bigger bones. This is the reason why we determined vBMD instead in addition to aBMD. Indeed, we confirmed our previous results, showing that bone size is the major factor explaining the reduced aBMD in the DS population, as reflected by the fact that vBMD was similar in both groups. In line with this concept, the bone quality, measured by QUS and TBS (techniques no influenced by bone size), was also similar in both groups. Therefore, our data show that most people with DS have “healthy bones”. Since we are not aware of other studies measuring TBS in DS patients, it will be interesting to know if such a good bone quality is found in DS patients from other regions, as well as in patients of a more advanced age
With respect to lifestyle, we found no differences between DS and controls regarding light exercise, but patients were less engaged in activities requiring vigorous exercise. Other studies obtained similar results18,19,20. Regarding the dietary habits, in general, people with DS had a healthy diet. Similarly to other
reports21,22 calorie, protein, calcium and carbohydrate intakes were similar in both groups. The DS
population ingested fewer lipids than the control group; nevertheless, they ingested more DHA and EPA. Regarding the body composition analysis, it can be observed that people with DS have less lean mass and higher percentages of body fat than controls. People with DS have several factors that, in theory, could lead to lower 25OHD levels, but we found no difference in 25OHD levels nor in the prevalence of hypovitaminosis D, defined as (25OHD < 20ng/ml (39%), which were similar to those of controls, and lower than that described in others studies that reported prevalence of hypovitaminosis D between 74 and 93% 23,24. With respect to the markers of bone resorption, the β-CTX levels were similar in both groups.
However, the marker of bone formation P1NP and the alkaline phosphatase levels were higher in the DS group. There is only one study that evaluated bone turnover markers in DS and the results were contrary to
ours, with lower levels of P1NP25. The reasons for this discrepancy and the factors involved need further
studies.
Our study also allowed to build some charts showing the evolution of aBMD in relation to age in people with DS. We feel that these graphs can be very useful for clinicians caring for patinets with DS.
This study has several limitations. Thus, we estimated vBMD with formulas that model bones as perfect cubes and cylinders, and are less accurate than other methods, such as quantitative CT. Nevertheless, the consistency of our results provide good support for the conclusions. Also, the control group was not a random sample of the population, but healthy volunteers. Therfore, they may be a sort of “supercontrols”, which might introduce some bias. However, if such bias actually existed, it would further reinforce the conslusion that bone tissue is normal in DS. The moderate sample size also limited the precission of estimates, particularly among older individuals. This resulted in wide reference ranges in the aBMD charts in those with advanced age.
In conclusion, in this cohort of pateints with DS with healtly lifestyles, areal BMD was low, in association with their smaller skeletal size. However, volumetric BMD and other indices of bone microarchitecture, such as TBS and calcaneal ultarsound, were normal. These results emphasize that in the presence of adequate environmental factors, individuals with DS are able to develop their whole potential and attain a small but normal skeleton.
REFERENCES
1 Jones K.L. Smith's recognizable patterns of human malformation, 6th ed, Elsevier Saunders, Philadelphia
2006.
2 Sherman S.L., Allen E.G., Bean L.H., Freeman S.B. Epidemiology of Down syndrome. Ment Retard Dev
Disabil Res Rev. 2007; 13: 221-7.
3 Wiseman F.K., Alford K.A., Tybulewicz V.L., Fisher E.M. Down syndrome recent progress and future
prospects. Hum Mol Genet. 2009; 18: 75-83.
4 Matute-Llorente, Á., González-Agüero, A., Gómez-Cabello, A., Vicente-Rodríguez, G., Casajús, J.
Decreased levels of physical activity in adolescents with Down syndrome are related with low bone mineral density: a cross-sectional study. BMC Endocrine Disorders 2013; 4: 13-22.
5 Real de Asua D., Quero M., Moldenhauer F., Suarez C. Clinical profile and main comorbidities of Spanish
adults with Down syndrome. Eur J Intern Med. 2015; 26: 385-91.
6 Hawli Y, Nasrallah M, El-Hajj Fuleihan G. Endocrine and musculoskeletal abnormalities in patients with
Down syndrome. Nat Rev Endocrinol. 2009; 5: 327-34.
7 Angelopoulou, N., Souftas, V., Sakadamis, A., Mandroukas, K. Bone mineral density in adults with
Down's syndrome. European Radiology. 1999; 9: 648-51
8 Angelopoulou N, Matziari C, Tsimaras V, Sakadamis A, Souftas V, Mandroukas K. Bone mineral density
and muscle strength in young men with mental retardation (with and without Down syndrome). Calcif Tissue Int. 2000; 66: 176-80.
9 Guijarro M, Valero C, Paule B, Gonzalez-Macias J, Riancho J.A. Bone mass in young adults with Down
syndrome. J Intellect Disabil Res. 2008; 52: 182-9.
10 Baptista, F., Varela, A., Sardinha, L. Bone mineral mass in males and females with and without Down
syndrome. Osteoporosis Int. 2005; 16: 380-8.
11 Sakadamis A, Angelopoulou N, Matziari C, Papameletiou V, Souftas V. Bone mass, gonadal function
and biochemical assessment in young men with trisomy 21. Eur J Obstet Gynecol Reprod Biol. 2002; 100: 208-12.
12 www.ipaq.ki.se
13 Sabaté J. Estimación de la ingesta dietética:métodos y desafíos. Med Clin (Barc). 1993; 100: 591-6.
14 Wahner HW, Looker A, Dunn WL, Walters LC, Hauser MF, Novak C. Quality control of bone
densitometry in a national health survey (NHANES III) using three mobile examination centers. J Bone Miner Res.1994;9:951-60.
15 Katzman D.K., Bachrach L.K., Carter D.R., Marcus R. Clinical and anthropometric correlates of bone
mineral acquisition in healthy adolescent girls. J Clin Endocrinol Metab. 1991; 73: 1332-9
16 Lu P.W., Cowell C.T., LLoyd-Jones S.A., Briody J.N., Howman-Giles R. Volumetric bone mineral
density in normal subjects, aged 5-27 years. J Clin Endocrinol Metab. 1996; 81: 1586-90.
17 González-Agüero, A., Vicente-Rodríguez, G., Moreno, L., Casajús, J. Bone mass in male and female
children and adolescents with Down syndrome. Osteoporosis Int. 2011; 22: 2151-57.
18 Whitt-Glover M.C., O'Neill K.L., Stettler N. Physical activity patterns in children with and without Down
syndrome. Pediatr Rehabil. 2006; 9: 158-64.
19 Izquierdo-Gomez R, Martínez-Gómez D, Acha A, Veiga O.L., Villagra A, Diaz-Cueto M. Objective
assessment of sedentary time and physical activity throughout the week in adolescents with Down syndrome. The UP&DOWN study. Res Dev Disabil.2014; 35: 482-9.
20 Matute-Llorente, Á., González-Agüero, A., Gómez-Cabello, A., Vicente-Rodríguez, G., Casajús, J.
Decreased levels of physical activity in adolescents with Down syndrome are related with low bone mineral density: a cross-sectional study. BMC Endocrine Disorders 2013; 4: 13-22.
21 Soler Marín A, Xandri Graupera J.M. Nutritional status of intellectual disabled persons with Down
syndrome. Nutr Hosp. 2011; 26: 1059-66.
22 Luke A, Sutton M, Schoeller D.A, Roizen N.J.J. Nutrient intake and obesity in prepubescent children
with Down syndrome. Am Diet Assoc. 1996; 96: 1262-7.
23 Del Arco C, Riancho J.A., Luzuriaga C, González-Macías J, Flórez J. Vitamin D status in children with
Down's syndrome. J Intellect Disabil Res. 1992; 36: 251-7.
24 Stagi S, Lapi E, Romano S, Bargiacchi S, Brambilla A, Giglio S, Seminara S, de Martino M. Determinants
of vitamin d levels in children and adolescents with down syndrome. Int J Endocrinol. 2015; vol 2015: ID 896758.
25 McKelvey, K., Fowler, T., Akel, N., Kelsay, J., Gaddy, D., Wenger, G. Low bone turnover and low bone