FOREIGN DIRECT INVESTMENT
IN CATALONIA AND BARCELONA
Executive Summary Methodology and Objectives FDI Global Trends
Key Findings and Conclusions
Challenges and Opportunities for Catalonia and Barcelona Methodology
Quantitative methodology Qualitative methodology
Evolution of FDI – Quantitative Analysis FDI Global Trends
FDI in the world
FDI in the European Union FDI in Catalonia
General trends of FDI in Catalonia regarding Spain Foreign companies in Catalonia
Analysis of FDI Projects in Catalonia and Barcelona Source of origin
Destination by economic sector Destination by business activity
Cross-analysis of FDI Projects in Barcelona Economic sectors by country of origin Business activities by country of origin Business activities by economic sector
Perception of Catalonia and Barcelona – Qualitative Analysis Why do international companies decide to invest abroad?
How do international companies decide where to invest?
What is international companies’ perception of Catalonia and Barcelona as business locations?
Which are the most positively perceived factors?
Which are Barcelona & Catalonia’s less positively perceived factors? Perception of Potential Investors
Likeliness to Invest Conclusions Appendix Table of Figures Acknowledgments 1. 1.1 1.2 1.3 1.4 2. 2.1.1 2.1.2 3. 3.1 3.1.1 3.1.2 3.2 3.2.1 3.2.2 3.3 3.3.1 3.3.2 3.3.3 3.4 3.4.1 3.4.2 3.4.3 4. 4.1 4.2 4.3 4.3.1 4.3.2 4.4 4.5 5. 6. 6.1 6.2 5 5 5 5 7 9 9 9 11 11 11 13 15 15 18 19 20 21 26 29 29 31 32 34 34 35 37 40 41 42 44 45 48 48 50
6.6 6.7 6.8 6.8.1 6.8.2 6.9 6.9.1 6.9.2 Methodological notes
Equivalences of Factors and Elements of Attraction Survey data
Survey
Survey respondents Annex: Additional data
Sectors in Catalonia (2003-2009)
Business activities in Catalonia (2003-2009)
52 53 54 54 59 59 60 60
1. Executive Summary
1.1
Methodology and Objectives
The objectives of this study are to analyse the recent evolution of Foreign Direct Investment (FDI) in Catalonia and Barcelona1 and to understand
the perception that foreign companies have of Catalonia and Barcelona as investment locations. In order to prepare this study, both quantitative and qualitative techniques were used. For the quantitative analysis, several investment statistical sources and databases were examined, mainly UNCTAD, managed by the UN; Datainvex, by the Spanish Ministry of Economy; and fDi Markets, by the Financial Times. As for the qualitative analysis, different techniques were used: creation and gath-ering of a panel of 11 experts in foreign investment, followed by 18 in-depth interviews2 and a survey
on 149 executives from foreign companies. The most innovative aspect of this study is the fact that the perceptions of companies that have never invested in the region could be analysed through the in-depth interviews and the survey.
1.2
FDI Global Trends
In open, innovative, and inter-connected territories, FDI plays a key role as an enabler of economic growth and innovation transfer. The fact that almost 14 million jobs were created around the world through FDI Projects3 during the
2010-2016 period shows that investment can also become a driver for job creation and talent attraction. In this sense, FDI is more important than ever before and regions are in an intense competition to attract invest-ment flows and projects to their territories. Catalonia and Barcelona need to keep making efforts to maintain the territory as a preeminent investment destination. The study shows that companies mostly invest abroad to access new markets, since 65% of all respondents chose this option. The second and
third reasons to invest abroad fall far behind access to new markets, but show two specific trends: com-panies investing abroad to innovate in processes or products/services and proximity to products or services demanded by their local markets. It is also important to understand the factors that companies analyse when deciding on an investment location. According to this study, the most impor-tant factor for executives when deciding where to invest is the market: its size, level of openness and its growth potential. Institutional factors and costs hold second and third positions respectively. In that sense, costs stands out as a fairly important issue to respondents. However, established companies in Catalonia not only fail to invest in the region because of its costs but because of other more value-added elements. Besides the top three influ-encing factors when deciding on a location in which to invest, an additional reason seems very relevant for most companies interviewed: human capital. In fact, certain executives pointed out the increasing rele-vance of talent availability as a key investment factor.
1.3
Key Findings and Conclusions
Catalonia and Barcelona are leading European regions when it comes to attraction of foreign direct investment, reaching the highest level of FDI inflows during the analysed period. FDI inflows hit a record high for two consecutive years, with €4,936 million in 2015, and €5,052 million in 2016. Additionally, Catalonia was the first destination for FDI Projects in Spain, accounting for 35% of all
1 According to fDi Markets, references to “Barcelona” or
“Barcelona Area” refers to its administrative region, equivalent to the third level of the Nomenclature of territorial units for statistics (NUTS 3) of the European Union. In the case of Catalonia, it refers to the province of Barcelona
2 The interviews, survey and sessions with the expert panel were
conducted between February and April 2017
projects attracted between 2010 and 2016. These projects helped to reduce unemployment by creat-ing over 50,000 jobs and boosted Catalonia’s econ-omy by generating $20 billion of capital investment. Catalonia and Barcelona consolidated their attractiveness to the largest economies in the world as well as to emerging countries in foreign investment. The Top 5 investor countries in Catalonia and Barcelona consist of three European countries (Germany, France and the UK) and the US and Japan. Additionally, 15.9% of all projects were from Asian companies, which are the
fastest-growing contributors to the world’s FDI. Catalonia was the main Spanish destination (with a 40% share) for FDI Projects coming from China, Japan and India.
Barcelona is a top-five European city in terms of foreign investment attractiveness. After London and Paris, Barcelona had a leading position alongside Dusseldorf and Dublin during the analysed period (2010-2016). 8.6% of all FDI Projects in the EU-28 were in London, 4.2% in Ile-de-France (Paris region), 2.4% in Dusseldorf, 2.3% in Dublin, and 2.2% in Barcelona.
Overall, investors perceive Catalonia and Barcelona as a very attractive place to invest. The region is rated globally at 3.7, on a scale of 1 to 5, with 5 being “very attractive to invest”. Asian companies are those that best rated the region, with 3.73 points, followed by European and American companies, with 3.70 and 3.65 points respectively.
In terms of the location of survey respondents, Asian and European companies have the best perception of Catalonia and Barcelona followed by the American ones, although the difference between the grading is not significant. Asian companies’ good perception is especially relevant, since the Asian market is an important FDI contributor. The number of projects coming from Asian companies has been increasing steadily since 2010, representing 23% of all FDI Projects in 2016. The importance of investors’ perception of a region was also stressed. Since Catalonia and Barcelona are competing as advanced regions within Europe, there are no major differences in key factors such
as costs or macro-economic or institutional factors. Therefore, the decision to invest is greatly influenced by other factors such as the attractiveness of being an important hub or cluster for a sector, or to be perceived as an innovative destination for certain economic sectors and value chain activities.
Highly innovative sectors find Catalonia and Barcelona a very attractive location for their investments. From a comparative point of view, established companies give greater importance to innovation as a factor of decision when deciding to invest abroad. The reason for this is that Catalonia and Barcelona are more attractive to innovative companies. In fact, Barcelona had a leading position within the EU in terms of FDI Projects in Design and Development and Testing and R&D.
Catalonia is set to become a strategic industri-al pole in the process of reindustriindustri-alisation of advanced economies. In fact, the Industry sectors led FDI attraction in Catalonia during the period 2010-2016, representing 33.4% of the total flows with a €9,098 million investment. Among the most relevant industrial sectors, the Food Products and Bever-ages, Pharmaceutical Products, Vehicles and Chemical sectors stood out.
Companies that internationalise their manufacturing activities are those that have a better perception of Catalonia and Barcelona. This means that the region is well-positioned in terms of attracting projects with a positive impact in terms of long-term investments and job creation.
Barcelona leads the attraction of sectors and activities with a high impact in terms of jobs and long-term investments. When comparing Barcelona’s five most important sectors in terms of FDI Projects received, it had a leading position (fifth or above in the ranking) in the Life Sciences and Transportation sectors, as the second and the fourth EU region with the most FDI Projects received between 2010 and 2016 respectively.
Barcelona tops the attraction tables in several sec-tors in Europe even though these secsec-tors are not the most important in the region. Barcelona led the EU ranking in terms of FDI Projects received for the Warehousing & Storage sector. Likewise, Barcelona
ranked second for the Computer and Office Equip-ment and Textiles sectors. The other two sectors where Barcelona was within the Top 5 EU regions were the Chemicals and Automotive Components sectors.
In addition to the analysis of sectors, it is also relevant to analyse which activities companies’ investments are destined for in the region. In this sense, when analysing the most important business activities in Barcelona by economic sector, it is notable that Life Sciences, Chemicals and Automotive Components mostly attracted investment for Manufacturing activities.
Catalonia and Barcelona’s talent and education ecosystem is a strategic element for reinforcing the region’s position in the global competition for talent. Catalonia and Barcelona are capable of providing international companies with the talent they seek by offering education and training programmes built around their needs. Currently, the fourth best-perceived factor in the region is the quality of its education system. Human capital offered by the region is perceived very highly by international companies.
Catalonia and Barcelona are key regional players for the Southern European and Mediterranean market. The strong infrastructures network, together with its geo-economic location can be used by established companies to reach out to potential European and Mediterranean Basin markets, as well as to establish corporate services near to their target markets. In addition to established companies, half of the companies that are considering investing in Southern Europe have considered investing in Catalonia or Barcelona.
1.4
Challenges and Opportunities for
Catalonia and Barcelona
Catalonia and Barcelona have become a great loca-tion to invest. Nevertheless, there are some aspects in which the region can still improve its positioning. Non-established companies perceive Catalonia and Barcelona as a region with leading scientific facilities, an innovative ecosystem, a significant start-up presence, local talent availability and international talent attraction capacity, head-to-business mind-set and a great quality of life, and their average rating for the region is 4 points out of 5. Therefore, Catalonia and Barcelona have great potential to attract new investments. The challenge is to attract investors that perceive the region as a pole of attraction for Southern Europe in which to establish their future projects.
Sectors such as Life Sciences, Transportation or Chemicals had a leading position in investment attraction in the region in the period 2010-2016. Nevertheless, Catalonia and Barcelona could still improve their regional positioning within the European Union in the attraction of sectors such as Software and ICT, Business Services, and Financial Services. Even though these sectors have a significant number of projects, the region is far behind London, the lead-ing region, followed by Paris and Dublin.
Strategic sectors find top-class locations for their decision-making centres in Catalonia and Barcelona. Sectors such as Life Sciences, Business Services and Textiles are investing in the region for Headquarters activities. The region could improve its attractiveness for Headquarters activities in other sectors in which it has a leading position, for exam-ple in Chemicals or Automotive Components, where decision-making centres are not found in any of the investor companies’ major activities.
Innovation, business performance and net-working are key elements for attracting foreign investment in advanced economies. Catalonia and Barcelona’s good positioning in these aspects should compensate the factors where Catalonia and Barcelona are less positively perceived, such as those related to taxation, and costs (rental costs and
energy costs). Although costs are the least positively perceived factors, international investors investing in Catalonia and Barcelona do not consider these factors very relevant. As such, Catalonia has to focus on fostering and consolidating itself as an innovation pole, since innovation is an important factor for companies not yet investing in the region.
The results of the study prove that Catalonia and Barcelona are among the most competitive regions in Europe in terms of FDI attraction. Nevertheless, the study also proves that Catalonia and Barcelona can still increase FDI inflows and projects by fostering their strengths. It is a region capable of attracting industrial projects and highly innovative investments, of becoming a strategic destination for companies seeking international talent, and a great stronghold for reaching a bigger and growing market due to its proximity to European and Mediterranean Basin markets.
2. Methodology
The aim of the present study was two-fold: firstly, the objective was to analyse the trends and evolution of Foreign Direct Investment in Catalonia and Barcelona. Secondly, it was to be aware of the perception that foreign companies have of Catalonia and Barcelona as business locations in which to invest.
The first objective was approached by analysing quan-titative data, whereas qualitative analysis techniques were used to gather foreign companies’ perception. The sections below provide further information on the quantitative and qualitative methodologies.
Moreover, in order to fine-tune the methodology to be used, a panel of investment experts was created to validate the proposed methodological approach.
2.1.1
Quantitative methodology
The trends and evolution of FDI in Catalonia and Barcelona were analysed through quantitative data available in different databases.
The main sources of information for the quantitative analysis were: UNCTAD (United Nations), for world FDI Flows; DataInvex-Mineco (Spanish Ministry of Economy, Industry and Competitiveness), for
2.1.2
Qualitative methodology
The main purpose of the qualitative analysis was to identify the main factors that drive foreign investment decisions and analyse the level of attractiveness of Catalonia and Barcelona to foreign investors.
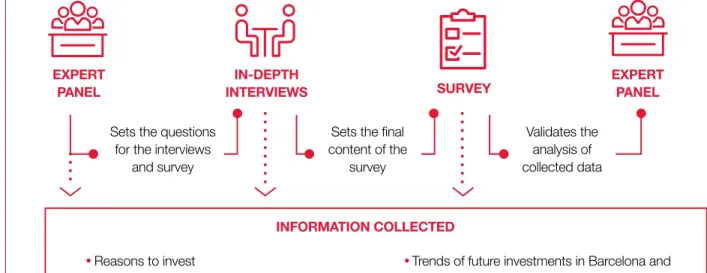
To develop the qualitative analysis, the following three techniques were used: an expert panel, in-depth interviews and an online survey. These three tech-niques were used in chronological order so each activity helped to prepare the following one, as is shown in Figure 1. The expert panel was gathered and consulted both at the beginning of this study, to Spanish and Catalan FDI Flows; and fDi Markets database, for FDI Projects in Europe, Spain, Catalonia and the administrative region of Barcelona. In this case, Barcelona refers to the province which is the second-level political and administrative division in Spain. Other sources used in the study can be found in section 6.3 Sources.
The figures and tables displayed in the quantitative analysis have been prepared using data from the abovementioned sources consulted throughout the months of March and April 2017.
Figur
e 1
-Methodology for the qualitative analysis
ExPErT PANEL
Sets the questions for the interviews
and survey
· Reasons to invest
· Perceptions about Catalonia and Barcelona
INFOrMATION COLLECTED Sets the final content of the survey Validates the analysis of collected data ExPErT PANEL SUrVEy IN-DEPTH INTErVIEWS
· Trends of future investments in Barcelona and Catalonia by multinational companies
validate its hypothesis, and at the end to validate the final analysis, conclusions and recommendations. The first session was set to validate the methodological approach, whereas the second gathering was sched-uled with the purpose of validating the preliminary results and recommendations.
Firstly, it was important to understand what compa-nies are taking into account when deciding on where to place their investments. This means analysing the key factors that can influence the decision to invest or not in any given destination. In order to discuss these factors, a first session with a panel of experts took place at the beginning of the study. Each expert was given a predefined list of possible relevant factors that may influence the decision of where to invest. The experts analysed the predefined factors and proposed others that could be of relevance. Moreover, they dis-cussed how these factors may affect the companies’ investment decisions.
Based on the factors that were validated during the session, the panel evaluated the strong and weak points of Catalonia and Barcelona in terms of attract-ing foreign investment. Overall, this first session with the expert panel allowed the guidelines and questions for the in-depth interviews to be established, putting focus on the crucial aspects identified by the experts. As a second research technique, a total of 18 in-depth interviews with executives with invest-ment decision-making power were conducted.4
The interviews allowed crucial information to be retrieved about the perceptions of established and non-established companies in Catalonia and Barcelona. Additionally, the interviewers helped to narrow down the investment decision factors that had been previously discussed in the expert panel session.
Following the interviews, an online survey was sent to companies to fully understand how Catalonia and Barcelona are perceived by foreign companies. The survey was completed by 149 respondents, 46 of which were executives from companies that are already investing in Catalonia and Barcelona, whereas 103 respondents were from companies not established in Catalonia. This is the first time since the
first edition of the study that the perception of compa-nies not established in Catalonia has been included, enriching the results obtained.
Finally, a second session with the expert panel was held to validate the results. Again, this is the first edition of this study in which an expert panel is used, both at the beginning and at the end of this study, to validate the research and the results obtained, as well as to jointly define recommendations in a collective intelligence basis.
3. Evolution of FDI
– Quantitative Analysis
3.1
FDI Global Trends
53.1.1
FDI in the world
This section provides an overview of the latest world trends on Foreign Direct Investment. Global FDI Flows are published in the World Investment Report by the United Nations Conference on Trade and
Develop-Figur
e 2
-Global FDI Flows (in billion dollars) and growth (in %), 2010-2015
ment (UNCTAD). At the time of writing this study, the latest data available from UNCTAD on global invest-ment flows was from 2015, thus the period analysed in this section ranges from 2010 to 2015. However, in the following sections, other databases were consult-ed where information from 2016 was available. In terms of Global Foreign Direct Investment (FDI) flows, 2015 was a significant year where pre-crisis levels were reached, totalling $1,762 billion6 of
invest-ment flows around the world. In addition, the level
of investment increased up to 38% with respect to 2014. As is shown in Figure 2, 2015 was a turning point, reversing the downward spiral trend that had followed the period 2010-2014. This growth was mainly driven by cross-border mergers and acquisi-tions (M&As).
Nevertheless, according to the World Investment Report 2016, Global FDI Flows are expected to de-cline by 10%-15% in 2016. The forecast for 2017 is more optimistic as FDI Flows are expected to resume growth at 5%-10%.
Global economic activity, measured by the Gross Domestic Product (GDP), has been growing at a steady level since 2011 and grew at 2.5% in 2015.
UNCTAD’s forecasts expect Global GDP to grow at a similar level in 2016 with a slight upsurge in 2017, reaching a 2.8% growth rate. Despite the positive out-look for the upcoming years, the rate at which Global GDP is expected to grow is relatively low. This predic-tion may have an impact on future Global FDI Flows. When analysing the evolution of Global FDI Flows as a percentage of Global GDP, Figure 3 shows
5 This section has been prepared with data from the World
In-vestment Report 2016, published by the United Nations Conferen-ce on Trade and Development (UNCTAD) on June 2016
6 One billion (bn.) refers to the American and British scale
(1,000,000,000) (see Methodological note 1 in section 6.6 for more information)
$1,389 bn. Global FDI Flows
2010 0 2011 2012 2013 2014 2015 2016 40% 1,800 800 1,400 400 -15 % 0 % 10 % 15 % 5 % -5 % -10 % 20% 30 % 35 % 25 % Gr owth $1,567 bn. $1,511 bn. $1,427 bn. $1,277 bn. $1,762 bn. $1,542 bn. 18% 13% -4% -6% -11% 38% -13% 2016 forecast Source: UNCTAD
how, in 2015, FDI as a percentage of GDP resumed growth after a three-year decline and reached 2.5% of Global GDP, the highest figure from the previous six years. The peak in 2015, is the result of a relatively low Global GDP growth (2.5%) combined with a significant increase in Global FDI Flows.
Foreign Direct Investment can be of a different na-ture. The most common types of investment are the so-called greenfield (creation of new companies or business activities) and cross-border mergers and acquisitions (M&A). A greenfield investment represents
Figur
e 3
-Global FDI Flows as % of -Global GDP
,
2010-2015
the creation of a new company or business activity in a foreign territory, with the following impact on economic activity and job creation where the invest-ment is received. On the other hand, M&A refers to a merger or the acquisition of a company by a foreign entity, without necessarily having a positive impact on jobs and economic activity at the investment’s destination country. In this respect, Figure 4 compares the volumes of these two types of investment for the period 2010-2015.
In 2010, greenfield investments accounted for 70% of total FDI Flows. Nevertheless, in 2015 their share was matched by that of M&A investments, representing 49% of total FDI Flows. On the contrary, the volume of M&A investments between 2010 and 2015 doubled from $347 to $721 billion. This sharp increase was led by the Manufacturing Sector, which saw its share in total M&A grow from 37% to 54% during this six-year period. FDI / GDP 2010 0.0 % 2011 2012 2013 2014 2015 2016 2.5 % 1.0 % 1.5 % 2.0 % 0.5 % 2.2 % 2.3 % 2.2 % 2.1 % 1.7 % 2.5 % 2.0 % 2016 forecast Source: UNCTAD Figur e 4
-Distribution of Global FDI Flows fr
om
gr
eenfield and mergers & acquisitions
investments (in %) and their volume (in billion dollars), 2010-2015 0 % 2010 2011 2012 2013 2014 2015 100 % 40 % 30 % 60 % 50 % 80 % 70 % 90 % 20 % 10 % $ 347 bn. 30 % $ 554 bn. 39 % $ 328 bn. 34 % $ 262 bn. 24 % $ 433 bn. 38 % $ 721 bn. 49 % $1,166 bn. $1,419 bn. $ 959 bn. $1,093 bn. $1,139 bn. $1,487 bn. $ 819 bn. 70 % $ 865 bn. 61 % $ 631 bn. 66 % $ 831 bn. 76 % $ 706 bn. 62 % $ 766 bn. 51 % Source: UNCTAD Greenfield M&A
3.1.2
FDI in the European Union
When looking at the Foreign Direct Investment flows in the European Union, Figure 5 shows the evolution of incoming volumes into the EU for the 2010-2015 period.
Figur
e 5
-EU-28 and Global FDI Flows in billion dollars (up) and gr
owth in % (down), 2010-2015
Figur
e 6
-EU-28 and world FDI Flows’ gr
owth in %, 2010-2015 -30 % -10% 2011 13 % -4 % 38 % 50 % 5 % -28 % -11 % 2010 2012 2013 2014 2015 0 % 10 % 20 % 30 % 40 % 50 % 60 % -20 % World EU28 2010 0 2011 EU28 World 2012 2013 2014 2015 400 600 800 1,000 1,200 1,400 1,600 1,800 200 $ 385 $ 426 $ 446 $ 319 $ 292 $ 439 $ 1,389 $ 1,567 $ 1,511 $ 1,762 $ 1,427 $ 1,277 $bn Source: Own elaboration from UNCTAD Source: Own elaboration from UNCTAD
M&A foreign investments were the main contributors to the growth of Global FDI Flows in 2015. Accord-ing to the World Investment Report 2016, foreign investment in M&A is expected to slow down in 2016, leading to a decline in the total volume of M&A. On the other hand, the volume of greenfield investments increased by $60 billion in 2015, an 8.5% growth compared to the previous year.
FDI Flows into the European Union in 2015 totalled $439 billion, representing a 50% increase in
comparison with the volumes in 2014, reversing the negative trend experienced since 2012. In 2015, the EU’s inward FDI growth rate was higher than that of the world during the same year. However, during the
overall 2010-2015 period, the EU’s FDI inward flows grew at a compound annual growth rate of 2%, which was half the global growth rate for the same period.
Figur
e 8
-Top 10 FDI destinations in the EU (in billion dollars), 2010-2015
United Kingdom $ 295 bn. $ 288 bn. $ 243 bn. $ 214 bn. $ 206 bn. $ 164 bn. $ 163 bn. $ 159 bn. $ 111 bn. $ 82 bn. $ 75 bn. Ireland Luxemburg Netherlands Germany Belgium France Spain Italy EU-average Malta Figur e 7
-EU-28 FDI Flows as % of global FDI Flows, 2010-2015 0 % 2010 2011 2012 2013 2014 2015 25 % 30 % 10 % 15 % 20 % 5 % 28 % 27 % 30 % 22 % 23 % 25 %
As represented above in Figure 7, FDI Flows into the European Union as a percentage of Global FDI Flows increased in 2015, continuing the positive trend that started in 2013 and reaching up to 25% of Global GDP. Nevertheless, this percentage is still lower than those existing before 2012, where FDI Flows into the EU represented around 30% of Global FDI Flows. In addition, the EU generated 28% of Global GDP between 2010 and 2015.
The top 10 destinations of FDI Flows in the EU between 2010 and 2015 are presented in Figure 8. The top five, which includes the UK, Ireland, Luxem-bourg, the Netherlands and Germany accounted for 54% of the total FDI received in the EU. Spain held
the eighth position with 7% of the total EU’s inward FDI. In this respect, it is significant that the country with the highest share of FDI in the EU, the UK, is expected to withdraw its membership from the European Union in the coming years (i.e. “Brexit”). It is also relevant to note that countries like Ireland, Luxembourg or the Netherlands are often selected by non-European companies as investment plat-forms to access the European market due to the existing tax incentives offered to foreign investors. Therefore, these countries are usually ranked as top FDI Flows destination countries, although the final investment (together with its impact on job creation and economic activity) may take place in another European country. Source: Own elaboration from UNCTAD Source: Own elaboration from UNCTAD
3.2
FDI in Catalonia
3.2.1
General trends of FDI in
Catalonia regarding Spain
The current section7 focuses its analysis on
productive FDI Flows into Catalonia and its com-parison with the rest of Spain. Productive FDI Flows do not take into account Foreign-Securities Holding Companies (ETVEs)8 . According to Spanish
legisla-tion, these entities have a special tax treatment for dividends and capital gains transferred to the ETVEs
Figur
e 9
-Pr
oductive FDI Flows in Catalonia
(in million eur
os), 2010-2016
from their shareholding in non-resident companies. As a result, these cross-border capital movements do not necessarily generate any activity in the country where the ETVE is located. When looking at the evolution of productive FDI Flows in Catalonia between 2010 and 2016, Figure 9 below does not show any clear growth pattern.
During this seven year period, productive FDI Flows into Catalonia reached three all-time highs since data was first recorded back in 1993. These three peak levels of FDI Flows were reached in 2010, 2015 and 2016 respectively. After four years of ups and downs, 2015 reached an all-time high, growing 62% compared to 2014. In 2016, this trend was consolidated, growing at 2.4% and reaching another
all-time high with €5,052 million received. Overall, the three best years in the series (2010, 2015 and 2016) were driven by sectors such as the Food Industry, Real Estate and Warehousing and support activities for Transportation9.
7 This section has been prepared with investment flows data
extracted from the DATAINVEX database of the Spanish Ministry of Economy, Industry and Competitiveness. Available at http://da-tainvex.comercio.es/
8 In Spain, Foreign-Securities Holding Companies are known as
“Entidades de tenencia de valores extranjeros” (ETVE)
9 Sectors defined by the Spanish Ministry of Economy, Industry
and Competitiveness 2010 0 2011 2012 2013 2014 2015 2016 5,000 6,000 2,000 3,000 4,000 1,000 € 4,857 €M € 3,058 € 2,676 € 3,575 € 3,046 € 4,936 € 5,052 Source: DATAINVEx
Figure 10 below shows the volumes and the
distri-bution of the FDI received in Catalonia and Spain during the period 2010-2016, differentiating between productive and non-productive investment.
FDI flows into Catalonia
reached
all-time highs in
2015 and 2016, consolidating
Figur
e 10
-Distribution of FDI (ETVE – NO ETVE) in Catalonia and Spain (in %) and their volume (in million eur
os), 2010-2016 Catalonia Spain Figur e 11 -Catalonia’ s pr oductive FDI
as % of the total in Spain, 2010-2016
2010 2010 0 % 0 % 2011 2011 2012 2012 2013 2013 2014 2014 2015 2015 2016 2016 100 % 100 % 40 % 40 % 30 % 30 % 60 % 60 % 50 % 50 % 80 % 80 % 70 % 70 % 90 % 90 % 20 % 20 % 10 % 10 % €5,409 M €24,334 M €3,656 M €35,120 M € 3,174 M € 20,092 M € 3,924 M € 23,926 M € 3,371 M € 21,167 M € 5,066 M € 25,342 M €5,082 M €33,956 M 90 % 51 % 84 % 82 % 84 % 73 % 91 % 72 % 90 % 96 % 97 % 94 % 99 % 72 % 10 % 49 % 16 % 18 % 16 % 27 % 9 % 28 % 28 % 10 % 4 % 3 % 6 % Source: Own elaboration from DATAINVEx Source: Own elaboration from DATAINVEx NO ETVE (productive) ETVE (non-productive)
The strong growth of FDI in Spain during 2016, totalling €34 billion with a 34% increase compared to 2015, was mainly due to productive foreign invest-ment. The performance of this type of foreign direct investment in Spain was in line with that of Catalonia, growing 2% compared to 2015. When comparing the evolution of productive foreign investment in Spain and Catalonia, the results differ. Catalonia’s foreign invest was driven mainly by productive investment between 2010 and 2016, seeing its
non-productive foreign investment decline over the past three years from 10% to 1%. Spain on the other hand, between 2014 and 2016, saw its share of productive foreign investment fall from 96% to 72%. Nevertheless, when considering the period 2010-2016, productive foreign investment increased 21 percentage points.
In the following sections of this study only productive foreign investment is taken into account.
2010 0 % 2011 2012 2013 2014 2015 2016 10 % 15 % 20 % 25 % 30 % 35 % 40 % 5 % 39 % 11 % 18 % 21 % 15 % 21 % 21 %
In 2016, Catalonia’s productive FDI represented 21% of all productive investment into Spain. This percentage was the same as in 2015, consolidating its weight with respect to Spain. 2010 was an extraordinary year, with Catalonia representing 39% of the Spanish inward FDI. During that year, productive FDI represented only 51% of all FDI in Spain, compared to Catalonia where it represented 90%. During the period analysed, Catalonia’s share of inward productive investment in Spain was, on average, around 21%.
With regard to the sectors where FDI Flows were allocated, Figure 12 shows the distribution of FDI Flows in Catalonia by group of sectors in 2016.
The Industry sectors led the FDI attraction in
Catalonia, representing 33.4% of the total flows. The most relevant industrial sectors were Food Products and Beverages (€2,944 million), Energy, Water Supply and Waste Management (€1,656 million), Pharmaceutical Products (€1,024 million), Vehicles (€615 million) and Chemical (€511 million) sectors. The next group of sectors in the ranking of FDI Flows in Catalonia in 2016 were Construction, Wholesale & Retail Trade, and Transportation & Storage with a share of 13.1%, 12.4% and 8.7% of the total respectively.
FDI flows in Catalonia were
led by
industry sectors
Figur
e 12
-FDI Flows in Catalonia by gr
oup of sectors
(in million eur
os), 2010-2016
Source:
Catalonia Trade & Investment (ACCIÓ) based on Datainvex-Mineco 0
Catalonia Industry Construction Wholesale &retail trade Transportation& storage Other
4.000 2.000 6.000 8.000 10.000 12.000 14.000 16.000 18.000 20.000 22.000 24.000 26.000 28.000 € 27.200 €M € 9.098 € 3.562 € 3.383 € 2.359 € 8.799
3.2.2
Foreign companies in Catalonia
In 2016, there were 7,086 foreign companies established in Catalonia. In that year, there was a high concentration of foreign companies in
Catalonia from only five countries. As show in Figure 13, companies from Germany, France, the Unit-ed States, Italy and the Netherlands representUnit-ed over 50% of all foreign companies established in
Figur
e 13
-For
eign companies established
in Catalonia, 2016 Germany 977 13.8% France 899 12.7% United States 814 11.5% Italy 649 9.2% Netherlands 597 8.4% United Kingdom 528 7.5% Luxembourg 460 6.5% Switzerland 344 4.9% Japan 197 2.8% Belgium 169 2.4% Portugal 143 2.0% Denmark 141 2.0% Sweden 99 1.4% Austria 79 1.1% Ireland 74 1.0% OTHEr COUNTrIES 916 12.9% TOTAL 7,086 100% Country of origin Foreign companies
established in Catalonia % of the total
Source: Catalonia Trade & Investment (ACCIÓ)
Catalonia. When expanding the ranking and look-ing at the top 10 countries, this concentration becomes more acute, representing about 80% of all companies established in Catalonia.
The United States (ranking third) and Japan (ranking ninth) were the only non-European countries within the Top 15 in Catalonia. As it will be shown in section 3.3.1, the top ten countries with the highest num-ber of foreign companies established in Catalonia
in 2016 also represented the main source of FDI Projects between 2010 and 2016.
As regards the distribution of foreign companies in Catalonia, 92% of these entities are concentrat-ed in the province of Barcelona. The other 8% is distributed across the provinces of Tarragona, Girona and Lleida.10
10 The first level of political and administrative division of Spain
is made up of 17 Autonomous Communities and 2 autonomous cities. The second level of political and administrative division is made up of provinces. Catalonia itself is divided into four provinces: Barcelona, Tarragona, Girona and Lleida
3.2.2
3.3
Analysis of FDI Projects in
Catalonia and Barcelona
In this section11, the analysis of inward FDI in
Catalonia and in the administrative region12 of
Barcelona (hereinafter referred to as “Barcelona” or “Barcelona Area”), is based on the number of FDI Projects received rather than on the volumes of FDI Flows received. The main reason for using the project data is because FDI Flows are biased towards territories that are used as investment platforms. For instance, in the EU, Member States such as the Netherlands and Luxembourg, broadly used by non-European companies as investment platforms for cross-border capital movements in the EU, may appear overrepresented. In addition, when allocating Spain’s inward FDI Flows across the Spanish regions or Autonomous Communities, the
calculation is based on the location where the foreign company has its Spanish headquarters, disregarding where the actual operations and investment is taking place. As a result, FDI Flows are often assigned as belonging to the Community of Madrid, where most companies’ headquarters are located, even if the actual investment is taking place in another Community. Considering the above limitations of FDI Flows data, FDI Projects are to be used as the source data in this study to analyse, in detail, inward investment in Catalonia and Barcelona.
From a methodological perspective, the information on FDI Projects has been elaborated with data from the fDi Markets database. This source provides data on greenfield investments for a specific territory with detailed information on the origin of each project, its economic sector, to which business activity it refers, as well as its impact on the jobs and CapEx13
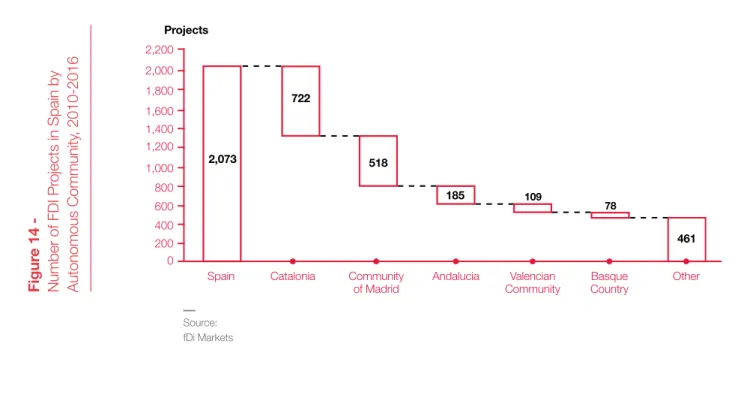
generated. Figur e 14 -Number of FDI Pr ojects in Spain by Autonomous Community , 2010-2016 Source: fDi Markets Catalonia Community
of Madrid Andalucia CommunityValencian BasqueCountry Other
Spain 0 200 400 600 800 1,000 1,200 1,400 1,600 1,800 2,000 2,200 2,073 Projects 722 518 185 109 78 461
11 This section has been prepared with data extracted from the
fDi Markets database
12 The fDi Markets criteria to define “administrative region” is
equivalent to the third level of the Nomenclature of territorial units for statistics (NUTS 3) of the European Union. The database defines the administrative region of Barcelona as the province of Barcelona
In this section all references to “Barcelona” or “Barcelona Area” will refer to its administrative region
13 CapEX or Capital investment makes reference to long-term
expenditures of a non-recurring nature, resulting in the acquisition of permanent assets
Figur
e 15
-Shar
e of FDI Pr
ojects in Catalonia by country of origin, 2010-2016
United States 19.8% 35.8% Germany 15.9% 42.6% France 13.3% 34.7% UK 9.1% 27.6% Japan 7.3% 47.8% Switzerland 5.5% 48.2% Netherlands 4.7% 29.3% Italy 3.2% 29.1% China 1.9% 43.8% Sweden 1.5% 28.2% Canada 1.4% 41.7% India 1.4% 45.5% Portugal 1.2% 23.7% Belgium 1.1% 36.4% Israel 1.1% 47.1% OTHEr COUNTrIES 11.6% -TOTAL 100%
-Country of origin % of total FDI Projects in
Catalonia
% of countries’ FDI Projects in Catalonia from total in Spain
Source:
Own elaboration from fDi Markets data
14 Source: IDESCAT (Statistical Institute of Catalonia)
Catalonia’s GDP between 2010 and 2016 represented about 20%14 of Spain’s GDP in the same period.
As for inward investment, Catalonia received 722 FDI Projects, almost 35% of the total in Spain for the same period, ranking as the top destination for these projects among all of Spain’s Autonomous Communities (AC). The second AC in the rank-ing was the Community of Madrid with 25% of all projects received. Overall, Catalonia and the Community of Madrid received about 60% of all FDI Projects in Spain between 2010 and 2016, representing a high concentration of all FDI received in Spain.
Catalonia is the first
destination for foreign
direct investment
projects in
Spain
3.3.1
Source of origin
Considering the overall number of 722 FDI Projects in Catalonia between 2010 and 2016, this section analyses these investments by their origin.
In Figure 15, the US appeared as the main
contribu-tor with 143 FDI Projects, representing about 20% of all FDI Projects during that period. Germany (16%), France (13%), the UK (9%) and Japan (7.3%) com-pleted the top five ranking of countries of origin for FDI Projects in Catalonia. These five countries captured around 65% of all FDI Projects, showing a significant concentration of investment from few countries. In this respect, the impact that the UK’s withdrawal from the European Union may have on FDI Projects in Catalonia in the following years remains unknown.
By looking at FDI Projects’ destination by economic sector in Catalonia, the Software & IT Services sector had a leading position between 2010 and 2016. FDI Projects in the Software & IT Services sector had a 16% share of all FDI Projects received in Catalonia during this period, and was 3.7 percentage points higher than the previous period (2003-2009)15.
Addi-tionally, the number of FDI Projects between the two periods rose from 65 to 119 (an increase of 83%). The area of Barcelona received 95% of all Software & IT Services FDI
Pro-jects in Catalonia. In line with the above, in 2016 the Barcelona Tech City, a Digital Busi-ness Cluster whose goal is to position Barcelona as a Dig-ital Hub, opened its new headquarters
3.3.2
Destination by economic sector
After analysing the origin of FDI Projects it is perti-nent to look at their destination by considering the economic sector where investments are made. This is to obtain information on which sectors are strategic for Catalonia and Barcelona in terms of attractive FDI Projects.
3.3.2.1
Sectors in Catalonia
Figur e 16 -Ranking of FDI Projects by economic sector
with destination in Catalonia, with jobs cr
eated
and CapEx ($M), 2010-2016
Software & IT Services
ranking of FDI Projects Jobs created CapEx ($M)
Business Services Life Sciences Transportation Financial Services Chemicals Consumer Products Textiles Other Total Industrial Machinery, Equipment & Tools
Source: fDi Markets 5,373 (2nd) 119 78 44 42 41 38 37 31 31 261 722 491 (13th) 4,949 (3rd) 822 (7th) 2,249 (8th) 791 (8th) 3,622 (4th) 1,927 (2nd) 1,329 (15th) 1,159 (5th) 991 (8th) 188 (20th) 1,692 (11th) 876 (6th) 2,818 (6th) 420 (15th) 1,907 (10th) 153 (21st) 25,643 13,107 50,573 19,934
15 Figures for this period can be found in the Annex of this study
Furthermore, Figure 15 also shows that over 40% of all FDI Projects in Spain originating in seven different countries was captured by Catalonia. These coun-tries, and their percentage of FDI Projects in Catalonia from the total number of projects in Spain are
Switzer-land (48%), Japan (48%), Israel (47%), India (45%), China (44%), Germany (44%) and Canada (42%).
The Software &
IT Services sector
attracted the most
FDI Projects in
Catalonia,
followed by
the Business Services,
Life Sciences and
Transportation sectors
The US was the
main contributor
of
FDI Projects in
Catalonia between
to initially host over 1,000 professionals and 80 companies. Additionally, since 2006, Barcelona has been hosting the Mobile World Congress (MWC), the world’s largest gathering for mobile industry with over 108,000 visitors in the 2017 edition. These examples may show the high positioning of Barcelona within this sector.
The Business Service, Life Sciences16 and
Transpor-tation sectors remained as the second, third and fourth most important sectors, increasing the number of FDI Projects received by 81%, 4.8% and 17% respectively from the period 2003-200917 . Similarly, the
Chemical sector kept its
place in seventh position, increasing the number of FDI Projects by 48%. In this respect, Tarragona has a very important Chemical Cluster (ChemMed Tarra-gona), which hosts over 100 chemical companies of different sizes.
The Consumer Products sector, eighth in the ranking, received 31 FDI Projects between 2010 and 2016, a 138% increase compared to the period 2003-2009. The Textile sector, historically strategic for Catalonia, gained importance between 2010 and 2016 with respect to the previous period (2003-2009), receiving 244% more FDI Projects. Although 50% of Textiles
FDI Projects were devoted to Sales & Marketing activities, it is relevant to highlight that 10 FDI Projects from this sector (30% of the total) were dedicated to Headquarters activities.
Figure 16 also indicates the jobs created and the
CapEx generated by the FDI Projects received in Catalonia. The 119 FDI Projects from the Software & IT Services sector created 5,373 jobs, surpassed only by the Real Estate sector with 7,809 jobs created (i.e. not listed in the table due to its lower number of FDI Projects received). When it comes to the CapEx generated by the FDI Projects received in Catalonia, the Transportation sector generated $1,927 million, the second highest figure, although far from the $4,984 million generated by the Automotive Original Equipment Manufacturer sector, which led the CapEx ranking in Catalonia (i.e. not listed also in the above table due to its lower absolute number of FDI Projects).
16 In this study, the Life Science sector is the result of combining
Biotechnology, Pharmaceuticals, Healthcare and Medical Devices sectors from the fDi Markets database
3.3.2.2
Sectors in Barcelona
The increasing urbanisation of the world population is providing cities and their influence areas a preemi-nent role in the global economy. For this reason, FDI promotion abroad is often performed through coun-tries’ leading cities and regions and their increasingly
Administrative
region FDI ProjectsNumber of Share in the EU
1. Greater London 2,521 8.6%
2. Ile-de-France 1,232 4.2%
3. Dusseldorf 693 2.4%
4. Dublin 679 2.3%
5. Barcelona 641 2.2% Source: Own elaboration
from fDi Markets data
17 Figures for this period can be seen in the Annex of this study
Figur
e 17
-Top 5 Administrative Regions in the EU-28 by number of FDI Pr
ojects, 2010-2016
Investment
projects in the
Software & IT
Services sector
had the
highest
impact on job
creation
powerful brands. In the case of Catalonia, Barcelona is known worldwide and is the main destination for FDI Projects. As a result, we have compared the Barcelona Area with other similar administrative regions in the European Union.
To illustrate the importance of Barcelona as an FDI destination in Catalonia, it is worth mentioning that it received 641 FDI Projects between 2010 and 2016, representing about
90% of all FDI Projects received in Catalonia during that period. On the other hand, as shown in Figure
17, Barcelona was the fifth EU administrative region with more FDI Projects received between 2010 and 2016. The third and fourth destinations, Dusseldorf and Dublin respectively, only received a few more FDI Projects than Barcelona, thus making them direct competitors in this ranking. Greater London and Ile-de-France (the region of Paris) stood out among all cities within the EU. The French region ranked second with 1,232 FDI Projects, whereas Greater London, first in the ranking by far, received 2,521 FDI Projects with an 8.6 share of the total FDI Projects received by the EU.
Software &
IT Services BusinessServices SciencesLife Transportation Financial Services
1. 1,002 (18.8%)London 483 (13.4%)London 50 (3.6%)Freiburg 54 (3.2%)London 358 (17.0%)London
2. 372 (7.0%)Paris 219 (6.1%)Paris Barcelona
44 (3.2%)
Paris
42 (2.5%) 84 (4.0%)Dublin
3. 278 (5.2%)Dublin 115 (3.2%)Dublin 41 (3.0%)Dublin Dusseldorf41 (2.4%) 78 (3.7%)Paris
4. Oberbayern171 (3.2%) 108 (3.0%)Uusimaa 40 (2.9%)Paris Barcelona
37 (2.2%)
Darmstadt 77 (3.7%)
5. 170 (3.2%)Berlin 104 (2.9%)Berlin 37 (2.7%)London 33 (2.0%)Madrid 69 (3.3%)Madrid
Barcelona (8th) 113 (2.1%) Barcelona (12th) 75 (2.1%) Barcelona (9th) 37 (1.8%) UE 5,337 3,602 1,374 1,683 2,107 Source:
Own elaboration from fDi Markets data
Figur
e 18
-Bar
celona’
s top 5 sectors in terms of FDI Pr
ojects,
and their r
elative position in the EU, 2010-2016
Following the comparison of Barcelona with other EU regions, when comparing Barcelona’s five most important sectors in terms of FDI Projects received, it had a leading position (fifth or above in the rank-ing) in the Life Sciences and Transportation sectors, as the second and the fourth EU region with the most FDI Projects received between 2010 and 2016
respectively. Figure 18 shows the ranking of Barcelona for these five sectors by number of FDI Projects. The Software & IT Services, Business Services, Transportation and Financial Services sectors concentrated their FDI Projects in the EU in the Greater London region. The other sector shown in
Barcelona was
the
fifth EU
destination of FDI
Projects between
Figure 18, Life Sciences, was led by Germany with a lower concentration compared to the previous sectors, representing 3.6% of all FDI Projects received in the EU for this sector.
Nevertheless, there are other sectors in Barcelona where a lower number of FDI Projects was received but, when compared to other EU regions, Barcelona has a leading position. For this reason, Figure 19 shows five sectors where Barcelona was in the top five positions within the EU between 2010 and 2016.
Barcelona led the EU ranking in terms of FDI Projects received for the Warehousing & Storage sector with 12 FDI Projects. Similarly, Barcelona ranked second for the Business Machines & Equipment18 and Textiles
sectors, receiving 16 and 29 FDI Projects respectively. The other two sectors where Barcelona was within the top five EU regions were the Chemicals (27 FDI Projects, third) and the Automotive Components sectors (20 FDI Projects, ranked fifth).
Figur
e 19
-5 other sectors wher
e Bar
celona has a
leading position in the EU in terms of FDI Projects, 2010-2016
18 The Business Machines & Equipment sector, included in the
top five sectors, includes Computer and Office Equipment
Automotive Components
Chemicals Business
Machines & Equipment
Textiles Warehousing & Storage
1. Lower Silesian32 (3.2%) Düsseldorf33 (4.4%) 18 (5.6%)London Düsseldorf35 (7.5%) Barcelona12 (6.0%)
2. 32 (3.2%)Silesian Antwerpen33 (4.4%) Barcelona16 (4.9%) Barcelona29 (6.3%) Antwerpen10 (5.0%)
3. West Midlands29 (2.9%) Barcelona27 (3.6%) 11 (3.4%)Dublin 24 (5.2%)Paris 6 (3.0%)London
4. 27 (2.7%)Stuttgart 20 (2.6%)Köln 10 (3.1%)Paris 23 (5.0%)London Uusimaa6 (3.0%)
5. Barcelona20 (2.0%) Zuid Holland17 (2.3%) Düsseldorf10 (3.1%) 22 (4.8%)Madrid Zuid Holland6 (3.0%)
UE 997 746 324 464 201
Source:
3.3.2.3
FDI Impact of sectors in
Barcelona
Figur
e 20
-Impact of FDI by sector in Bar
celona, 2010-2016
After comparing Barcelona’s sectors with other EU regions in terms of FDI Projects, Figure 20 analyses the impact of FDI in terms of average jobs created as well as the average CapEx generated per FDI Project. This exercise has been carried out for the top five sectors that are attracting more projects in Barcelona, as well as for the five sectors where Barcelona has a leading position in
terms of investment project attraction in the EU (that is, those previously analysed in
Figure 18 and
Fig-ure 19 respectively).
The following table includes information on these 10 selected sectors.
Overall, the average
for jobs creation per FDI Project provides information regarding the labour intensity of the 10 economic
sectors selected, whereas the CapEx figures indicate how capital-intensive these sectors are.
Both tables in Figure 20 show that the Warehousing & Storage and Transportation sectors had the biggest impact on both job creation and CapEx generated per FDI Project between 2010 and 2016. Regarding average jobs created, the Warehousing & Storage sector led the ranking by creating an average of 104 jobs in Barcelona per investment project, followed by the Transportation sector with an average of 92 jobs. On the other hand, and despite having a much lower impact on jobs created by project compared to the other sectors (average of 40 jobs), the Software & IT Services sector generated, in absolute terms, more jobs than any other sector shown in Figure 20 as a result of receiving the highest number of FDI Projects. As for the impact on capital expenditure, the Ware-housing & Storage sector led the ranking, doubling the amount generated by the second sector, Trans-portation. The other sectors in the ranking generated a relatively low amount of CapEx per project.
Sectors
Average jobs in Barcelona per
projects
1 Warehousing & Storage 104
2 Transportation 92 3 Business Machines & Equipment 82 4 ComponentsAutomotive 67 5 Business Services 64 6 Life Sciences 51 7 Textiles 45
8 Software & IT Services 40
9 Chemicals 38 10 Financial Services 33 Sectors Average CapEx in Barcelona ($M)
1 Warehousing & Storage 107
2 Transportation 48
3 Financial Services 28
4 Chemicals 25
5 Life Sciences 18
6 Business Machines & Equipment 17
7 ComponentsAutomotive 13 8 Business Services 11 9 Software & IT Services 4 10 Textiles 4 Source:
Own elaboration from fDi Markets data
Investment projects
in the
Warehousing
& Storage and the
Transportation
sectors had on
average the
biggest
impact on job
3.3.3
Destination by business activity
The previous analysis of FDI Projects in relation to their economic sector provides a better understand-ing of foreign investors’ needs. Nonetheless, FDI Projects are linked to a specific business activity. For this reason, this section analyses the destination of FDI Projects in Catalonia and Barcelona in terms of the companies’ value chain activities, to better under-stand which are of interest to foreign investors.
3.3.3.1
Business activities in Catalonia
Similarly to the previous analysis of FDI Projects by sectors in Catalonia (3.3.2.1), this section analyses business activities in terms of FDI Projects together with the jobs and CapEx associated with them.
Figure 21 shows the main business activities in
Catalonia sorted by number of FDI Projects for the period 2010-2016.
Figur
e 21
-Ranking of FDI Pr
ojects by business
activity in Catalonia with jobs cr
eated and
CapEx ($M), 2010-2016
As shown in Figure 21, the top five business activities that attracted the most FDI Projects in Catalonia for the period 2010-2016 were Sales and Marketing, Manufactur-ing, Business Services (i.e. back-office ac-tivities), Logistics Distribution & Transportation and Design, Development & Testing. In this respect, the first four activities are the same that
attracted the most projects between 2003 and 200919
but in a different order. Sales, Marketing & Support jumped from second to first position in the ranking, whereas the former leading business activity (Manu-facturing) saw a decrease in FDI Projects.
It is worth mentioning that among the business activities shown in Figure 21, there is one which considerably increased its percentage between the two analysed periods: FDI Projects on Design, Development & Testing activities increased by 268% from 19 to 70 between 2003-2009 and 2010-2016. Furthermore, FDI Projects for Headquarters activities increased by 27.1% in 2010-2016 compared to the previous seven-year period.
When looking at the jobs created and the CapEx generated for the business activities shown in Figure 21, Manufacturing and Logistics, Distribution & Trans-portation activities had the biggest impact in terms of jobs created and CapEx generated in absolute terms. Nevertheless, Design, Development & Testing activities consolidated as one of the main generators of employment, creating 6,180 jobs between 2010 and 2016.
Source: fDi Markets
ranking of FDI Projects Jobs created CapEx ($M)
4,549 (6th) 805 (6th) 8,908 (2nd) 7,653 (1st) 5,147 (5th) 1,664 (3rd) 9,551 (1st) 4,691 (2nd) 6,180 (4th) 1,285 (5th) 3,150 (7th) 587 (8th) 8,546 (3rd) 1,430 (4th) 1,226 (8th) 55 (15th) 3,316 1,764 50,573 19,934
Sales, Marketing & Support Manufacturing Business Services Logistics, Distribution & Transportation Design, Development & Testing
Construction Customer Contact Centre Other Total Headquarters 204 120 88 82 70 61 26 11 60 722
19 Figures for this period can be found in the Annex of this study
The
value chain activities
that attracted the most
investment in Catalonia
are:
Sales & Marketing,
Manufacturing,
Business Services,
Logistics and Design,
Development & Testing
3.3.3.2
Business activities in Barcelona
As with section 3.3.2.2, a comparison between Barcelona’s most relevant business activities in terms of FDI Projects has been performed by considering other regions in the EU. Therefore, Figure 22 shows the five main business activities in Barcelona between 2010 and 2016 in terms of FDI Projects together with the position of Barcelona in the ranking with other EU cities and regions.
In the business activities where Barcelona is not in a leading position (fifth or above in the EU ranking) there is a high concentration of FDI Projects in Greater London (Sales, Marketing & Support and Business Services). Nevertheless, in the activities where the concentration of FDI Projects is lower (i.e. 4.5% or less), Barcelona does have a leading position (though higher diversification indicates weak leadership). This
is the case for Manufacturing and Design, Devel-opment & Testing, where Barcelona holds second position. This also confirms that the latter activities are becoming very important in Barcelona when it comes to attracting foreign investment. Likewise, the number of FDI Projects in
Logistics, Distribu-tion & Transpor-tation activities is higher in Barcelona than in any other EU region. Besides the five business activities already mentioned, there are other, less relevant business activities in terms of FDI Projects where
Figur
e 22
-Top 5 business activities in terms of FDI Pr
ojects in
Bar
celona and their r
elative position in the EU, 2010-2016
Barcelona has a leading position within the EU. In this respect, Figure 23 shows five business activities where Barcelona ranks fifth or above in terms of FDI Projects attraction within the EU.
For Customer Contact and Technical Support centre
activities, Barcelona only received fewer FDI Projects than the first in the ranking (Dublin). With regard to Research & Development and Education & Training activities, Barcelona ranked fourth and third respective-ly (behind French and British regions), and the Catalan region ranked fourth for Construction activities.
Sales, Marketing & Support Manufacturing Business Services Logistics, Distribution & Transportation Design, Development & Testing
1. 1,081 (11.9%)London Lower Silesian92 (1.9%) 832 (15.4%)London Barcelona
69 (2.9%) Dublin 80 (4.5%) 2. 525 (5.8%)Paris Barcelona 85 (1.8%) Paris 281 (5.2%) Dusseldorf60 (2.5%) Barcelona60 (3.3%)
3. 365 (4.0%)Düsseldorf Antwerpen70 (1.5%) 169 (3.1%)Darmstadt 58 (2.4%)London 59 (3.3%)Paris
4. 301 (3.3%)Uusimaa 65 (1.3%)Silesian 161 (3.0%)Dublin Antwerpen58 (2.4%) 56 (3.1%)London
5. 270 (3.0%)Freiburg Sachsen-Anh.65 (1.3%) Oberbayern143 (2,6%) 47 (2.0%)Paris 49 (2.7%)Antrim
Barcelona (11th) 197 (2.2%) Barcelona (14th) 83 (1.4%) UE 9,107 4,835 5,407 2,396 1,799 Source:
Own elaboration from fDi Markets data
Barcelona was the
first EU investment
destination in
Logistics
activities and had
a leading position in
Manufacturing, r&D,
Customer Contact
Centre, Technical
Support Centre and
Education & Training
Figur
e 23
-Five other business activities wher
e Bar
celona
has a leading position in the EU in terms of FDI Projects, 2010-2016
Figur
e 24
-Impact of FDI by activity in Bar
celona,
2010-2016
3.3.3.3
FDI impact of Business activities
in Barcelona
In line with the impact analysis of FDI by sectors in Barcelona (3.3.2.3), this section focuses on the impact of business activities in terms of average jobs created and CapEx generated per FDI Project. This is to understand how labour- and capital-intensive FDI Projects are dependent on the value chain activities.
As seen in the table above, Construction activities are the most labour- and capital-intensive projects, as FDI Projects dedicated to these activities led the impact of job creation and were among the main genera-tors of CapEx between 2010 and 2016. This type of activity created 331 jobs per FDI Project, compared, for instance, to the 111 jobs created by projects in Customer Contact Centre activities. Furthermore, Construction activities generated $56 million of CapEx, $5 million below the amount generated by Logistics, Distribution & Transportation, second in
Construction r&D Customer
Contact Centre Education & Training Technical Support Centre 1. London 52 (6.6%) Paris 17 (5.1%) Dublin 14 (3.6%) London 23 (9.1%) Dublin 15 (8.8%) 2. Masovian 44 (5.5%) Rhône -Alpes 10 (3.0%) Barcelona 11 (2.9%) Paris 14 (5.5%) Barcelona 8 (4.7%)
3. Bucaresti37 (4.7%) 10 (3.0%)London Tyne & Wear11 (2.9%) Barcelona
10 (4.0%) Cork 8 (4.7%) 4. Barcelona 25 (3.2%) Barcelona 9 (2.7%) Berlin 9 (2.3%) 6 (3.4%)Dublin 8 (4.7%)Galway
5. 24 (3.0%)Paris 7 (2.1%)Dublin 9 (2.3%)Antrim 6 (3.4%)Berlin Bucaresti 6 (3.5%)
UE 793 334 385 253 171
Source: Own eleaboration from fDi Markets data
Activities Average jobs in Barcelona per projects
1 Construction 331
2 Logistics, Distribution & Transportation 120
3 Customer Contact Centre 111
4 Technical Support Centre 107
5 Design, Development & Testing 86
6 Manufacturing 77
7 Business Services 49
8 Education & Training 38
9 DevelepmentResearch & 25
10 Sales, Marketing & Support 22
Activities Average CapEx in Barcelona ($M)
1 Manufacturing 74
2 Logistics, Distribution & Transportation 61
3 Construction 56
4 Education & Training 33
5 Design, Development & Testing 19
6 Business Services 16
7 DevelepmentResearch & 13
8 Technical Support Centre 8
9 Customer Contact Centre 5
10 Sales, Marketing & Support 4
Source: Own elaboration from fDi Markets data