Application of Genetic Algorithms to the
Manufacturing of Large Planar Array Antennas on
Radar Applications
L. Rengifo
1, F. Martín
1, J. Torres
1, S. Burgos
2, M. Sierra-Castañer
2and M. Vera
31Indra Sistemas S.A. Ctra de Loeches, 9. 28850 - Torrejón de Ardoz, Madrid Emails: [email protected], [email protected] and [email protected]
2Universidad Politécnica de Madrid. E.T.S.I. de Telecomunicación. Ciudad Universitaria, 28040 Madrid, Spain. Tel. +34913367366 ext. 4053
E-mails: [email protected] [email protected] 3Universidade de Vigo. E.T.S.E de Telecomunicación.
Campus Lagoas-Marcosende 36.310 Vigo, Galicia Spain Tlf: +34 986 812 100 Fax: +34 986 812 116 E-mail: [email protected]
Abstract— A genetic algorithm (GA) is presented to obtain the
best arrangement for the linear arrays (previously measured) used for the construction of a large planar array for radar applications. The designed algorithm allows the selection of the frequency and the pointing, furthermore the given weight of the different parameters of the radiation pattern (SLL, directivity…). Finally, some results are showed.
I. INTRODUCTION
Nowadays, phased array antennas are used on many applications. This is mainly due to their capacity to change their radiation pattern, allowing even several patterns at the same time. These properties make them especially useful for radar applications.
Spanish company Indra has developed in the last years a complete new family of air surveillance radars, called Lanza. These radars work on L band and present as antenna a large planar array composed of a set of linear arrays vertically tiled, with separate feeding distributions in both main planes. The azimuth scan is performed mechanically, whereas the elevation scan is made electronically.
Considering the independent feeding distribution for both plane directions, each one of the linear arrays that shapes the planar antenna is tested to confirm the design specification fulfilment, and so the parameters of the azimuthal cut of the radiation pattern can be easily estimated. To test them, a linear antenna measurement system [1] is used.
Although all the linear arrays which are part of the planar array pass several quality tests in order to verify its specification, they are not completely equal. Actually, they present small variations due to the tolerance of the material electromagnetic features used for their fabrication.
These small differences can slightly affect some radiation properties depending on the placement order over the complete antenna plane. As there are separate feeding distributions, the vertical cut of the radiation pattern will be much more affected than the horizontal one. In this paper a method to take advantage of this matter is presented, improving particular antenna parameters for the vertical cut. The method is based on genetic algorithms (GA) and allows
choosing which parameters are optimized, considering all the frequency band and different vertical pointings. Examples of the results are presented.
II. CONTEXT
As it is well known, the radiation pattern of the radar antenna has an influence on the complete system capabilities. For example, gain is related to the range and side lobe level (SLL) affects to the level of the false alarm rate and jamming.
During the antenna design process all these parameters are optimized according to the radar requirements. However, the commented slight differences among the linear arrays introduce small variations that can be used to perform a fine optimization of some parameters of the vertical cut of the far field radiation pattern.
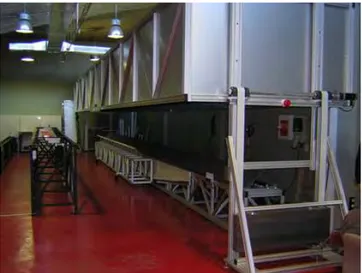
The starting point of the optimization process is the measurement of each linear array performed at the linear measurement system. This system consists of a 12m semi-anechoic box (see figure 1). The antenna under test radiates the field placed inside the box. To acquire that field (in amplitude and phase) all over the frequency band, a probe moves along a linear slide, stopping in front of each array element. Then, the acquired field is processed using FFT techniques, to obtain the far field radiation pattern for the array plane. After that, a post processing is implemented to obtain the radiation pattern main parameters.
Fig 1 Linear Measurement System For Large Array Antennas
III. OPTIMIZATIONMETHOD
An optimization program based on genetic algorithms (GA) has been developed to obtain the best tiling order of the rows according to some optimization objectives. The reason to choose GA is its capability to optimize a multiple variable function (as occurs in this application) without taking derivatives to obtain the next step of the optimization [3]. So, it is possible to select which parameters are going to be optimized just only fixing their weight over the complete optimization process.
Moreover, the developed GA is so flexible that allows expanding the optimization over the entire frequency band and over different pointings.
IV. RESULTS
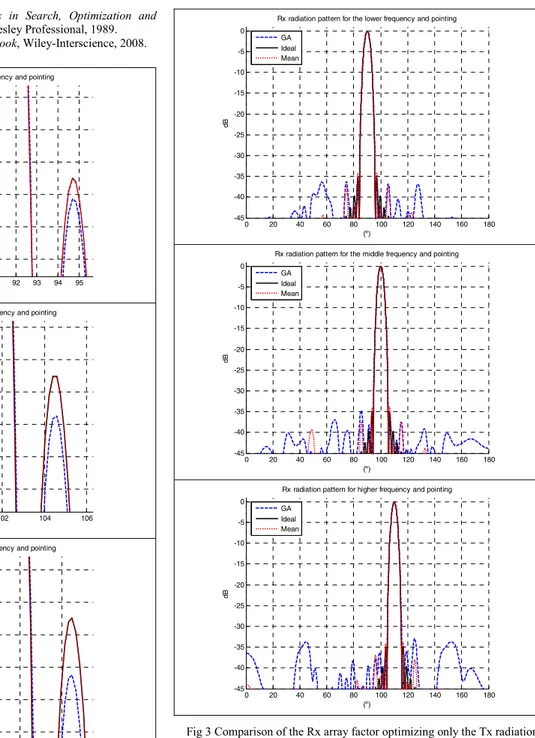
Choosing the weights it is possible to optimize only the Tx or Rx parameters. For example, table 1 and figures 2 and 3 show results obtained considering only Tx and table 2 and figures 4 and 5 only taking into account Rx channel. Both of them use a simulated planar antenna composed of 32 real rows, which were previously measured. Uniform feeding vertical distribution was considered in transmission, and Taylor 35 was fixed for reception. The GA will also consider the quantification information of the attenuators and phased shifters used for beamforming. Eleven frequencies and five pointings were selected for the optimization. The different parameters to optimize (SLL, directivity, pointing and beamwidth) were weighted in the same percentage (25% each one).
Table 1 Results obtained choosing the Tx parameters
Mean of 100
random orders GA Order
Tx Rx Tx Rx
Directivity 15.7 14.5 15.7 14.4
SLL -13.1 -32.4 -13.7 -34.1
Pointing Error 0.01 0.01 0.01 0.01
Beamwidth at 3 dB 2.79 4.02 2.80 4.06
Table 2 Results obtained choosing the Rx parameters
Mean of 100
random orders GA Order
Tx Rx Tx Rx
Directivity 15.7 14.5 15.7 14.5
SLL -13.1 -32.4 -13.3 -35.8
Pointing Error 0.01 0.01 0.01 0.01
Beamwidth at 3 dB 2.79 4.02 2.80 4.05
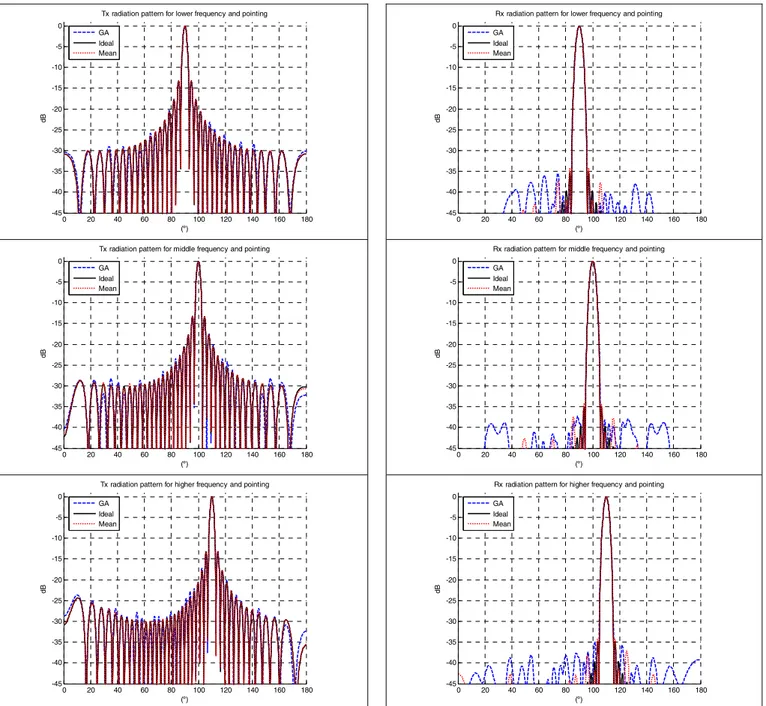
Finally, it is possible to obtain a solution considering Tx as well as Rx (see figures 6 and 7).
Table 3 Results obtained choosing Tx and Rx parameters
Mean of 100
random orders GA Order
Tx Rx Tx Rx
Directivity 15.7 14.5 15.7 14.4
SLL -13.1 -32.4 -13.5 -35.9
Pointing Error 0.01 0.01 0.01 0.01
Beamwidth at 3 dB 2.79 4.02 2.80 4.05
The results obtained (see table 1-3) show that the radiation pattern given by the GA placement order presents an improvement of 3.5 dB on the reception SLL against the mean of 100 random placements (when it is selected this parameter), whereas in transmission the improvement is about 0.5 dB. The rest of the radiation pattern characteristics are not significantly affected.
V. CONCLUSION
The small variations on the linear arrays that form the large planar antennas produce small changes on the final vertical radiation pattern, just due to their placement order. An optimization program based on GA has been developed to take advantage of this, choosing the best distribution in order to optimize different parameters. The developed method is really flexible, allowing optimizing SLL, directivity, beamwidth and pointing as well in transmission as in reception. Also, is possible to select the frequency and pointing domain and give different importance to the parameters to be optimized.
Results over an ideal antenna with real measurements of its 32 rows have been presented, showing a remarkable improvement of the SLL in reception (3.5 dB) and even in transmission (0.5dB) without significant changes on the directivity.
REFERENCES
[1] J. L. Besada, F. Martín, C. Martínez-Portas, M. Sierra-Castañer, M. Calvo Ramón, “A Linear Measurement System For Large Array Antennas”, AMTA symposium proceedings, Rhode Island, USA, November 2005.
[3] D. E. Goldberg, Genetic Algorithms in Search, Optimization and Machine Learning, 1st ed., Addison-Wesley Professional, 1989.
[4] C. A. Balanis, Modern Antenna Handbook, Wiley-Interscience, 2008.
85 86 87 88 89 90 91 92 93 94 95 -14.5
-14 -13.5 -13 -12.5 -12
Tx radiation pattern for lower frequency and pointing
(º)
dB
GA Ideal Mean
96 98 100 102 104 106 -15
-14.5 -14 -13.5 -13 -12.5
Tx radiation pattern for middle frequency and pointing
(º)
dB
GA Ideal Mean
104 106 108 110 112 114 -15
-14.5 -14 -13.5 -13 -12.5
Tx radiation pattern for higher frequency and pointing
(º)
dB
GA Ideal Mean
Fig 2 Comparison of the Tx array factor optimizing only the Tx radiation pattern characteristics
0 20 40 60 80 100 120 140 160 180 -45
-40 -35 -30 -25 -20 -15 -10 -5 0
Rx radiation pattern for the lower frequency and pointing
(º)
dB
GA Ideal Mean
0 20 40 60 80 100 120 140 160 180 -45
-40 -35 -30 -25 -20 -15 -10 -5 0
Rx radiation pattern for the middle frequency and pointing
(º)
dB
GA Ideal Mean
0 20 40 60 80 100 120 140 160 180 -45
-40 -35 -30 -25 -20 -15 -10 -5 0
Rx radiation pattern for higher frequency and pointing
(º)
dB
GA Ideal Mean
0 20 40 60 80 100 120 140 160 180 -45
-40 -35 -30 -25 -20 -15 -10 -5 0
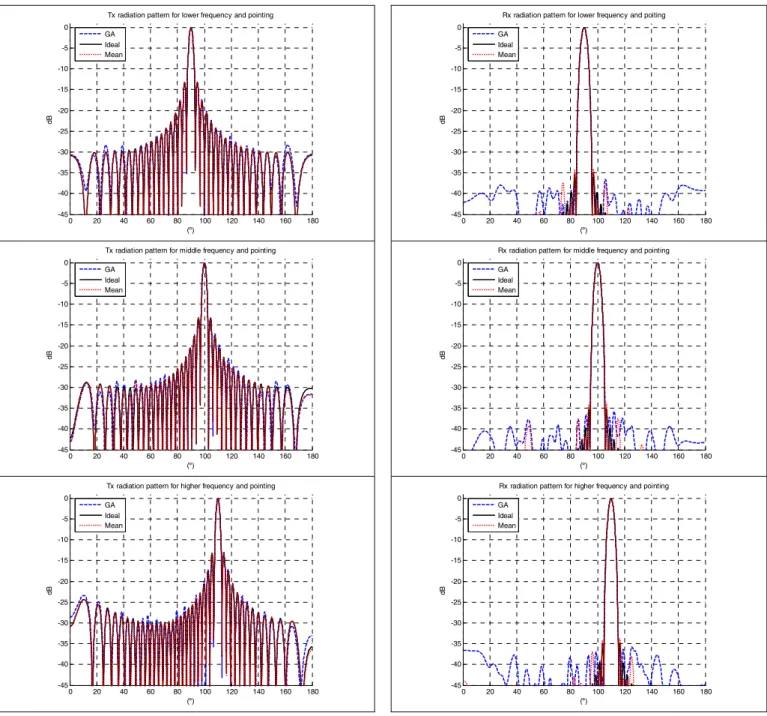
Tx radiation pattern for lower frequency and pointing
(º)
dB
GA Ideal Mean
0 20 40 60 80 100 120 140 160 180 -45
-40 -35 -30 -25 -20 -15 -10 -5 0
Tx radiation pattern for middle frequency and pointing
(º)
dB
GA Ideal Mean
0 20 40 60 80 100 120 140 160 180 -45
-40 -35 -30 -25 -20 -15 -10 -5 0
Tx radiation pattern for higher frequency and pointing
(º)
dB
GA Ideal Mean
Fig 4 Comparison of the Tx array factor optimizing only the Rx radiation pattern characteristics
0 20 40 60 80 100 120 140 160 180 -45
-40 -35 -30 -25 -20 -15 -10 -5 0
Rx radiation pattern for lower frequency and poiting
(º)
dB
GA Ideal Mean
0 20 40 60 80 100 120 140 160 180 -45
-40 -35 -30 -25 -20 -15 -10 -5 0
Rx radiation pattern for middle frequency and pointing
(º)
dB
GA Ideal Mean
0 20 40 60 80 100 120 140 160 180 -45
-40 -35 -30 -25 -20 -15 -10 -5 0
Rx radiation pattern for higher frequency and pointing
(º)
dB
GA Ideal Mean
0 20 40 60 80 100 120 140 160 180 -45
-40 -35 -30 -25 -20 -15 -10 -5 0
Tx radiation pattern for lower frequency and pointing
(º)
dB
GA Ideal Mean
0 20 40 60 80 100 120 140 160 180 -45
-40 -35 -30 -25 -20 -15 -10 -5 0
Tx radiation pattern for middle frequency and pointing
(º)
dB
GA Ideal Mean
0 20 40 60 80 100 120 140 160 180 -45
-40 -35 -30 -25 -20 -15 -10 -5 0
Tx radiation pattern for higher frequency and pointing
(º)
dB
GA Ideal Mean
Fig 6 Comparison of the Tx array factor optimizing Tx and Rx radiation pattern characteristics
0 20 40 60 80 100 120 140 160 180 -45
-40 -35 -30 -25 -20 -15 -10 -5 0
Rx radiation pattern for lower frequency and pointing
(º)
dB
GA Ideal Mean
0 20 40 60 80 100 120 140 160 180 -45
-40 -35 -30 -25 -20 -15 -10 -5 0
Rx radiation pattern for middle frequency and pointing
(º)
dB
GA Ideal Mean
0 20 40 60 80 100 120 140 160 180 -45
-40 -35 -30 -25 -20 -15 -10 -5 0
Rx radiation pattern for higher frequency and pointing
(º)
dB
GA Ideal Mean