Using fuzzy cognitive maps for predicting river management
responses: A case study of the Esla River basin, Spain
Joaquin Solana-Gutierrez , Gonzalo Rincon, Carlos Alonso, Diego Garcia-de-Jalon
A B S T R A C T
The planning and management of river ecosystems affects a variety of social groups (i.e., managers, stakeholders, professionals and users) who have different interests about water uses. To avoid conflicts and reach an environmentally sustainable management, various methods have been devised to enable the participation of these actors. Mathematical modelling of river systems is highly recommended to forecast, but we do not always have enough information to do it. In these cases, the soft and meta-models can be valid alternatives to simulate these complex systems.
The Fuzzy Cognitive Maps (FCMs) are presented as a tool that facilitates the modelling of ecological systems, functions and services. FCM networking concepts are intertwined through causal relationships. The FCM concept spatial arrangement and the use of fuzzy logic facilitate the integration of different expert opinions. In our study, from a panel of seven experts from representatives of different social sectors, an aggregated FCM was obtained. The most central concept in the aggregated map was cross barriers, dams and weirs. Using our FCM expert model, we performed a number of simulations from different possible scenarios, such as the continuous degradation of natural conditions and the improvement of river natural conditions. A regular increment in the natural conditions generates a substantial enhance in variables as natural water flow and sediment transport. Conversely, the increment in human activities as agro-forestry production addresses to a deterioration of river banks among other variables.
In the Esla River, the FCM indicators showed an ecosystem that was greatly influenced by human activity, especially by the presence of barriers, in which the economic variables presented high network influence even though their centrality indices were relatively low. Meanwhile, the essential elements for the proper functioning of this ecosystem, as a natural flow regime, showed very low values that were visibly affected by anthropogenic variables.
FCM methodology enabled us not only to understand the perception of current fluvial ecosystems but also to generate plausible management scenarios based on expert knowledge in this field.
1. Introduction
Mediterranean fluvial ecosystem has always been difficult to manage due to the large number of natural and human fac-tors that affect them. Moreover, the pressure of human activities on these ecosystems has increased over time, reaching a point where most of these systems are highly degraded (Kauffman et al, 1997; Millennium Ecosystem Assessment, 2005; European Environmental Agency, 2012).
The outcomes of continuous human intervention in European rivers have caused a loss of function and environmental services (Elosegi et al., 2010). Thus, plans and actions regarding rivers not only affect natural and economic river resources, but also social assets (Millennium Ecosystem Assessment, 2005; Hommes et al, 2009). This legitimises the need for sustainable fluvial management and ecological restoration.
pro-pose policies and (f) monitor and evaluate impacts (Johnson et al., 2001; Giordano et al, 2005; Rinaudo and Garin, 2005).
To assist in the development of a river management plan based on both public participation and expert knowledge, we propose the use of Fuzzy Cognitive Maps (FCMs) as a semi-quantitative model tool as provides a structured, simple and inexpensive way to model overall fluvial systems through a soft evaluation of the relationship between different concepts and factors interpreted by stakehold-ers (Giordiano et al., 2005; Papageorgiou et al, 2009; Malek, 2017; Paolisso andTrombley, 2017).
Therefore, the present study aims to 1) explain the FCM as qualitative methods to model a fluvial system; 2) analyse the scope of expert knowledge in the development of multi-user decision-making models; and 3) apply the FCM in a case study of a Mediterranean fluvial management.
2. Material and methods
2.1. Fuzzy cognitive maps
FCMs constitute a structured modelling technique that can be used in complex systems (Papageorgiou et al., 2009). Predictions on systems performance are made through a semi-quantitative or semantic assessment of the relationships between concepts (Papageorgiou and Kontogianni, 2012). A FCM can be described as a qualitative model that portrays how a given system operates (Ozesmi and Ozesmi, 2004). The qualitative model is derived by describing the system in terms of its component variables and the causalities among these variables (Park and Kim, 1995).
An FCM is a directed network (i.e., diagraph) composed of nodes or concepts that are used to describe system behaviour and edges that represent the causal links between concepts. Each concept (node) has a state variable that varies from 0 to 1 and it is asso-ciated with an activation variable (i.e., {0} means no-activate and {1} means activate), and each link has an associated real number or weight variable from - 1 , 1 that reflects the relationship "what-if" between concepts (Papageorgiou and Kontogianni, 2012). With the fitted connection weights, a FCM connection matrix is encoded from each FCM as deeply described in Banini and Bearman (1998).
These maps can be obtained by asking people to define the variables of the system and to identify relationships among these variables using "what if rules to justify the cause and effect rela-tionship in each connection inferring a semantic weight for each connection (Stylios and Groumpos, 2000, 2004; Papageorgiou and Groumpos, 2005). This information can be facilitated by filling out questionnaires, interviewing people, checking on scaled semantic attributes or drawing arrows of different width on a concept map (Ozesmi and Ozesmi, 2004).
The construction of a FCM requires the input of human experi-ence and knowledge of the system under consideration. Thus, FCMs integrate the accumulated experience and knowledge concerning the underlying causal relationships among factors, characteristics and components that constitute the system (Papageorgiou and Kontogianni, 2012).
This tool is considered to be a semi-quantitative method because the quantification of concepts and links can be interpreted in rela-tive terms (Kok, 2009).
The main elements of a FCM are nodes or concepts {C\, Cj Cn}; directed edges {C\Cj, etc.}as a set of directed arcs that represent the relationship (positive or negative) between con-cepts; adjacency matrix (Ec = eij) as a matrix that contains the values of each relationship (the values belong to the interval from -1,conversely correlated, and 1, directly correlated) and state vec-tor A = (a\, d2 an) where an is a real number between 0 and 1,
from which the categorical concept status is obtained: 1 activate or 0 no-activate (Kok, 2009; Papageorgiou and Kontogianni, 2012).
2.2. Graph theory and FCM
Cognitive maps are compounds of a large number of variables (one per concept) that have many interconnections and feed-back cycles. The direction and numbers of relationships between variables produce three types of concepts: transmitter concepts, receiver concepts and ordinary concepts (Eden et al., 1992; Harary et al., 1965). The type of variables in a map is important, because the map shows the relationships among these variables and facilitates an understanding of its structure (Ozesmi and Ozesmi, 2004).
Graph theory indices provide a way to characterize FCM struc-tures by means of three indices: outdegree, indegree and the centrality index (Ozesmi and Ozesmi, 2003, 2004).
2.3. FCM development process
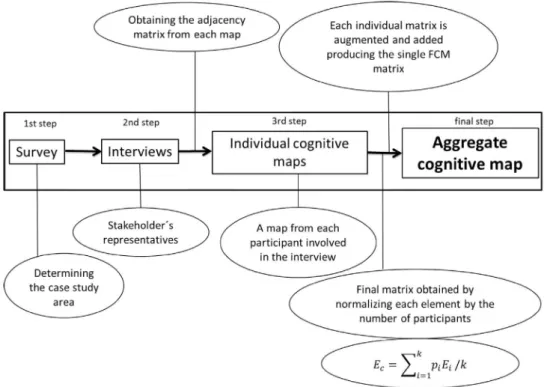
Once the stakeholder and/or expert group interviews were con-ducted, we obtained an individual FCM from each participant. These individual cognitive maps were augmented and additively super-imposed (Kosko, 1987,1986) to generate the aggregate map (Fig. 1). There are a number of different methods to aggregate the individual maps (van Vliet et al., 2017), each has advantages and disadvan-tages. In this case, each individual map was combined to generate a group or social map (Mouratiadou and Moran, 2007). For that, each individual matrix was augmented and added, producing a single matrix that represents the FCM. Then, the final aggregated FCM was obtained by normalizing each adjacency matrix element according to the number of experts who supported it, k, and their decisional weight, Pi (Eq. (1)) (Banini and Bearman, 1998):
E
c= Y
ykPiEi/k (1)
-^—'1=1
Where k represents the number of experts interviewed; p,- is the decisional weight of the expert i, where '^2n_^Vi = 1; £c is the aggre-gated connection matrix, and £,• is the connection matrix written by the expert i. The use of decisional weight p,- for calculating each adjacency matrix element allows a freedom degree for generating new scenarios under different social contexts.
The FCM involved an iterative technique, in which each state variable aa changed its value. Each iteration corresponded to a given interval step, and the value of each item in the current itera-tion was computed based on the values of the preceding items in the previous simulated iteration. Due to the iterative nature of this process, the system represented by a FCM changes over time as: a) a new steady state at equilibrium, b) an un-converged state and c) a periodic loop of states (Curia and Lavalle, 2011). To facilitate the system convergence in each iteration the values of the state vec-tor were filtered by an activation function. According to Bueno and Salmeron (2009), there are mainly four activation functions that determined the activation level of each concept. Among them we have chosen a sigmoid function (Eq. (2)), used in other studies that apply FCM (Stylios and Groumpos, 1999).
/ ( x ) = l/(l+e-m(x-'j>)) (2)
Obtaining the adjacency matrix from each map
1st step 2nd step
Survey Interviews
Each individual matrix is augmented and added producing the single FCM
matrix
3rd step
Individual cognitive maps
final step
Aggregate
cognitive map
Final matrix obtained by normalizing each element by the
number of participants
Z
PiEi/*
Fig. 1. Schematic representation of a step by step FCM generation process. There are 4 main steps, connected in the figure by bold arrows. Bubbles represent the depiction of the process produced in each step and what happens between each step of the process.
on output variables, and then a more graduated policy can be sim-ulated. This procedure is applied to keep the status variable as a categorical variable which facilitates convergence. In addition, this graduated method offers the possibility of developing easily comparative analysis between scenarios in a complex decisional environment (Bueno and Salmeron, 2009).
2.4. Simulation process
The FCM was used to analyse the system behaviour by running simulations and to determine future possible management sce-narios, which can serve to guide environmental managers in the decision-making process regarding the objective system (e.g., the river system). Simulations were made by multiplying the initial state vector {A\) by the adjacency matrix of the aggregate FCM (£c), where A\ is a row vector of size lxN, with N being the total number of variables (Tan and Ozesmi, 2006).
The process of simulation begins when we assign a value of 1 (i.e., activate concept) to each variable. Based on the collective expert/stakeholder knowledge, each activated concept contributed its weight to activate its descendent concepts; then, these con-cepts are free to interact with others concon-cepts (Papageorgiou and Kontogianni, 2012). In each iteration, the filter function was applied, which produced a new state vector with {1} activated con-cepts and {0} no-activate concon-cepts. If a concept has an activation value of 0, this concept would not contribute at the next iteration, whereas an activation value of 1 would represent the contribution at the next iteration.
The next step was to obtain responses on management scenarios by asking "what-if questions to determine the state of the system that would be developed under different conditions or if different policy options were implemented (Kosko, 1987).
3. The case study area
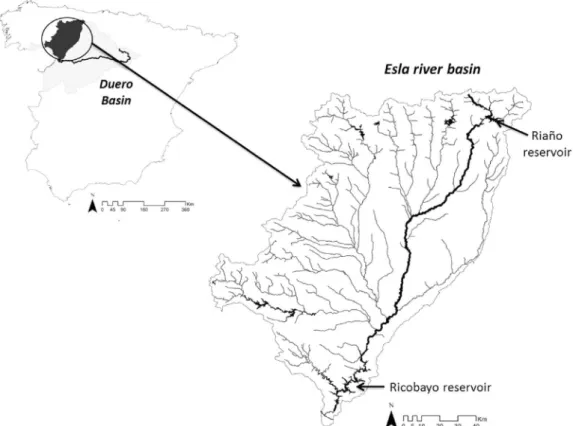
Esla River is a tributary of Duero River on its right bank, located in the Iberian Peninsula (Fig. 2). It has a basin area of 16026 km2,
a length of 287.83 km and an average of 5066 hm3 annually (CHD,
2015).
Two large reservoirs are located along the river. The Riafio is on the riveris source, with a maximum capacity of 650 hm3 and an area of 817.51 km2 (CHD, 2015). Ricobayo is near the mouth of the Esla River in the Duero River. Ricobayo has a maximum capacity of 1179 hm3 and covers an area of 159.52 km2 (CHD, 2015).The pres-ence of these dams conditioned the riveris natural flows regime, changing the natural pattern of the river downstream from the dams with an increase of water availability in summer, coincid-ing with irrigation season. The presence of the Alto de Payuelos, Cea-Carrion, Curuefio-Porma and Paramo Bajo channels plays an important role in the Esla River basin regulation (CHD, 2015).
This fluvial system supplies water to a total of 278,000 people, including the city of Leon; to an irrigation area of 97,000 ha; to three fish farms; and to the refrigeration system of the Robla ther-mal power plant. In addition, 19 hydroelectric plants are present, with a combined capacity of 451 MW and an average production of 1115 GWh. A marked increase of irrigation demand is expected (CHD, 2015).
4. Application of FCM to Esla River basin
An FCM was applied to model the perception of a group of experts in river issues to develop a future Esla River management plan. The FCMs were obtained by seven in-depth interviews con-ducted in group sessions with experts in fluvial ecosystem and water resources who acted as representatives of the river authority, municipalities, farmers and hydroelectric enterprises. We believed that a sample of seven expert interviews was manageable and suf-ficient to draw conclusions.
JT^-0 5 1JT^-0 2JT^-0 3JT^-0 4JT^-0
Fig. 2. Map of the Esia River Basin located on the northwest part of the Iberian Peninsula.
Table 1
Predefined variables.
Variable Definition
Cross barriers, dams and weirs Natural water flow regime Water quality
Sediments dynamics Agro-forestry production Urban uses, infrastructures
Continuity and width of riparian landscapes Socioeconomic aspects
Riparian vegetation In-stream communities Hydroelectric production
River connectivity (longitudinal, lateral and vertical) Bank conditions
Set of artificial barriers that prevent or obstruct the natural water flow Water flow in natural conditions
Physicochemical status of surface and ground waters
Erosion, transport and sedimentation balance in natural conditions
Agricultural and livestock farming in river banks and floodplains (presumably water abstractors) Presence of human structures near the river that alter the natural river dynamic
Riparian vegetation in a continuous strip Influence of human activities on river ecosystems
Vegetal species associated with the riparian ecosystem and their quantity and quality Fish and other animal species populations living in/around the river canal
Alteration of the river ecosystem due to the existence of hydroelectric power plants Connectivity of riparian ecosystem
Alteration of river banks
between pressures, processes, states, impacts and response vari-ables in European rivers (OECD, 1993; EEA, 2012). This conceptual scheme was made after a deep review process of scientific doc-uments and publications that explicitly reported causal effects between river pressures and biological responses in fluvial systems (Garcia de Jalon et al., 2013; Lorenz, 2015).
The participants were also provided with a table that had a rating scale of 10°, numbering from - 5 to 5, by which they could describe any type of connection between the variables (Table 2). The weights of the connections were added when answering the following ques-tion: "Do you think that variable x is affected by or affects any other variables?" (Mouratioadou and Moran, 2007).
To analyse the structure of the map according to the graph theory, important FCM indices such as indegree, outdegree and centrality were calculated in R (Kolaczyk and Csardi, 2014). The simulation of different management scenarios was also calcu-lated with the Fuzzy Cognitive Mapping & Modelling software tool (Bachhofer and Wildenberg, 2010) (freely available in www. fcmappers.net). The variables with the highest centrality, indegree and outdegree are depicted in Table 4.
Table 2
Interpretation of the causal relationships between variables.
Strength connection by interviewer - 5 - 4 - 3 - 2 - 1 1 2 3 4 5
Sign and strength of relationship (linguistic weight)
Negatively very strong Negatively strong Negatively medium Negatively weak Negatively very weak Positively very weak Positively weak Positively medium Positively strong Positively very strong
Interpreted crisp weight
- 1 -0.8 -0.6 -0.4 -0.2 0.2 0.4 0.6 0.8 1
5. Results
5.2. FCM outcome
'iiedimenis dynamics
Natural water flow regime
Cross barriers, dams and w
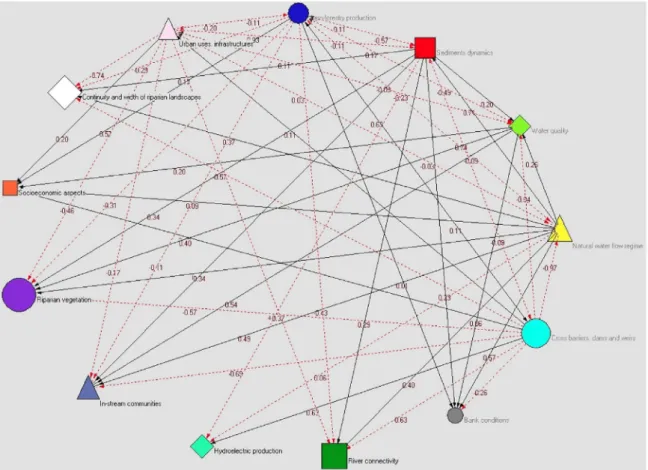
Fig. 3. Aggregated FCM of the Esla River.
Table 3
Comparison of the values between individual maps and collective FCM.
Index Individual FCMs Aggregated FCM
Number of maps Variables
Number of connections Connections/variables Density
7 13 46.57 ± 26.42 1.58 0.124
1 13 114 8.77 0.67
into them. So, a total of 13 variables with 114 connections were observed in the aggregated FCM (Table 3), which are shown in Fig. 3, painted with the software Pajek (Batagelj and Mrvar, 1998).
As seen in Fig. 3, arrows mean the causal-effect relationships and nodes symbolise concepts. The continuous lines represent positive relationships while dotted lines represent a negative relationship. The most influential or central variable was "Cross barriers, dams and weirs" as many arrows come in and come out from this node. The most affected variables (i.e., receivers) by others are (in order) "Riparian vegetation", "River connectivity", "Sediment dynamics", "Continuity and width of riparian landscapes", "In-stream communities", "Water quality", "Bank conditions" and "Socio-economic aspects".
The most central variable was "Cross barriers, dams and weirs". This variable had a strong effect on the other variables (outdegree of 6.54), and they were affected by an indegree of 0.4. The variables
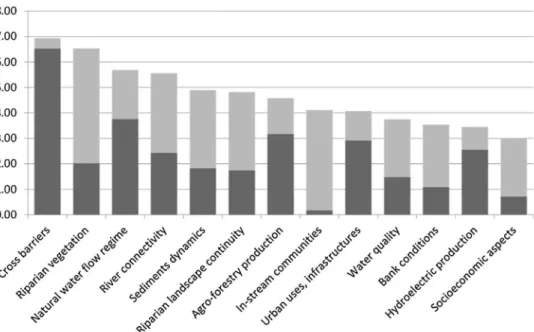
were ordered according to their centrality, as shown in Fig. 4 and Table 4.
The variables that greatly affected other variables (outde-gree > inde(outde-gree) (i.e., transmitters or drivers) were "Cross barriers, dams and weirs", "Natural water flow regime", "Agro-forestry pro-duction", "Urban uses" and "Hydroelectric propro-duction", whereas the opposite situation was for "Riparian vegetation", "River con-nectivity", "Sediment dynamics", "Continuity and width of riparian landscapes", "In-stream communities", "Water quality", "Bank condi-tions" and "Socio-economic aspects" (Table 4).
6. Scenario simulations
First, the steady state of the Esla River system was obtained before considering any fluvial management action. The steady state vector characterized the system according to the panel of experts!, actorsi and stakeholders' knowledge. If a concept was reinforced by a policy, the state vector would change, and the effects would be measured as a difference of the value of the concepts. To deter-mine the steady state, we ran a FCM process starting with an initial state vector A0, with all variables set to 1 (Fig. 5), and after con-vergence an equilibrium or steady state vector was obtained. Then we ran a battery of simulations with different activation levels (i.e., from 0 to 1 by 0.1) for some specific concepts to generate different restoration scenarios (Fig. 6).
Table 4
Variables with the highest centrality, indegree and outdegree.
Centrality (Influential) Indegree (Receiver or state) Outdegree (Transmitter or driver)
Cross barriers, dams and weirs Riparian vegetation
Natural water flow regime
Riparian vegetation In-stream communities River connectivity
i Outdegree Indegree
8.00
7.00
6.00
5.00
4.00
3.00
2.00
1.00
0.00
^H ^H I
IIIII_II•
s& &
Jf
JT
f
&
if
# ^ J? J? ^ J>
*<*/ y /
A
/ <f / <fi y S f jf
#
v - * "
F jf
if
.«*
* *
v *^
Fig. 4. Representation of the importance of the variables in the aggregated FCM according to their centrality, which is the sum of the indegree and outdegree of a variable,
and demonstrates the importance of the variable.
0.90
/
Fig. 5. Simulation of the steady state conditions of the variables obtained from the aggregate FCM. Environmental variables are coloured in grey and the socioeconomic
variables are coloured in black.
Expectedly, "Cross barriers" was the most central variable, because this concept was an artificial element that altered further natural river conditions and affected many of the socio-economic variables. Next, the most central variables, such as "Riparian vege-tation" and "Natural water flow regime", were the natural variables that were currently affected by anthropic activities in the Esla River Basin.
As Fig. 5 shows, socioeconomic variables had higher initial val-ues than most of the environmental variables, because the Esla River, like most Mediterranean rivers, is a system that is
heav-ily degraded by anthropogenic activities (EEA, 2012). Therefore, socioeconomic variables had a very high initial value, despite not being the most central variables in our knowledge map. Other-wise, the "Natural water flow regime" showed a low value in our steady state system, due to the strong influence that other variables with high outdegree values, such as "Cross barriers" or "Agroforestry production", had on the system.
Value of "cross barriers" concept
Value of "agroforestry production" concept (c)
Value of "natural water flow regime" concept (b)
Value of "urban uses, infrastructures" concepts
(d)
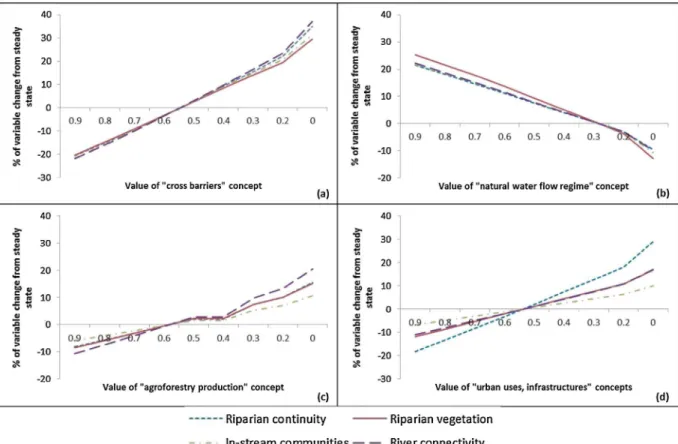
• Riparian continuity Riparian vegetation
In-stream communities River connectivity
Fig. 6. Influence of concepts with a high outdegree (i.e., transmitters or drivers) on concepts with a high indegree (i.e., receivers or state). We simulated the values of the concepts with high outdegree values on the variables with high indegree values to determine the percentage of change from steady state conditions under different management situations. Situation 1 (a): Simulation of the "Cross barriers" concept in which a decrease determines a continuous increment in the selected variables. Situation 2 (b): The decrease in the value of the variable "Natural water flow regime" caused a progressive reduction in the value of the selected variables. Situation 3 (c): A decline in the variable "Agroforestry production" produces a general increment with a flat tendency when the value of the simulation was between 0.6 and 0.4. Situation 4 (d): An increasing trend in the values of the analysed variables was observed when performing a downward simulation of the variable "Urban uses, infrastructures".
quantified the effects of different actions applied to the manage-ment of the Esla River. In our study, we aimed to determine the results of simulating variables with high outdegree values regard-ing variables with large indegree values, because we considered the importance of regulating the effects of the strong variables and how most sensitive variables reacted when changes were made.
Once the effects of simulating the main high outdegree variables were determined, different management scenarios were developed based on the simulation of one of the system variables or several variables together. These scenarios included: 1) the increase in the presence of dams due to the requirements of agricultural uses and 2) the increase of river connectivity, especially longitudinal con-nectivity. The objective was to measure the degree to which the variables changed from their steady state values. A negative value indicated a reduction in the variable state compared with the ini-tial conditions, while a positive value reflected an increase in the variable state (Tan and Ozesmi, 2006).
6.1. Scenario 1: increment the presence of transversal barriers
This scenario simulated the effects of increasing the number of cross barriers (dams and weirs) in the river. We expected the decrease of natural water flow, which meant that there was an alteration in the sediment balance. The longitudinal connectivity of the river also decreased due to the discontinuity generated by the presence of new obstacles. On the contrary, we expected the agro-forestry production, infrastructures, hydroelectric produc-tion and socioeconomic aspects to increase.
6.2. Scenario 2: increment of river connectivity
This scenario simulated the effects of increasing the river con-nectivity of the Esla River. We expected the decrease in the presence of artificial barriers and, therefore, an increase in natural water flow regime, sediments dynamics, riparian vegetation, riparian landscape continuity, in-stream communities and bank conditions.
7. Discussion
7.1. Characteristics of the variables
determin-Worst scenario for natural conditions Better scenario for natural conditions 200
150
01
a
>• 10001
cm c
o 50
-I
-50
-100
• •
I
I
I
t-l
o
a.
»-tt
o
M
2
5
5
C ra
^
5 c
'•P
c o u
*j
1
JS
&
1
CL r£ o c o
u gi
o o <S)
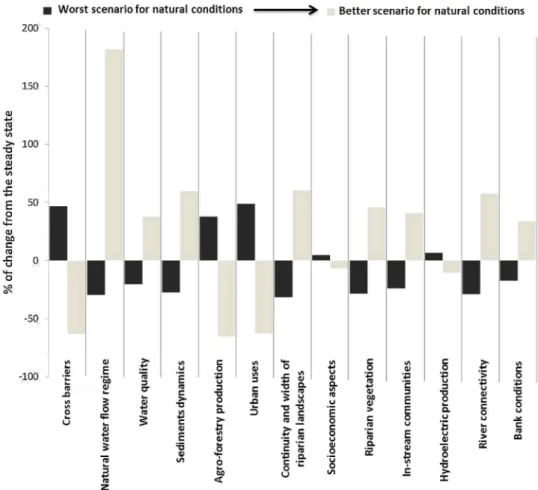
Fig. 7. Effects of simulating several concepts in our aggregated FCM. We simulated a decrease in the transmitter concepts "Cross barriers" (1), "Agroforestry production" (5)
and "Urban uses, infrastructures" (6), while there was an increase in the "Natural water flow regime" (2), and we obtained the relative effects on the other variables: "Water
quality"(3), "Sediments dynamics" (4), "Continuity and width of riparian landscapes" (7), "Socioeconomic aspects" (8), "Riparian vegetation" (9), "In-stream communities" (10), "Hydroelectric production" (11), "River connectivity" (12), and "Bank conditions" (13). The results depicted the percentage of change from the steady state in two different
simulations: from a worst scenario for natural conditions (dark coloured bars) to the best scenario for natural conditions (light coloured bars) and the tendency among both scenarios.
ing the roles of the variable in the ecosystem. Moreover the most important variables were those with high centrality values, because they controlled the dynamics of the system. This concept classi-fication (i.e., driver vs state) highlighted the FCM robustness for capturing the core concepts of the fluvial ecosystem by only using qualitative information (Tan and Ozesmi, 2006). In addition, the procedure for building the aggregate cognitive map from a differ-ent set of points of view provided a high level of represdiffer-entativeness for the FCM results.
7.2. Aggregation process, steady vector and general issues
This study explored the use of the FCM as a tool for simulating fluvial ecosystem responses and forecasting concept trends. Some drawbacks can be found during the aggregation process where the individual maps are combined into a general one. The existence of new methodologies recently published for map aggregation can be combined with previous simpler aggregation methodologies: how-ever there is no consensus on how to best construct the aggregated FCM (van Vliet et al., 2017). Despite, the aggregate FCM was used in this research to reach the steady state vector by activating start con-cepts and then obtaining responses by solving a system of filtered linear equations. Adjacent matrix coefficients were estimated as an average of the individual expert's values, and standard error can be also estimated for each coefficient. This provided an estimate interval and a significance level to evaluate the FCM explicative power (Shmueli, 2010; Shmueli and Koppius, 2011). In addition, keeping adjacency matrix for each representative expert allows
making weighted averages based on different social composition. For instance, a change toward a more "ecologist" concerned society can be model by an increment in the weight of ecologist represen-tative, conversely, a more "productivist" society shall be model by higher loading for farmer and landowners.
In the Esla River FCM, the steady state vector showed an ecosys-tem that was greatly influenced by human activity, in which the economic and social variables presented high network influence, even though their centrality indices were relatively low. Mean-while, the essential elements for the proper functioning of this ecosystem, as a "natural flow regime", showed very low values that were affected by anthropogenic variables.
7.3. Simulation of management scenarios
7.3.2. Scenario 1: increment the presence of transversal barriers This scenario simulated an increment in the placement of new artificial barriers in the Esla River (Fig. 7). The highest indegree variables were greatly affected by the increment in the value of this variable, whose outdegree was the highest of the entire system. The width and continuity of the riparian corridor would be affected, because the river regulation involves fundamental changes in the flow and sediment transfer, which were the main factors in fluvial morphodynamic changes (Church, 1995). The trend of an increase in agricultural land in the study area corresponded to the need to build more water storage structures that would alter the ecosys-tem downstream of its location (Ward and Stanford, 1983, 1995; Petts and Gurnell, 2005, 2013; Vorosmarty et al., 1997). As shown in Fig. 6a, the presence of riparian vegetation would be reduced downstream of the dams (Nilsson et al, 1991; Andersson et al., 2000; Merritt et al, 2010; Merritt and Wohl, 2002, 2006). Fig. 6a. also shows that in-stream communities were not immune to the further fragmentation of the river. A strong impact on species migration and diversity was due to the effect of artificial barriers (Kingsford, 2000; Cote et al., 2009; Jager et al., 2001). Clearly, the hydrological connectivity would be greatly altered by the existence of dams (Ward and Stanford, 1983, 1995, 2006; Segurado et al., 2013, 2014). Pringle (2003) argued that "hydrologic connectivity is essential to the ecological integrity of the landscape, and reduc-tion or enhancement of this property by humans can have major negative environmental effects".
7.3.2. Scenario 2: increment of river connectivity
This scenario simulated a situation in which an increase of river connectivity was achieved due to the intervention of other variables ("Cross barriers", "Agroforestry production", "Urban uses, infrastruc-tures", etc.), which caused a hindrance to the natural connectivity of the river (Fig. 7). According to the idea of the multiple dimen-sions of fluvial connectivity (Ward, 1989), the measurements made in this simulation were aimed at diminishing the importance of the variables that generated a disturbance in one or more of the river connectivity dimensions. Variables such us "agro-forestry produc-tion" and "urban uses" would be reduced from their initial values due to an increase in the interactions of the river channel with the adjacent riparian system and the floodplain, improving the exchanges of nutrients and organic matter (Ward, 1989).
Special efforts to improve the longitudinal dimension of connec-tivity should be considered, as it determines several vital ecological processes (Ward, 1989; Tockner et al., 1998; Lucas et al., 2001). The reduction of the disconnection generated by artificial barri-ers lead to a progressive increase in the water flow regime, which could be the most important measure to recover the riverine ecol-ogy, and it needs to be implemented first in a fluvial restoration process (Lorenz et al., 2015). The variable "in-stream communities" increased its value parallel to an increment in the connectivity value due to the longitudinal connectivity restoration having positive impacts on fish species, especially in migratory species (Segurado etal., 2014).
For these reasons, all of the approaches that were oriented to enhance the unions between habitat patches (in this case, river segments separated by artificial barriers) should be applied in con-servation planning (Eros et al., 2011).
8. Conclusion
The present river management will produce a future response on the river ecosystem which should be forecasted. The use of FCMs to determine the behaviour of Esla River and possible future management scenarios was useful in building a model based on the available knowledge of how a complex system was perceived,
because more detailed information may not be available. This methodology dealt with the connections between the ecological and social concepts of an ecosystem. FCMs are subject to limitations due to their semi-quantitative approach. Nevertheless, they were proven to be suitable for organizing complex ecosystem models, in which concepts and the causal relationships between them could be determined. The analysis of how variables with high outdegree values affected variables with high indegree values was valuable for quantifying the effects of the impact over the most sensitive variables and for determining the behaviour of the system. The sim-ulations suggested that to develop an effective fluvial management plan according to the experts involved in the process, a reduction in the effects of the artificial barriers that leads to an increase of the naturalization of the river system is necessary.
Stakeholder participation is the primary component of the FCM methodology. In this case, the reviews of seven experts regarding river issues provided a clear description of how the river ecosys-tem worked together. Expanding the use of this methodology to other stakeholders, such as local residents, consumer associations or ecologists, for further research and studies will be essential. However, more research is needed on the process of aggregating individual maps into a single map to prevent that the perceived knowledge on their individual map by each stakeholder are under-valued on the final map.
Therefore, we determined that FCMs were a good tool for deci-sion making and could be a suitable methodology for generating simulations of future policy scenarios aimed to develop realistic fluvial restoration works and better conservation strategies.
Acknowledgements
This research was partially supported by the European Union 7th Framework Project REFORM under contract no. 282656. Two anonymous reviewers are thanked for their helpful comments and insights.
References
Ozesmi, U, Ozesmi, S.L., 2003. A participatory approach to ecosystem
conservation: fuzzy cognitive maps and stakeholder analysis in Uluabat Lake, Turkey. Environ. Manage. 31 (4), 518-531.
Ozesmi, U, Ozesmi, S.L., 2004. Ecological models based on people's knowledge: a multi-Step fuzzy cognitive mapping approach. Ecol. Model. 176, 43-64.
Andersson, E., Nilsson, C, Johansson, M.E., 2000. Plant dispersal in boreal rivers and its relation to the diversity of riparian flora. J. Biogeogr. 27,1095-1106.
Bachhofer, M., Wildenberg, M., 2010. FCMappers. http://www.fcmappers.net.
Banini, G.A., Bearman, R.A., 1998. Application of fuzzy cognitive maps to factors affecting slurry rheology. Int. J. Miner. Process. 52, 233-244.
Batagelj, V., Mrvar, A., 1998. Pajek - program for large network analysis. Connections 21, 47-57.
Bueno, S., Salmeron, J.L., 2009. Benchmarking main activation functions in fuzzy cognitive maps. Expert Syst. Appl. 36 (3), 5221-5229.
CHD, 2015. Confederacion Hidrograflca Del Duero (http://www.chduero.es, Last Access 3 May 2015).
Church, M., 1995. Geomorphic response to river flow regulation: case studies and time-scales. Regul. Rivers: Res. Manag. 11,3-22.
Cote, D., Kehler, D.G., Bourne, C, Wiersma, Y.F., 2009. A new measure of longitudinal connectivity for stream networks. Landsc. Ecol. 24,101-113.
Curia, L., Lavalle, A., 2011. Decision strategies in dynamic systems using fuzzy cognitive maps. Application to a socio - economic example. J. Inf. Syst. Technol. Manag. 8 (3), 663-680.
Eden, C, Ackerman, F., Cropper, S., 1992. The analysis of cause maps. J. Manag. Stud. 29,309-323.
Elosegi, A., Diez, J.R., Mutz, M., 2010. Effects of hydromorphological integrity on biodiversity and functioning of river ecosystems. Hydrobiologia 657,199-215.
Eros, T., Schmera, D., Schick, R.S., 2011. Network thinking in riverscape conservation-a graph-based approach. Biol. Conserv. 144 (1), 184-192.
Eshuis, J., Stuiver, M., 2005. Learning in context through conflict and alignment: farmers and scientists in search of sustainable agriculture. Agric. Hum. Values 22(2), 137-148.
European Environmental Agency, 2012. European Waters - Assessment of Status and Pressures. EEA Report No 8/2012.
Geerling, G., 2013. Review on pressure effects on hydromorphological variables and ecologically relevant processes. In: REFORM (7th FP No.282656), Deliverable D1.2. Effects of Pressures on Hydromorphology. http://www. reform rivers.eu/deliverables/dl-2.
Giordano, R., Passarella, G., Uricchio, V.F., Vurro, M., 2005. Fuzzy cognitive maps for issue identification in a water resources conflict resolution system. Phys. Chem. Earth 30,463-469.
Harary, F., Norman, R.Z., Cartwright, D., 1965. Structural Models: An Introduction to the Theory of Directed Graphs. John Wiley & Sons, New York.
Hommes, S., Vinke-de Kruijf, J., Otter, H.S., Bouma, G., 2009. Knowledge and perceptions in participatory policy processes: lessons from the delta-region in the Netherlands. Water Resour. Manag. 23,1641-1663.
Jager, H.I., Chandler, J.A., Lepla, K.B., Van Winkle, W., 2001. A theoretical study of river fragmentation by dams and its effects on white sturgeon populations. Environ. Biol. Fishes 60,347-361.
Johnson, N., Ravnborg, H.M., Werstermann, O., Probst, It, 2001. User participation in watershed management and research. Water Policy 3,507-520.
Kauffman, J.B., Beschta, R.L., Otting, N., Lytjen, D., 1997. An ecological perspective of riparian and stream restoration in the Western United States. Fisheries 22 (5), 12-24.
Kingsford, R.T., 2000. Ecological impacts of dams, water diversions and river management on floodplain wetlands in Australia. Aust. Ecol. 25,109-127.
Kok, K., 2009. The potential of Fuzzy Cognitive Maps for semi-quantitative scenario development, with an example from Brazil. Glob. Environ. Change 19,122-133.
Kolaczyk, E.D., Csardi, G., 2014. Statistical Analysis of Network Data with R, vol. 65. Springer.
Kosko, B., 1986. Fuzzy cognitive maps. Int. J. Man-Mach. Stud. 1,65-75.
Kosko, B., 1987. Adaptive inference in fuzzy knowledge networks. In: Proceedings of the First IEEE International Conference on Neural Networks (ICNN-86), San Diego, CA, pp. 261-268.
Lorenz, S., Martinez-Fernandez, V., Alonso, C, Mosselman, E., Garcia de Jalon, D., Gonzalez del Tanago, M., Belletti, B., Hendriks, D., Wolter, C, 2015. Fuzzy cognitive mapping for predicting hydromorphological responses to multiple pressures in rivers. J. Appl. Ecol. 53 (2), 559-566.
Lucas, M.C., Baras, E., Thorn, T.J., Duncan, A., Slavik, O., 2001. Migration of Freshwater Fishes, vol. 47. Blackwell Science, Oxford.
Malek, Z., 2017. Fuzzy-logic cognitive mapping: introduction and overview of the method. In: Gray, S., Paolisso, M., Jordan, R., Gray, S. (Eds.), Environmental Modeling with Stakeholders, Theory, Methods and Applications., pp. 127-143 (chapter 7).
Merritt, D.M., Wohl, E.E., 2002. Processes governing hydrochory along rivers: hydraulics, hydrology, and dispersal phenology. Ecol. Appl. 12,1071-1087.
Merritt, D.M., Wohl, E.E., 2006. Plant dispersal along rivers fragmented by dams. River Res. Appl. 22,1-26.
Merritt, D.M., Nilsson, C, Jansson, R., 2010. Consequences of propagule dispersal and river fragmentation for riparian plant community diversity and turnover. Ecol. Monogr. 80, 609-626.
Millennium Ecosystem Assessment, 2005. Ecosystems and Human Well-being: Synthesis. Island Press, Washington, DC.
Mouratiadou, I., Moran, D., 2007. Mapping public participation in the water framework directive a case study of the Pinios river basin, Greece. Ecol. Econ. 62,66-76.
Nilsson, C, Ekblad, A., Gardfjell, M., Carlberg, B., 1991. Long-term effects of river regulation on river margin vegetation. J. Appl. Ecol. 28,963-987.
OECD, 1993. OECD core set of indicators for environmental performance reviews. In: A Synthesis Report by the Group on the State of the Environment. Environment Monographs, Paris, pp. 83.
Paolisso, M., Trombley, J., 2017. Cognitive, material and technological
considerations in participatory environmental modeling. In: Gray, S., Paolisso, M., Jordan, R., Gray, S. (Eds.), Environmental Modeling with Stakeholders, Theory, Methods and Applications., pp. 3-23 (chapter 1).
Papageorgiou, E.I., Groumpos, P.P., 2005. A new hybrid method using evolutionary algorithms to train Fuzzy Cognitive Maps. Appl. Soft. Comput. 5,409-431.
Papageorgiou, E.I., Kontogianni, A., 2012. Using Fuzzy Cognitive Mapping in Environmental Decision Making and Management: A Methodological Primer and an Application, International Perspectives on Global Environmental Change. In: Young, S. (Ed.). InTech.
Papageorgiou, E.I., Markinos, A., Gemtos, T., 2009. Application of fuzzy cognitive maps for cotton yield management in precision farming. Expert Syst. Appl. 36 (10), 12399-12413.
Park, K.S., Kim, S.H., 1995. Fuzzy cognitive maps considering time relationships. Int. J. Hum.-Comput. Stud. 42,157-168.
Petts, G.E., Gurnell, A.M., 2005. Dams and geomorphology: research progress and future directions. Geomorphology 71, 27-47.
Petts, G.E., Gurnell, A.M., 2013. Hydrogeomorphic effects of reservoirs, dams and diversions. In: Shroder, J., James, L.A., Harden, C.P., Clague, J.J. (Eds.), Treatise on Geomorphology, vol. 13. Academic Press, San Diego, CA, pp. 96-114
(Geomorphology of Human Disturbances, Climate Change, and Natural Hazards).
Pringle, C, 2003. What is hydrologic connectivity and why is it ecologically important? Hydrol. Process. 17, 2685-2689.
Rinaudo, J.D., Garin, P., 2005. The benefits of combining lay and expert input for water-management planning at the watershed level. Water Policy 7 (3), 279-294.
Segurado, P., Branco, P., Ferreira, M.T., 2013. Prioritizing restoration of structural connectivity in rivers: a graph based approach. Landsc. Ecol. 28,1231-1238.
Segurado, P., Branco, P., Avelar, A.P., Ferreira, M.T., 2014. Historical Changes in the Functional Connectivity of River Based on Spatial Networks Analysis and the Past Occurrences of Diadromous Species in Portugal. Aquatic Sciences.
Shmueli, G., Koppius, O.R., 2011. Predictive analytics in information systems research. MIS Q. 35 (3), 553-572.
Shmueli, G., 2010. To explain or to predict? Stat. Sci., 289-310.
Stylios, CD., Groumpos, P.P., 1999. Mathematical formulation of fuzzy cognitive maps. Proceedings of the 7th Mediterranean Conference on Control and Automation, 2251-2261.
Stylios, CD., Groumpos, P.P., 2000. Fuzzy cognitive maps in modeling supervisory control systems. J. Intell. Fuzzy Syst. 8, 83-98.
Stylios, CD., Groumpos, P.P., 2004. Modelling complex systems using fuzzy cognitive maps. IEEE Trans. Syst. Man Cybern Part A 34 (1), 155-162.
Tan, CO., Ozesmi, U., 2006. A generic shallow lake ecosystem model based on collective expert knowledge. Hydrobiologia 563,125-142.
Tockner, It, Schiemer, F., Ward, J.V., 1998. Conservation by restoration: the management concept for a river-floodplain system on the Danube River in Austria. Aquat. Conserv. 8, 71-86.
van Vliet, M., Kok, It, Veldkamp, A., Sarkki, S., 2012. Structure in creativity: an exploratory study to analyse the effects of structuring tools on scenario workshop results. Futures 44 (8), 746-760.
van Vliet, M., Florke, M., Varela-Ortega, C, Cakmak, E.H., Khadra, R., Esteve, P., D'Agostino, D., Dudu, H., Barlund, I., Kok, It, 2017. FCMs as a common base for linking participatory products and models. In: Gray, S., Paolisso, M., Jordan, R., Gray, S. (Eds.), Environmental Modeling with Stakeholders, Theory, Methods and Applications., pp. 145-170 (chapter 8).
Vorosmarty, C.J., Meybeck, M., Fekete, B., Sharma, It, 1997. The potential impact of neo-castorization on sediment transport by the global network of rivers. Proc. Rabat Symp. On Human impact on erosion and sedimentation. IAHS Public 24, 261-273.
Ward, J.V., Stanford, J.A., 1983. The serial discontinuity concept of lotic ecosystems. In: Fontaine, T.D., Bartell, S.M. (Eds.), Dynamics of Lotic Ecosystems, Ann Arbor Science., pp. 29-42.
Ward, J.V., Stanford, J.A., 1995. The serial discontinuity concept: extending the model to floodplain rivers. Regul. Rivers: Res. Manag. 10,159-168.
Ward, J.V., Stanford, J.A., 2006. Ecological connectivity in alluvial river ecosystems and its disruption by flow regulation. Regul. Rivers: Res. Manag. 11,105-119.