Optically Induced Modulation of a
Laser Beam in Nematic Liquid
Crystals
Structures
1"
J.A. MARTIN-PEREDA, F.J. LOPEZ, and M.A. MURIEL
Departamento de Electronica Cuantica, £ T. S. ing. Telecomunicacion, Universidad Politecnica de Madrid, Ciudad Universitaria, Madrid-3, Spain
In this paper we report the experimental results obtained when an He-Ne laser beam crosses an MBBA homeotropic sandwich structure and is modulated by the influence of another laser beam, in our case an Ar+ laser, crossing through the same region. We extend some results
previously reported by us1 2 concerning the influence of the ratio of the diameters of the laser
beams on the modulation characteristics.
A theoretical model, based on the one reported in Ref6, shows good agreement with the
experimental results. If the Ar+ laser is intensity chopped, the resulting He-Ne diffracted
image is also intensity modulated. The highest frequency observed has been 500 p. p. s.
INTRODUCTION
It was recently established, both theoretically1 and experimentally,2'3'4 that
nematic liquid crystals can have large optical nonlinearities. This effect comes from the optical-field-induced, collective reorientation of mole-cules. A C. W. laser can be intense enough to yield a significant refractive index change in the medium.
Effects such as self-focusing and self-phase modulation have been the object of several papers treating nematic liquid crystals as non-linear mate-rials.5"9 Studies have shown that the intensity-dependent refractive index
associated with optically induced molecular reorientation in a typical ne-matic crystal, such asp-methoxybenzylidene-p'-n-butylaniline (MBBA), is
extremely large. Third-order nonlinear optical processes, such as degener-ate four-wave mixing and wave-front conjugation, are easily observable with lasers of moderate power (intensity of the order or 10 w/cm2).4 , 1 0 Two
groups have recently published their observation of optical-field-induced effects in the nematic phase. Because of the large nonlinearity, self-focusing of the laser beam in these experiments was observed.1 In every
case, the beam characteristics change drastically when the beams pass through even a thin sample of such materials. Some research has been done in this area. Shen et al.6 have reported the observation of a multiple-ring
pattern of laser diffraction from a nematic film. The phenomenon is shown to be the result of spatial, self-phase modulation that is due to the laser-induced Freedericksz transition. Moreover, it has been shown that the dynamic behavior of this optical-field-induced transition is also analogous to that of the magnetically induced case.5 The initial response of the
in-duced molecular reorientation to the laser switch-on and the larger time response to laser switch-off are both exponential with the relaxation times ro n and ro f f. The values given by Shen et al. working at an Ar+-laser
intensity of 350 w/cm2 are close to 100 sec, showing good agreement with
their theory. They used a He-Ne laser to prove the optical birefringence resulting from the induced molecular reorientation.
In this paper we extend some results reported elsewhere by us" 13
con-cerning qualitative and quantitative measurements of the optically induced modulation of a laser beam in nematic liquid crystal (N. L. C.) structures by another laser employed as a modulator.
EXPERIMENTAL
The experiment uses a C. W. Ar ion laser focused to an e~2 diameter of
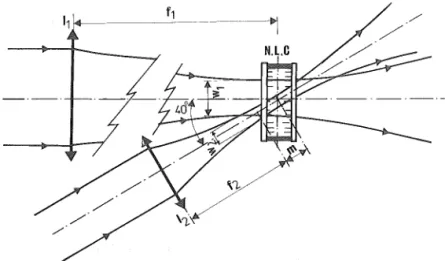
around 25 /xm at the homeotropically aligned cell depicted in Figure 1. A thin film of MBBA was employed as the nonlinear material. The optical propagation is at an angle of 0° with the liquid crystal molecular axis.
A second, He-Ne laser beam makes an angle of about 40° with respect to the Ar+ laser. Another lens was used to position this second laser beam
while controlling its spot size on the sample. The relative beam-diameters at the liquid-crystal cell are given by:
w/a — (/2A2h-i)/(/'iA1w1) + miirw^/ififiK) (1)
where /i and f2 are the focal lengths of the lenses focusing the Ar and the
He-Ne lasers, respectively, and m is the distance between the focus position of lens f2 and the middle of the liquid-crystal cell. Ai and A2 are the Ar+ and
FIGURE 1 Experimental set-up. NLC, homeotropic nematic liquid-crystal cell. Other sym-bols are defined in the text./, > /2.
In our experimental set-up, Eq. 1 is therefore
w/a = 0.5 + 3.45m (2) Both lasers, 5145 A and 6328 A He-Ne, are linearly polarized with the
same polarization direction, which is orthogonal to the plane containing both beams. The maximum output power for the Ar+ and He-Ne lasers was
25 and 1 mW, respectively.
The samples studied have a separation between plates smaller than 120 /xm. The homeotropic alignment was obtained by surface treatment using hexadecyltrimethyl ammonium bromide (HTAB). The experiments were carried out at room temperature (about 25°C), i.e., within the nematic range of MBBA.
We projected both laser beams onto the same screen, which was situated about 1 m from the nematic cell. A photodetector was placed at the middle of the He-Ne image to register the intensity variations.
When no Ar+ laser was applied to the liquid-crystal cell, the projected
He-Ne laser beam had the usual Gaussian intensity profile, as could be observed by a transverse displacement of the photodetector. The same situation was obtained when the Ar+ laser was turned on, as long as power
densities, on the cell, were smaller than threshold intensity (about 1 kW/cm2 depending upon sample thickness). Larger powers for the
Ar+ laser gave rise to self-focusing as had been shown by Khoo.1 The
divergence of the Ar+ beam after crossing the sample progressively
modulation of the laser owing to the birefringence of the tilted molecules. The appearance of these rings denotes that a large molecular reorientation has occurred.
If the focused He-Ne laser beam now crosses the self-focused zone, its focus being at a distance between 5 mm and 3 cm from the middle of the liquid crystal cell, a different intensity profile is obtained at the screen. If the He-Ne laser is not focused, after crossing the optically reoriented zone, a different intensity profile is observed, similar to the diffraction pattern of a circular black spot (in this case, another lens was placed behind the cell). Depending on the Ar+ laser intensity, different intensity profiles can be
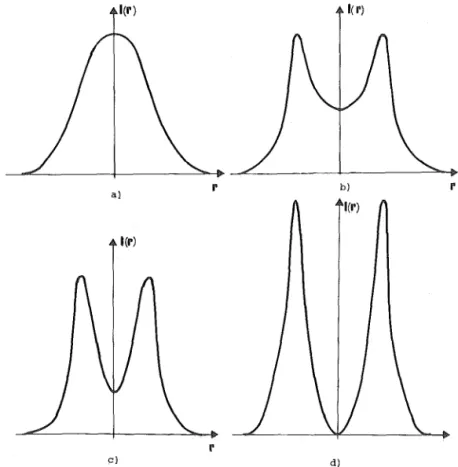
obtained for the focused He-Ne laser beam. The results are shown in Figure 2 where the intensity given by the photodetector is represented as a
FIGURE 2 Transverse profile of He-Ne beam at the screen, for increasing modulator optical intensity.
(a) /A r+ = 0
(b) /A r + = 1 -5/t h (C) /A r+ = 3/,h
function of the distance from the center of the diffraction figure. These graphics have been normalized and symmetrized to compensate for possi-ble photodetector misalignments. The first one (2a) corresponds to no Ar+ laser and gives the usual Gaussian profile. In the other three are
shown the results for increasing power in the Ar+ laser. As can be seen, the
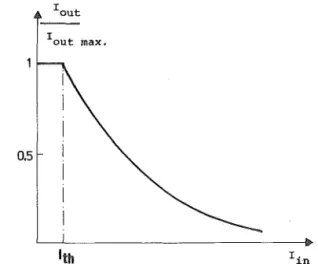
initial Gaussian profile no longer appears, and in the last case, a small bright ring appears around a dark center. In Figure 3, the variation of the light intensity in the center of the He-Ne laser is represented as a function of the Ar+ ion intensity.
When the Ar+ intensity reaches a value about 3 kW/cm2, rings such as
the ones reported by Shen appear in the Ar+ pattern. A similar effect occurs
with the He-Ne laser but with a much smaller contrast between maxima and minima. The same black dot remains at the center of the projected image. The energy has been transferred from the initial Gaussian profile to the surrounding ring.
THEORETICAL MODEL
An important point that needs to be considered is the relative size at the cell interaction zone of the two propagating laser beams. The phenomenon described above, i.e., a black spot at the center of the emerging He-Ne beam, appears at a given diameter ratio between the Ar+ and the He-Ne
beams. Other ratios give a different diffraction image. This result can be described by a model similar to the one employed previously6 to describe
FIGURE 3 Transference function of modulator systems. /o u t is measured at the center of the
the laser-induced diffraction rings from a N. L. C. film. We can describe both lasers, at entrance to the cell, by the following equations:
Es(p, 0) = E0 exp( ~ p2/ a2)
Ew(p, 0) = Ei e x p( - p2/ w2)
(3) (4) where a and w are the Ar+- and the He-Ne laser-waist radii respectively, as
before. Above a certain threshold, the Ar+-laser field Es will reorient the
direction of the molecular alignment through the medium. This leads to a local refractive-index change An(p) in the medium seen by both lasers
and to two corresponding phase shifts. The new refractive index will be given by
n(p) = no + n2El exp(-2p2/ a2) (5)
Therefore the He-Ne-laser beam suffers a phase retardation given by:
<Mp) = ^ n ( p ) a2 >Po + <MP)
with
<Ao = 2irdn0 and i/f! = (f>i exp( j , 2 p2'
(6)
(7) where d is the sample thickness and i//0 is the phase retardation with no
optical-induced reorientation of the molecular alignment.
The outgoing field for the He-Ne-laser beam after it crosses the liquid-crystal cell will be given, therefore by:
£w(p) l E0 exp
w • exp — i(f)i exp 2
p-+ c.c. (8)
Owning to the small diameter of the interaction zone, we can use the far field approximation (Fraunhofer) for cell-to-screen distances larger than several centimeters. The intensity on the screen will be:
/(r; a, w) = |F(r; </>;«; w)|2 (9)
where:
/o(2ot"p) dp (10)
F(r;<J>I\a,W) = 2TT pE0 e x p ^
w
exp -i<pi exp 2 ., , 2 p2
a
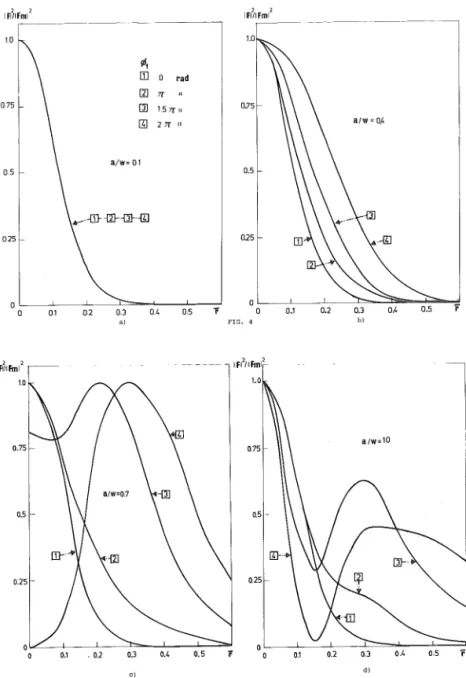
IFI/lFml2 FI/IFm
FIGURE 4 Calculated diffracted wave fields for the He-Ne laser, differenj. intensity values for the modulating Ar+ laser, and different relative spot diameters. 0, and r are defined in
TABLE I
Response times of the output signal as a function of Ar+-laser intensities,
sample thickness and focal distance of the Ar+ input chopped beam
d(fj. m) /(kW/cm2) T,(ms) T2(ms) /(L,)
125 3.26 28 24 7 cm
1.91 28 32
1.47 28 34
100 3.26 22 18
1.91 22 20
1.47 22 22
125 3.56 10 9 6.7 cm
2.09 10 11.5
1.35 10 12
100 3.56 8 7.5
2.09 8 8.2
1.35 8 8.6
F(r; 4>i, a/w) = e x p [i<f>if
•>0
2 ( o / w ) 2]-/o[rVln(l/r)]df (11)
where
r = 2irar
As can be seen this diffraction pattern does not depend upon a and w
independently, but upon the ratio, a/w.
Figure 4 is a plot of the numerical solution of Eq. 11 for several values of (f)i and a/w parameters.
This diffraction pattern is pictured in Figure 4 for w/a = 0.1, 0.4, 0.7,
and 1.0 and for different values of <f>i. In each case represented, the maximum value has an assigned value of unity.
DYNAMICAL BEHAVIOR OF THE SYSTEM
To observe the dynamical behavior of this phenomenon, a chopper was placed in the Ar+-laser beam before the beam crossed the liquid crystal
cell; a photodetector was situated at the center of the diffracted He-Ne-laser beam.
The main results are shown in Table I where response times of the output signal are given as a function of Ar+-laser intensities, sample thickness, and
focal distance of the Ar+ input-chopped beam (/j). Two response times
the turn off of the molecular. Orientation from these data, the cut-off frequency of the system will be around 25 p.p.s. This value is better than experimental results previously published by us.1 2 A further point needs to
be considered, namely, that lens focal distance has a greater importance than cell thickness.
CONCLUSIONS
We have shown that the optically induced modulation of a laser beam in N. L. C. structures by another beam laser, employed as a modulator, is possible. Some modifications concerning cell structure and focusing parameters need to be taken into account and will be published shortly.
Acknowledgment
We thank J.M. Oton for sample fabrication and MBBA synthesis. This work was partly supported by the Spanish "Comision Asesora de Investigation Cientffica y Tecnica" (Grant 3864-79).
References
1. I.e. Khoo, S.L. Zhuang and S. Shepard, Appl. Phys. Lett., 39, 937 (1981). 2. I. C. Khoo and S. L. Zhuang, Appl. Phys. Lett., 37, 3 (1980).
3. I.C. Khoo, Phys. Rev., A23, 2077 (1981). 4. I. C. Khoo, Phys. Rev., A2S, 1040, 1636 (1982).
5. S.D. Durbin, S.M. Arakelian and Y.R. Shen, Phys. Rev. Lett., 47, 1411 (1981). 6. S.D. Durbin, S.M. Arakelian and Y.R. Shen, Opt. Lett., 6, 411 (1981).
7. A. S. Zolot'ko, V. F. Kitaeva, N. Kroo, N. N. Sobolev and L. Csillag, JETP Lett., 32, 158 (1980).
8. B. Ya Zel'dovich, N. F. Pilipetskii, A. V. Sukhov and N. V. Tabiryan, JETP Lett., 31, 263 (1980).
9. N. Kroo, N. N. Sobolev and L. Chillag, JETP Lett., 32, 158, (1980). 10. R. M. Herman and R. I. Sherinko, Phys. Rev., A19, 1757 (1979).
11. I.A. Martin-Pereda and F.J. Lopez, in Digest of Conference on Lasers and Electro-Optics (Optical Society of America, Washington, D.C., 1982), paper WC14. 12. J. A. Martin-Pereda and F. J. Lopez, Opt. Lett., 7, 590 (1982).