Network-based biomarkers in Alzheimer’s disease: review
and future directions
Jaime Gomez-Ramirez1,2* and Jinglong Wu2
1Autonomous Systems Laboratory, Universidad Politécnica de Madrid, Madrid, Spain 2Biomedical Engineering Laboratory, Okayama University, Okayama, Japan
Edited by:
Manuel Menéndez-González, Hospital Álvarez-Buylla, Spain
Reviewed by:
Daniel Ortuño-Sahagun, Centro Universitario de Ciencias Biológicas y Agropecuarias, Mexico
Jose-Luis Gonzalez De Aguilar, University of Strasbourg, France
*Correspondence:
Jaime Gomez-Ramirez , Autonomous Systems Laboratory, Universidad Politécnica de Madrid, José Gutiérrez Abascal, 2 Madrid 28006, Spain e-mail: [email protected]
By 2050 it is estimated that the number of worldwide Alzheimer’s disease (AD) patients will quadruple from the current number of 36 million people. To date, no single test, prior to postmortem examination, can confirm that a person suffers from AD. Therefore, there is a strong need for accurate and sensitive tools for the early diagnoses of AD. The complex etiology and multiple pathogenesis of AD call for a system-level understanding of the cur-rently available biomarkers and the study of new biomarkers via network-based modeling of heterogeneous data types. In this review, we summarize recent research on the study of AD as a connectivity syndrome. We argue that a network-based approach in biomarker dis-covery will provide key insights to fully understand the network degeneration hypothesis (disease starts in specific network areas and progressively spreads to connected areas of the initial loci-networks) with a potential impact for early diagnosis and disease-modifying treatments. We introduce a new framework for the quantitative study of biomarkers that can help shorten the transition between academic research and clinical diagnosis in AD.
Keywords: Alzheimer’s disease, network degeneration hypothesis, network-based biomarkers, default-mode network DMN, resting-state functional connectivity
INTRODUCTION
A biomarker is a parameter that can be used as an indicator of normal biological processes, pathogenic processes, or pharmaco-logical responses to therapeutic drugs (Biomarkers Definitions Working Group, 2001). In Alzheimer’s disease (AD), potential biomarker information comes from multiple sources, including clinical tests for memory impairment, bodily fluid or tissues, neuroimaging, and smell tests among others. AD biomarkers are typically assumed to belong to the following two categories:
biofluid analytes, e.g., cerebrospinal fluid (CSF), peripheral blood samples such as urine andimaging measures, e.g., magnetic reso-nance imaging (MRI), magnetic resoreso-nance spectroscopy (MRS), or positron emission tomography (PET) (Henriksen et al., 2014). At present there are five well-established AD biomarkers: two are CSF analytes that measure abnormal protein aggregates – low level of CSF amyloid-beta and elevated level of both total and phosphorylated CSF tau protein; and three imaging biomark-ers – the Pittsburgh compound-B PIB PET tracer for amyloid-beta deposition, for which MRI scans may detect atrophied sensible brain areas; and Fludeoxyglucose FDG PET to quantify abnormal neuronal glucose consumption (Jack, 2012).
The diagnostic criteria for AD has not been modified since its original formulation in 1984 until it was recently updated in 2010 (Dubois et al., 2010). In the original criteria, AD was strictly diag-nosed on a clinical basis (McKhann et al., 1984). Other sources of information such as imaging lacked a positive diagnostic role. New diagnostic criteria reckons AD as a complex disorder char-acterized by a gradual and progressive pathogenesis, with three phases – preclinical or asymptomatic, prodromal or mild cognitive impairment (MCI), and overt dementia (Dubois et al., 2007;Albert
et al., 2011;Sperling, 2011). Despite technological and conceptual advances in AD, we are still lacking preventive therapies to delay the onset of AD as well as disease-modifying treatments. Despite the strong need for early diagnose of AD, and the fact that bio-markers have proved useful in correlating with the different stages in which the disease unfolds, CSF and imaging biomarkers still play a surprisingly minor role in clinical diagnosis. They are, however, increasingly prominent in clinical trials and academic research.
In this review, we provide a brief panoramic view on recent research on the discovery of AD biomarkers, putting special emphasis on neuroimaging biomarkers derived from functional connectivity data in resting state, that is, the subject is not perform-ing an explicit task. Network-based biomarkers are introduced, and we provide a new framework for the quantitative study of biomarkers that can help shorten the transition between academic research and clinical diagnosis in AD.
AD BIOMARKERS
Clinical tests for AD diagnosis involve subjective reasoning by experienced practitioners. Episodic memory impairment has lit-tle or no relevance in early diagnosis, but it still remains the core diagnostic criterion. Current diagnostic criteria (DSM-IV and NINCDS-ADRDA) have high sensitivity but low specificity (Knopman et al., 2001). The delay from symptoms to diagnosis is 20 months on average in the EU, and 36 months in the UK ( Mat-tila et al., 2012). Furthermore, molecular pathomechanisms of AD become active for several years before symptoms such as cognitive impairment manifests itself.
Blood samples are a non-invasive and cost-effective technique for the identification of plasma biomarkers that has proven use-ful in distinguishing individuals with AD from cognitively healthy control subjects (Doecke et al., 2012). Plasma biomarkers can be used to extract metabolomics (Trushina et al., 2013) and pro-teomics biomarker signatures in AD (Hye et al., 2006). Contrary to diagnostic tools like CSF and PET, plasma amyloid-beta mea-surements are neither invasive nor expensive. Plasma Aβ40 and Aβ42 can be measured in peripheral blood, but they cannot be used in AD identification.Vanderstichele et al. (2000)found no differences in Aβ42 levels between controls and patients with AD. Further work is required before plasma amyloid-beta measure-ments are unanimously regarded as clinically useful (Mayeux and Schupf, 2011;Toledo et al., 2013).
Using Smell tests to detect hyposmia is another example of inexpensive biomarker in AD (Kjelvik et al., 2007). However, the reduced capability to detect odors shown in AD may be more an effect of the cognitive decline characteristic of the disease than a symptom with predictive value (Serby et al., 1991).
Neuroimaging biomarkers in AD measure brain signals at both mesoscopic (MRI) and macroscopic scales (fMRI, MRS, and PET). Morphometric analysis with MRI data (e.g., atrophy in medial temporal lobes, specifically in the hippocampus and entorhinal cortex) is a well-known marker of disease progression in AD. Hip-pocampus atrophy correlates with neuronal loss and therefore MRI biomarkers could be used in proof-of-the-concept stud-ies to distinguish between disease-modifying and symptomatic treatment effects (Saumier et al., 2009; Hampel et al., 2011). PET neuroimaging allows us to collect molecular information. PET image analysis can provide evidence of the accumulation of amyloid-beta plaques that is independent from structural brain changes. It also provides evidence of a reduction of glucose metab-olism in the parietal and temporal lobe regions that are involved in memory and executive function (Habeck et al., 2012). Both structural MRI and FDG-PET imaging reflect the effects of the disease progress in symptomatic stages, however it is the diagnosis in AD’s asymptomatic stages that remains to be solved. Molecular
pathomechanisms, such as the accumulation of amyloid plaque, become active several years before cognitive deficit manifest. Fur-thermore, amyloid-beta is not specific to AD, but may also be found in normal aging.
RESTING-STATE fMRI
Functional magnetic resonance imaging allows us to assess func-tional connectivity mapping at high temporal resolution by means of correlations in the blood-oxygen-level-dependent (BOLD) sig-nal in spatially distant brain regions. Since the semisig-nal work of Biswal (Biswal et al., 1995), task-free or resting-state fMRI (R-fMRI) has been successfully incorporated into the functional MRI imaging repertoire, and represents a comprehensive alternative to the task-based approach. R-fMRI experiments are consider-ably less demanding for the subject, which makes this technique especially attractive to brain dementia researchers, as it is rela-tively free of subject compliance and training demands. R-fMRI measures the spontaneous or intrinsic brain activity in terms of low-frequency (<0.1 Hz) BOLD fluctuations. Fluctuations in the BOLD signal measured in humans in resting state represent the neuronal activity baseline and shape spatially consistent patterns (Fransson, 2005;Raichle and Gusnard, 2005). The systematic study of those patterns using correlation analysis techniques has iden-tified a number of resting-state networks, which are functionally relevant networks found in subjects in the absence of either goal directed-task or external stimuli. Despite the variability in the data acquisition protocols, statistical data analysis, and groups of subjects employed, resting-state networks have been consistently reported in multiple studies. There are at least eight commonly identified resting-state networks: the primary sensorimotor net-work, the primary visual and extra-striate visual netnet-work, bilateral temporal/insular, and anterior cingulate cortex regions, left and right lateralized networks consisting of superior parietal and supe-rior frontal regions, and the default-mode network (DMN) (Van den Heuvel and Hulshoff Pol, 2010).
The DMN is a specific anatomically defined brain system that is preferentially active when individuals are focused on introspec-tive activities such as autobiographical memory retrieval, rather than on the external environment (Buckner et al., 2008). A num-ber of studies indicate that the default network is also relevant for understanding mental disorders including depression (Sheline et al., 2009), autism (Washington et al., 2013), and AD. Studies show a decrease in DMN functional connectivity in normal aging, MCI and AD (Hafkemeijer et al., 2012). Functional connectivity of the DMN may prove to be a sensitive and specific biomarker for mild AD (Greicius et al., 2004;Balthazar et al., 2014).
other signal variations, resulting in a collection of spatial maps, one for each independent component, that represent functionally relevant networks in the brain. While ICA has an advantage over model-free methods that it is unbiased, that is, it does not need to posit a specific temporal model of correlation between regions of interest (ROI), the functional relevance of the different compo-nents is still computed relative to their resemblance to a number of networks based on criteria that are not easily formalized (Friston, 1998). More recently researchers using graph-theory based meth-ods have been able to not only visualize brain networks, but also to quantify their topological properties as well (He et al., 2009;
Wang et al., 2010). Graph-theory provides a formal and rigorous framework to quantitatively analyze the connectivity pattern, at either a local or global level, underlying cognitive networks. How these network properties are modified during normal develop-ment, aging, or pathological conditions is addressed in the next section.
R-fMRI AND AD
Altered resting-state functional connectivity patterns have been shown in an impressive range of pathologies and conditions – AD, schizophrenia, multiple sclerosis, Parkinson’s disease, depression, autism, and attention deficit/hyperactivity disorder – see (Lee et al., 2013) for a review on clinical applications. In the context of AD, both amyloid-beta and tau pathologies affect DMN integrity before the clinical onset of the disease (Li et al., 2013; Wang et al., 2013). DMN regions such as the precuneus and the poste-rior cingulate are selectively vulnerable to amyloid-beta deposition (Sperling et al., 2010). AD weakens structural and functional con-nectivity between the cingulate cortex and other regions within the DMN, which is consistent with the reduction in metabolic activity and atrophy observed with FDP-PET and volumetric MRI, respec-tively within the DMN (Zhu et al., 2013). Patients with severe AD show decreased connectivity between distant brain regions (Liu et al., 2013). Interest in understanding the pathomechanisms of tau-mediated neurodegeneration has been fostered by the failure of amyloid-beta therapies to prevent neurodegeneration by Aβ removal. Tau abnormalities have been found to be more closely related to cognitive dysfunction than Aβ(Yoshiyama et al., 2012). Tau deposition is initially located in the medio-temporal lobe to spread later to lateral temporal and frontal parietal areas. This orderly progression found in hypophosphorylated tau maps the regional specificity in the deployment of symptoms in AD, i.e., episodic memory loss in the MTL is followed by semantic mem-ory loss in lateral temporal cortex to aphasic symptoms in parietal cortex (Pievani et al., 2011).
Functional imaging has been successfully used in population selection in cross-sectional studies to classify between normally aging, MCI, and AD subjects (Rombouts et al., 2005; Damoi-seaux, 2012). R-fMRI can be also used to track AD progression in longitudinal studies. For example, inDamoiseaux et al. (2012)
it is shown that functional connectivity in default-mode subnet-works decreases in AD patients compared to healthy controls. Resting-state functional connectivity can help detect early mani-festations of genetic effects related to AD. For instance, in (Sheline et al., 2010) cognitive normal individuals were categorized into PIB−(no evidence of brain amyloid) and PIB+(PET evidence
of amyloid deposition) and compared with AD patients using resting-state functional connectivity. The study showed that the PIB+and AD groups share similar modifications in both
func-tional and effective connectivity. Thus, R-fMRI can be used to detect early manifestations of genetic effect, e.g., amyloid deposi-tion in APOE4 carriers, and therefore holds great potential in early diagnosis and disease-modifying strategies. It goes without saying that like any technique, R-fMRI has advantages and disadvantages. fMRI measures the BOLD signal, which is an indirect measure of neural activity and it is susceptible to several imaging artifacts and has, in general, worse temporal resolution than EEG and MEG, and spatial resolution that is not as good as more invasive procedures such as single-unit electrodes. The analysis and interpretation of R-fMRI data is particularly challenging, and further work is still required to address complex issues like network identification, effective connectivity between brain networks, detecting AD risk groups, etc. For a review on the progress and pending problems of statistical approaches to analyzing R-fMRI, seeCole et al. (2010).
NETWORK-BASED BIOMARKERS
Contrary to other conditions such as brain injury whose onset can be tracked both in location and time, late sporadic AD – the most common form of dementia and two orders of magnitude more frequent than inherited AD (Bateman et al., 2012) – has a gradual onset that lacks a specific location or temporal window. Experimental studies based on neuropathology, neuroimaging, and transgenic animal models suggest that neurodegeneration relates to neural network dysfunction. Disease-vulnerable intrin-sic functional networks are not diffuse or random (Sanz-Arigita et al., 2010), however, researchers are still uncertain about the spe-cific way in which neurodegeneration spreads beyond the sites of initial impairment. The network degeneration hypothesis ( See-ley et al., 2009) – disease starts in small network assemblies, to progressively spread to connected areas of the initial locus – sup-ports the view that neurodegenerative disorders can be study as connectivity disorders. In this light, AD can be understood as a disconnection syndrome in which the structural and functional connectivity of large-scale networks is progressively modified by molecular pathomechanisms that are not fully understood.
A diagnostic biomarker, in order to be considered as such, should reflect a core pathogenic process. The established bio-markers in AD hold this promise as they measure, for example, amyloid-beta and tau deposition levels, which are responsible for the formation of senile plaques and neurofibrillary tangles. However, it is far from clear whether amyloid and tau deposi-tion are etiologically linked to memory deficits or they rather reflect secondary effects of a different pathogenic mechanism (Eidelberg and Martin, 2013). AD is a complex and multifactorial condition and so “secondary processes” such as oxidative stress, immune responses, or inflammation and how they interact with core pathogenic mechanisms need to be properly understood.
rationale behind this idea is that biomarker discovery needs to take into account the network state and the biological context in which the network evolves, rather than focus on individual nodes or events, e.g., phosphorylation. A network-based approach for biomarker discovery is also being fostered in complex diseases such as cancer and diabetes (Ahn et al., 2006).
The multifactorial pathogenesis of complex diseases such as AD is at odds with the current implementation of biomarkers which are single-dimensional. Thus, we propose to redefine biomarker as
a network model that can be used as an indicator of normal (including adaptive) biological processes,pathogenic processes,or pharmacologi-cal responses to therapeutic drugs. Under this definition, biomarkers are multidimensional, as they are embedded into a network model in which network parameters, that represent normal or patholog-ical processes but also adaptive responses, can be characterized. This new definition of biomarker allows us to quantify adap-tive processes triggered by early pathogenic events, fostering an integrative and multidimensional approach of use in AD early diagnose. For example, it is unclear if, as the disease progresses, functional connectivity in large neural systems is attenuated, e.g., in the DMN (Wu et al., 2011;Liu et al., 2013;Zhu et al., 2013) or on the contrary, AD may induce an increase in functional connectivity that compensates for the disease related atrophy of affected regions (Sanz-Arigita et al., 2010). An increase in focal frontal connectivity and heightened hippocampal activation during early stages of AD has been reported inDickerson et al. (2004). Functional disruption has been observed in the prodromal stage or even earlier and there-fore a characterization of this imaging phenotype has potential impact in early prevention and disease-modifying therapies. The relationship between brain development, aging and disease and brain connectivity is not univocal, but instead involves a number of complex mechanisms that alter the network topology in multiple ways. The mechanisms that mediate in the increase in functional connectivity observed in prodromal AD are in dispute. There are several potential explanations for this phenomenon. For example, the increase in connectivity in the early phases of AD could reflect compensatory effects to neutralize the disruption in functional integrity, or represent some form of glutamate receptor-mediated excitotoxicity (Wu et al., 1995). An interesting hypothesis bor-rowed from economic theory is that early network alterations can be interpreted as a discount factor that anticipates the expectation of pending functional network integrity deterioration.
Combining existing biomarkers poses important challenges not only in terms of intelligibility due to the heterogeneous and com-plex nature of biomarker data, but also in terms of cost of data extraction, e.g., expensive SPECT or MRI can not be used in sub-jects with metal implants, and genetic mutations account for only a small percentage of AD cases (Bertram and Tanzi, 2004). Truly predictive models of disease progression need to take into account the combined effects of biomarkers interactions at the individ-ual subject level. Few studies however, have specifically addressed the issue of the integration of different biomarkers (Gomar et al., 2011). The long sought goal of early diagnosis of AD necessarily passes by the integration of existing biomarkers and the discov-ery of new ones. Network-based biomarkers provide a unifying approach for AD biomarker discovery and testing. Graph-based network analysis allows to quantitatively characterize the global
organization of the brain and to integrate heterogeneous data in a “neutral” and general mathematical body.
A NETWORK-BASED APPROACH IN AD BIOMARKERS
Biomarkers can be compounds obtained from bodily fluids or tissues, or technically derived correlates of pathophysiological events. While three of the five most important AD biomarkers are imaging-based, functional neuroimaging is absent in current diagnostic criteria.
Markers of alterations in resting-state functional connectiv-ity networks can discriminate between AD patients and healthy elderly people with a satisfactory level of sensitivity and specificity. Functional connectivity analysis of the DMN has great potential as network biomarker able to objectively quantify asymptomatic and prodromal stages of the disease and as secondary endpoint in multicenter clinical trials in AD (Chhatwal et al., 2013). The study of AD biomarkers with R-fMRI imaging, however, has focused on detecting alterations in specific networks such as the DMN and finding abnormal levels of protein deposition, metabolic disrup-tion, and atrophy within the DMN. A system-level understanding of the dependencies that exist among the different biomarkers has not been achieved. The advent of “Big Data” science makes it possible to share large amount of data with unprecedented pro-cessing capability. The Alzheimer’s disease neuroimaging initiative (ADNI) makes access to clinical imaging and biomarker data freely available to researchers worldwide. The whole genome sequences of the 800 individuals enrolled in the ADNI will be soon available through the Global Alzheimer’s Association Interactive Network (GAAIN).
The much-needed insight into the pathomechanisms that mediate in AD will benefit from the construction of probabilistic networks from large databases of AD biomarkers that systemat-ically capture the probabilistic dependencies among biomarkers. Once the network or networks are built, a supervised classification algorithm can be used to classify new subjects within different classes, for example healthy and AD. Thus, in a training set of patients diagnosed as healthy or AD, we first build the generative graphs –MHandMAD– containing biomarker dependencies of
healthy and AD subjects, respectively, to later perform a classifi-cation inference, that is, estimate the likelihood thatMHorMAD
has generated new data, i.e., a new subject to be diagnosed. Let us see this with an example.Figure 1shows a classification procedure for AD using a biomarker network-based approach. BM is a list of AD biomarkers considered in this example, BM=(w, o,τ, aβ, hc, fc, tac). For convenience, we assume that BM takes discrete values, that is, BMi=1 when biomarker i reaches the
FIGURE 1 | Seven biomarkers of interest are listed in BM. For
convenience, we assume that BM is a binary vector, that is, BM(i)=0,1. For example, if the measurement of the biomarker Word recognition reaches the positive threshold BM(1)=1, if not, BM(1)=0. The table in the top of the figure shows the training set S consisting ofnsamples or subjects with their biomarkers BM, and diagnosed as AD or healthy. The data in the table can be summarized via the construction of generative networks, one for each
diagnostic category, in our example H and AD. There is a number of possible network structures that can characterize the training set, so the generative networksMHandMADare the result of model selection. The diagnosis of new patients can be thus be addressed via the computation of the probability that the new data, BMsis generated by the biomarker network that captures the dependencies among biomarkers in healthy subjects or by the biomarker network of healthy subjects.
of cognitive and motor decline of interest in AD found in our lab-oratory (Yang et al., 2010). This list of biomarkers can be extended with others, e.g., smell, epigenetic, blood, genetic, etc., with the caveat that a large number of parameters need even larger data sets in order to avoid having an overwhelming choice of networks that are potentially good at explaining the data.
The training data setSis ideally composed of a large number of diagnosed subjects with the BM vector of biomarker informa-tion for each one. Thus, the training set is given byS=[(BM1,
y)(BM2,y),. . .(BMn,y)], where BMiis the vector containing the
biomarkers measured in patient i, and y represents the diag-nostic class in which a subject can be classified, e.g., Healthy or AD. Now, we want to build a probabilistic network that captures dependencies among the biomarkers for each diagnostic class. For example, if the training data set contains biomarker information of n subjects diagnosed as healthy or AD [y=(yH,yAD)], two
generative biomarker networks –MHandMAD– need to be built.
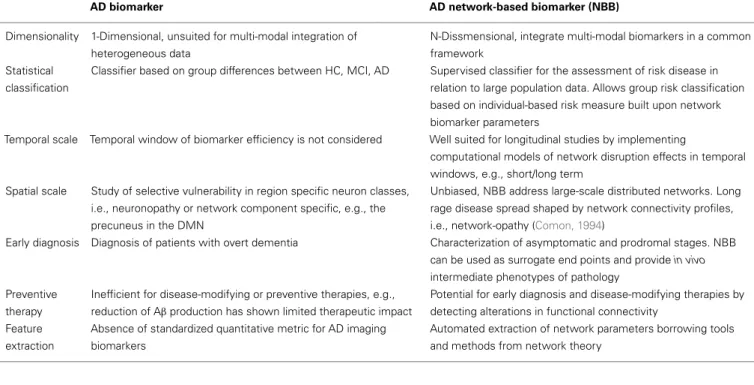
Table 1 | Differences between the standard and the network-based AD biomarker approaches.
AD biomarker AD network-based biomarker (NBB)
Dimensionality 1-Dimensional, unsuited for multi-modal integration of
heterogeneous data
N-Dissmensional, integrate multi-modal biomarkers in a common
framework
Statistical
classification
Classifier based on group differences between HC, MCI, AD Supervised classifier for the assessment of risk disease in
relation to large population data. Allows group risk classification
based on individual-based risk measure built upon network
biomarker parameters
Temporal scale Temporal window of biomarker efficiency is not considered Well suited for longitudinal studies by implementing
computational models of network disruption effects in temporal
windows, e.g., short/long term
Spatial scale Study of selective vulnerability in region specific neuron classes,
i.e., neuronopathy or network component specific, e.g., the
precuneus in the DMN
Unbiased, NBB address large-scale distributed networks. Long
rage disease spread shaped by network connectivity profiles,
i.e., network-opathy (Comon, 1994)
Early diagnosis Diagnosis of patients with overt dementia Characterization of asymptomatic and prodromal stages. NBB
can be used as surrogate end points and providein vivo
intermediate phenotypes of pathology
Preventive
therapy
Inefficient for disease-modifying or preventive therapies, e.g.,
reduction of Aβproduction has shown limited therapeutic impact
Potential for early diagnosis and disease-modifying therapies by
detecting alterations in functional connectivity
Feature
extraction
Absence of standardized quantitative metric for AD imaging
biomarkers
Automated extraction of network parameters borrowing tools
and methods from network theory
studies, summarized above, that treat biomarkers as quantities that reflect relevant biological processes whose correlations with other biomarkers need to be investigated through heuristics meth-ods (Table 1). An interesting improvement in the quantification and integration of AD biomarkers aiming to improve the effi-ciency and of AD diagnosis can be found inMattila et al. (2011). A supervised classifier is implemented via a disease state index (DSI) that compares the biomarker measurements of new patients with previously diagnosed patients’ biomarkers. Thus, the DSI is an aggregate measure of a number of biomarkers that allows us to classify based on biomarker data.
Our network-based approach in AD biomarkers differs from these approaches in that biomarkers are here characterized as structured objects, i.e., networks, in which the dependencies among the network components, i.e., individual biomarkers, need to be quantified via experimentation or computational simula-tion of the network dynamics. For a training set of diagnosed biomarker data, the computation of the generative biomarker network for each diagnostic class, e.g.,MH,MAD is a network
structure discovery problem. The idea is to provide a structural model, i.e., a network of the training data set, i.e., biomarker data. For example, for a training data set of patients diagnosed into the categories healthy and AD, two networks –MH,MAD – are
built. The nodes represent the random variables of the training set (biomarkers) and the edges represent the stochastic dependency between these variables. Dependency structures can be analyzed using Bayesian network models (Buntine, 1996). In the context of AD biomarkers, the network represents the dependency struc-ture of the underlying distribution of any two biomarkers. For example, inFigure 1, the generative networkMH, which
con-tains a structural representation of the biomarkers dependencies in the subjects diagnosed as healthy, shows no dependency among
biomarkers and only one biomarker, amyloid-beta deposition, reaches the threshold of positivity. In theMADnetwork, the
gen-erative matrix of patients diagnosed as AD, we find stochastic dependency between all pairs of biomarkers except in fMRI and tactile.
The identification of the generative modelsMHandMADfrom
data is the result of statistical learning followed by model selec-tion. It ought to be noted that when the amount of data – the number of diagnosed individuals – is small compared to the size of the model – the number of biomarkers – there are likely many candidate models that explain the data, and therefore the gen-erative model provided by model selection may not be a good approximation of the underlying process. On the other hand, model selection is more likely to provide a good approximation when a large amount of data is available in models with a rel-atively small number of parameters. The number of candidate networks is super exponential of the number of model parame-ters, therefore small size models relative to the large data sample are preferable. For a discussion of thep,n(p=model size,n=data size) problem in statistics, seeGomez-Ramirez and Sanz (2013). The diagnosis of a new subject can be computed via the maxi-mum probability of the biomarker configuration BMsconditional
to the generative models, MH and MAD, maxG=(MH, MAD)
P(BMs|G).
Conceptually, the work flow for the implementation of decision models based on the theoretical framework described here can be divided into three phases: (1) data extraction for biomarker selec-tion, (2) network-based model building, and (3) model valida-tion using classificavalida-tion algorithms. The first phase is intrinsically hypothesis driven. Quantities susceptible to work as biomarkers are selected experimentally or via public repositories such as the ADNI initiative. In the second phase, the interdependencies among biomarkers are studied quantitatively. The idea is to understand how the different biomarkers act together within a network model that can be further characterized in terms of network parameters such as clustering or modularity. As a result, generative models of diagnostic categories, e.g.,MHandMADare built. In the last step,
new subjects can be diagnosed via the maximum probability of the biomarker configuration for a new subject s (BMs) conditional to
the generative models, maxG=(MH,MAD) P(BMs|G). Thus, in
essence, this approach can be seen as a supervised classifier that allows us to assess the clinical value of the network models built upon heterogeneous and structured biomarker data. It ought to be remarked that the Bayes’ theorem allows us to calculate the pos-terior probability P(G|BMs) or the updating of probabilities from
an experiment that results in the biomarker values BMs.
Gener-ally speaking, by increasing the sample size it is possible to reduce the importance of the prior distribution, P(G), which is partic-ularly difficult to specify, and represents the uncertainty about the network structure before the data are examined (Migon and Gamerman, 1999).
CONCLUSION
The network-based biomarker approach described here is in com-pliance with the new emerging paradigm of network medicine (Barabási et al., 2011). In this respect, network medicine, in order to be successful, must offer healthcare professionals not only a conceptual framework, but also comprehensive methodologies and a practical toolkit able to address the challenges and limi-tations in AD biomarkers research in new ways. New classification methods, such as support vector machine (SVM), have proven to be effective for the identification of MCIs from normal aging using resting-state functional connectivity data (Wee et al., 2012). Bayesian network analysis of effective connectivity show differ-ences in the DMN between AD and healthy controls and could be used in the future as a biomarker (Wu et al., 2011).
The development of efficient tools for use in clinical diagnosis and monitoring of disease progress require the improved use of already known biomarkers and new methods of biomarkers dis-covery. There is a strong need for objective- and quantitative-based biomarkers of use in asymptomatic and prodromal stages of AD. The systemic understanding of the interactions between biomark-ers can be seen as statistical learning followed by a model selection problem. The inclusion of functional imaging biomarkers in the clinical diagnoses of AD necessarily passes over the standardization of imaging protocols and quantitative metrics. In this respect, the network-based biomarkers approach presented here goes beyond the current emphasis on the study of the relationship between specific networks (e.g., DMN) and molecular biomarkers (e.g., amyloid-beta) to learn dependencies between biomarkers from heterogeneous data implemented as a graph, where the nodes
are biomarkers and the edges represent the stochastic dependency among the biomarkers.
There are, however, challenges that are not addressed here. For example, the review has focused on the integration of predeter-mined biomarkers, but biomarker selection is a standing prob-lem in AD research. Non-linear relationships between biomarker measurements and disease severity, and handling sparse obser-vations constrain biomarker prediction. Alterations in functional connectivity may play a key role in detecting signatures in pre-symptomatic and prodromal stages. However, functional imaging related biomarkers have so far focused on alterations in intrinsic connectivity networks and the co-occurrence of protein deposi-tion within those networks. Quantified and standardized metrics for AD neuroimaging biomarkers and a system-level understand-ing of the dependencies among the existunderstand-ing biomarkers are still missing. The network-based approach introduced here aims to bridge this gap by providing a statistical framework able to learn structural representations of biomarkers interactions from bio-marker data of previously diagnosed patients. To fully capitalize on the large amount of data that big data science projects are bringing to AD research, a new mathematical framework for find-ing effective combinations of multi-modal biomarkers is sorely required. Biomarkers deployed as network models rather than as quantities will foster our understanding of disease, paving the way for a predictive, preventive, and personalized medicine.
ACKNOWLEDGMENTS
This work has been funded in part with funds from the Eras-mus Mundus Building European Asian Mobility Program of the European Commission (EM-BEAM), Grant Number L03100048.
REFERENCES
Ahn, A. C., Tewari, M., Poon, C.-S., and Phillips, R. S. (2006). The limits of reduction-ism in medicine: could systems biology offer an alternative?PLoS Med.3:e208. doi:10.1371/journal.pmed.0030208
Albert, M. S., DeKosky, S. T., Dickson, D., Dubois, B., Feldman, H. H., Fox, N. C., et al. (2011). The diagnosis of mild cognitive impairment due to Alzheimer’s dis-ease: recommendations from the National Institute on Aging-Alzheimer’s Asso-ciation workgroups on diagnostic guidelines for Alzheimer’s disease.Alzheimers Dement.7, 270–279. doi:10.1016/j.jalz.2011.03.008
Balthazar, M. L. F., De Campos, B. M., Franco, A. R., Damasceno, B. P., and Cendes, F. (2014). Whole cortical and default mode network mean functional connectivity as potential biomarkers for mild Alzheimer’s disease.Psychiatry Res.221, 37–42. doi:10.1016/j.pscychresns.2013.10.010
Barabási, A.-L., Gulbahce, N., and Loscalzo, J. (2011). Network medicine: a network-based approach to human disease.Nat. Rev. Genet.12, 56–68. doi:10.1038/ nrg2918
Bateman, R. J., Xiong, C., Benzinger, T. L. S., Fagan, A. M., Goate, A., Fox, N. C., et al. (2012). Clinical and biomarker changes in dominantly inherited Alzheimer’s dis-ease.N. Engl. J. Med.367, 795–804. doi:10.1056/NEJMoa1202753
Bertram, L., and Tanzi, R. E. (2004). The current status of Alzheimer’s dis-ease genetics: what do we tell the patients? Pharmacol. Res.50, 385–396. doi:10.1016/j.phrs.2003.11.018
Biomarkers Definitions Working Group. (2001). Biomarkers and surrogate end-points: preferred definitions and conceptual framework.Clin. Pharmacol. Ther. 69, 89–95. doi:10.1067/mcp.2001.113989
Biswal, B., Yetkin, F. Z., Haughton, V. M., and Hyde, J. S. (1995). Functional connec-tivity in the motor cortex of resting human brain using echo-planar MRI.Magn. Reson. Med.34, 537–541. doi:10.1002/mrm.1910340409
Buckner, R. L., Andrews-Hanna, J. R., and Schacter, D. L. (2008). The brain’s default network.Ann. N. Y. Acad. Sci.1124, 1–38. doi:10.1196/annals.1440.011 Buntine, W. L. (1996). A guide to the literature on learning probabilistic networks
Chhatwal, J. P., Schultz, A. P., Johnson, K., Benzinger, T. L. S., Jack, C., Ances, B. M., et al. (2013). Impaired default network functional connectivity in autoso-mal dominant Alzheimer disease.Neurology 81, 736–744. doi:10.1212/WNL. 0b013e3182a1aafe
Cole, D. M., Smith, S. M., and Beckmann, C. F. (2010). Advances and pitfalls in the analysis and interpretation of resting-state FMRI data.Front. Syst. Neu-rosci.4. Available at: http://www.ncbi.nlm.nih.gov/pmc/articles/PMC2854531/ doi:10.3389/fnsys.2010.00008
Comon, P. (1994). Independent component analysis, a new concept?Signal Process-ing36, 287–314. doi:10.1016/0165-1684(94)90029-9
Corbett, A., and Ballard, C. (2012). New and emerging treatments for Alzheimer’s disease.Expert Opin. Emerg. Drugs 17, 147–156. doi:10.1517/14728214.2012. 675327
Damoiseaux, J. S. (2012). Resting-state fMRI as a biomarker for Alzheimer’s disease? Alzheimers Res. Ther.4, 8. doi:10.1186/alzrt106
Damoiseaux, J. S., Prater, K. E., Miller, B. L., and Greicius, M. D. (2012). Functional connectivity tracks clinical deterioration in Alzheimer’s disease.Neurobiol. Aging 33, 828.e19–.e30. doi:10.1016/j.neurobiolaging.2011.06.024
Dickerson, B. C., Salat, D. H., Bates, J. F., Atiya, M., Killiany, R. J., Greve, D. N., et al. (2004). Medial temporal lobe function and structure in mild cognitive impairment.Ann. Neurol.56, 27–35. doi:10.1002/ana.20163
Doecke, J. D., Laws, S. M., Faux, N. G., Wilson, W., Burnham, S. C., Lam, C.-P., et al. (2012). Blood-based protein biomarkers for diagnosis of Alzheimer disease.Arch. Neurol.69, 1318–1325. doi:10.1001/archneurol.2012.1282
Dubois, B., Feldman, H. H., Jacova, C., Cummings, J. L., Dekosky, S. T., Barberger-Gateau, P., et al. (2010). Revising the definition of Alzheimer’s disease: a new lexicon.Lancet Neurol.9, 1118–1127. doi:10.1016/S1474-4422(10)70223-4 Dubois, B., Feldman, H. H., Jacova, C., Dekosky, S. T., Barberger-Gateau, P.,
Cummings, J., et al. (2007). Research criteria for the diagnosis of Alzheimer’s disease: revising the NINCDS-ADRDA criteria. Lancet Neurol.6, 734–746. doi:10.1016/S1474-4422(07)70178-3
Eidelberg, D., and Martin, W. (2013). Differentβ-amyloid binding patterns in Alzheimer and Parkinson diseases: it’s the network!Neurology 81, 516–517. doi:10.1212/WNL.0b013e31829e703e
Erler, J. T., and Linding, R. (2010). Network-based drugs and biomarkers.J. Pathol. 220, 290–296. doi:10.1002/path.2646
Faria, A. V., Joel, S. E., Zhang, Y., Oishi, K., Van Zjil, P. C. M., Miller, M. I., et al. (2012). Atlas-based analysis of resting-state functional connectivity: evaluation for reproducibility and multi-modal anatomy-function correlation studies. Neu-roimage61, 613–621. doi:10.1016/j.neuroimage.2012.03.078
Fransson, P. (2005). Spontaneous low-frequency BOLD signal fluctuations: an fMRI investigation of the resting-state default mode of brain function hypothesis. Hum. Brain Mapp.26, 15–29. doi:10.1002/hbm.20113
Friston, K. J. (1998). Modes or models: a critique on independent component analysis for fMRI.Trends Cogn. Sci. (Regul. Ed.)2, 373–375. doi:10.1016/S1364-6613(98)01227-3
Gomar, J. J., Bobes-Bascaran, M. T., Conejero-Goldberg, C., Davies, P., Goldberg, T. E., and Alzheimer’s Disease Neuroimaging Initiative. (2011). Utility of com-binations of biomarkers, cognitive markers, and risk factors to predict conver-sion from mild cognitive impairment to Alzheimer disease in patients in the Alzheimer’s disease neuroimaging initiative.Arch. Gen. Psychiatry68, 961–969. doi:10.1001/archgenpsychiatry.2011.96
Gomez-Ramirez, J., and Sanz, R. (2013). On the limitations of standard statisti-cal modeling in biologistatisti-cal systems: a full Bayesian approach for biology.Prog. Biophys. Mol. Biol.113, 80–91. doi:10.1016/j.pbiomolbio.2013.03.008 Greicius, M. D., Srivastava, G., Reiss, A. L., and Menon, V. (2004).
Default-mode network activity distinguishes Alzheimer’s disease from healthy aging: evidence from functional MRI.Proc. Natl. Acad. Sci. U.S.A.101, 4637–4642. doi:10.1073/pnas.0308627101
Habeck, C., Risacher, S., Lee, G. J., Glymour, M. M., Mormino, E., Mukherjee, S., et al. (2012). Relationship between baseline brain metabolism measured using [18F]FDG PET and memory and executive function in prodromal and early
Alzheimer’s disease.Brain Imaging Behav.6, 568–583. doi:10.1007/s11682-012-9208-x
Hafkemeijer, A., Van der Grond, J., and Rombouts, S. A. R. B. (2012). Imaging the default mode network in aging and dementia.Biochim. Biophys. Acta1822, 431–441. doi:10.1016/j.bbadis.2011.07.008
Hampel, H., Wilcock, G., Andrieu, S., Aisen, P., Blennow, K., Broich, K., et al. (2011). Biomarkers for Alzheimer’s disease therapeutic trials.Prog. Neurobiol. 95, 579–593. doi:10.1016/j.pneurobio.2010.11.005
He, Y., Wang, J., Wang, L., Chen, Z. J., Yan, C., Yang, H., et al. (2009). Uncovering intrinsic modular organization of spontaneous brain activity in humans.PLoS ONE4:e5226. doi:10.1371/journal.pone.0005226
Henriksen, K., O’Bryant, S. E., Hampel, H., Trojanowski, J. Q., Montine, T. J., Jeromin, A., et al. (2014). The future of blood-based biomarkers for Alzheimer’s disease.Alzheimers Dement. 10, 115–131. doi:10.1016/j.jalz.2013.01.013 Hye, A., Lynham, S., Thambisetty, M., Causevic, M., Campbell, J., Byers, H. L.,
et al. (2006). Proteome-based plasma biomarkers for Alzheimer’s disease.Brain 129(Pt 11), 3042–3050. doi:10.1093/brain/awl279
Jack, C. R. (2012). Alzheimer disease: new concepts on its neurobiology and the clin-ical role imaging will play.Radiology263, 344–361. doi:10.1148/radiol.12110433 Kjelvik, G., Sando, S. B., Aasly, J., Engedal, K. A., and White, L. R. (2007). Use of the Brief Smell Identification Test for olfactory deficit in a Norwegian population with Alzheimer’s disease.Int. J. Geriatr. Psychiatry22, 1020–1024. doi:10.1002/gps.1783
Knopman, D. S., DeKosky, S. T., Cummings, J. L., Chui, H., Corey-Bloom, J., Relkin, N., et al. (2001). Practice parameter: diagnosis of dementia (an evidence-based review). Report of the Quality Standards Subcommittee of the American Acad-emy of Neurology.Neurology56, 1143–1153. doi:10.1212/WNL.56.9.1143 Lee, M. H., Smyser, C. D., and Shimony, J. S. (2013). Resting-state fMRI: a review
of methods and clinical applications.AJNR Am. J. Neuroradiol.34, 1866–1872. doi:10.3174/ajnr.A3263
Li, X., Li, T.-Q., Andreasen, N., Wiberg, M. K., Westman, E., and Wahlund, L.-O. (2013). Ratio of Aβ42/P-tau181p in CSF is associated with aberrant default mode network in AD.Sci. Rep.3, 1339. doi:10.1038/srep01339
Liu, Y., Yu, C., Zhang, X., Liu, J., Duan, Y., Alexander-Bloch, A. F., et al. (2013). Impaired long distance functional connectivity and weighted network architec-ture in Alzheimer’s disease.Cereb. Cortexdoi:10.1093/cercor/bhs410 Mattila, J., Koikkalainen, J., Virkki, A., Simonsen, A., Van Gils, M., Waldemar, G.,
et al. (2011). A disease state fingerprint for evaluation of Alzheimer’s disease.J. Alzheimers Dis.27, 163–176. doi:10.3233/JAD-2011-110365
Mattila, J., Soininen, H., Koikkalainen, J., Rueckert, D., Wolz, R., Waldemar, G., et al. (2012). Optimizing the diagnosis of early Alzheimer’s disease in mild cogni-tive impairment subjects.J. Alzheimers Dis.32, 969–979. doi:10.3233/JAD-2012-120934
Mayeux, R., and Schupf, N. (2011). Blood-based biomarkers for Alzheimer’s dis-ease: plasma Aβ40 and Aβ42, and genetic variants.Neurobiol. Aging32(Suppl. 1), S10–S19. doi:10.1016/j.neurobiolaging.2011.09.004
McKhann, G., Drachman, D., Folstein, M., Katzman, R., Price, D., and Stad-lan, E. M. (1984). Clinical diagnosis of Alzheimer’s disease report of the NINCDS-ADRDA Work Group under the auspices of Department of Health and Human Services Task Force on Alzheimer’s Disease.Neurology34, 939–939. doi:10.1212/WNL.34.7.939
Migon, H.-S., and Gamerman, D. (1999). Statistical Inference: An Integrated Approach. London: CRC press.
Pievani, M., De Haan, W., Wu, T., Seeley, W. W., and Frisoni, G. B. (2011). Functional network disruption in the degenerative dementias.Lancet Neurol.10, 829–843. doi:10.1016/S1474-4422(11)70158-2
Raichle, M. E., and Gusnard, D. A. (2005). Intrinsic brain activity sets the stage for expression of motivated behavior.J. Comp. Neurol.493, 167–176. doi:10.1002/cne.20752
Rombouts, S. A. R. B., Barkhof, F., Goekoop, R., Stam, C. J., and Scheltens, P. (2005). Altered resting state networks in mild cognitive impairment and mild Alzheimer’s disease: an fMRI study.Hum. Brain Mapp.26, 231–239. doi:10.1002/hbm.20160 Rosen, W. G., Mohs, R. C., and Davis, K. L. (1984). A new rating scale for Alzheimer’s
disease.Am. J. Psychiatry141, 1356–1364.
Sanz-Arigita, E. J., Schoonheim, M. M., Damoiseaux, J. S., Rombouts, S. A. R. B., Maris, E., Barkhof, F., et al. (2010). Loss of “small-world” networks in Alzheimer’s disease: graph analysis of FMRI resting-state functional connectivity.PLoS ONE 5:e13788. doi:10.1371/journal.pone.0013788
Seeley, W. W., Crawford, R. K., Zhou, J., Miller, B. L., and Greicius, M. D. (2009). Neurodegenerative diseases target large-scale human brain networks.Neuron62, 42–52. doi:10.1016/j.neuron.2009.03.024
Serby, M., Larson, P., and Kalkstein, D. (1991). The nature and course of olfactory deficits in Alzheimer’s disease.Am. J. Psychiatry148, 357–360.
Sheline, Y. I., Barch, D. M., Price, J. L., Rundle, M. M., Vaishnavi, S. N., Snyder, A. Z., et al. (2009). The default mode network and self-referential processes in depression.Proc. Natl. Acad. Sci. U.S.A.106, 1942–1947. doi:10.1073/pnas. 0812686106
Sheline, Y. I., Raichle, M. E., Snyder, A. Z., Morris, J. C., Head, D., Wang, S., et al. (2010). Amyloid plaques disrupt resting state default mode network connec-tivity in cognitively normal elderly.Biol. Psychiatry67, 584–587. doi:10.1016/j. biopsych.2009.08.024
Sperling, R. (2011). Potential of functional MRI as a biomarker in early Alzheimer’s disease.Neurobiol. Aging32(Suppl. 1), S37–S43. doi:10.1016/j.neurobiolaging. 2011.09.009
Sperling, R. A., Dickerson, B. C., Pihlajamaki, M., Vannini, P., LaViolette, P. S., Vitolo, O. V., et al. (2010). Functional alterations in memory networks in early Alzheimer’s disease.Neuromolecular Med.12, 27–43. doi:10.1007/s12017-009-8109-7
Stone, J. V. (2002). Independent component analysis: an introduction.Trends Cogn. Sci. (Regul. Ed.)6, 59–64. doi:10.1016/S1364-6613(00)01813-1
Toledo, J. B., Shaw, L. M., and Trojanowski, J. Q. (2013). Plasma amyloid beta mea-surements – a desired but elusive Alzheimer’s disease biomarker.Alzheimers Res. Ther.5, 8. doi:10.1186/alzrt162
Trushina, E., Dutta, T., Persson, X.-M. T., Mielke, M. M., and Petersen, R. C. (2013). Identification of altered metabolic pathways in plasma and CSF in mild cognitive impairment and Alzheimer’s disease using metabolomics.PLoS ONE8:e63644. doi:10.1371/journal.pone.0063644
Van den Heuvel, M. P., and Hulshoff Pol, H. E. (2010). Exploring the brain network: a review on resting-state fMRI functional connectivity.Eur. Neuropsychophar-macol.20, 519–534. doi:10.1016/j.euroneuro.2010.03.008
Vanderstichele, H., Van Kerschaver, E., Hesse, C., Davidsson, P., Buyse, M. A., Andreasen, N., et al. (2000). Standardization of measurement of beta-amyloid(1-42) in cerebrospinal fluid and plasma. Amyloid 7, 245–258. doi:10.3109/ 13506120009146438
Wang, J., Wang, L., Zang, Y., Yang, H., Tang, H., Gong, Q., et al. (2009). Parcellation-dependent small-world brain functional networks: a resting-state fMRI study. Hum. Brain Mapp.30, 1511–1523. doi:10.1002/hbm.20623
Wang, J., Zuo, X., and He, Y. (2010). Graph-based network analysis of resting-state functional MRI.Front. Syst. Neurosci.4. Available at: http://www.ncbi.nlm.nih. gov/pmc/articles/PMC2893007/ doi:10.3389/fnsys.2010.00016
Wang, L., Brier, M. R., Snyder, A. Z., Thomas, J. B., Fagan, A. M., Xiong, C., et al. (2013). Cerebrospinal fluid Aβ42, phosphorylated Tau181, and resting-state
functional connectivity.JAMA Neurol.70, 1242–1248. doi:10.1001/jamaneurol. 2013.3253
Washington, S. D., Gordon, E. M., Brar, J., Warburton, S., Sawyer, A. T., Wolfe, A., et al. (2013). Dysmaturation of the default mode network in autism.Hum. Brain Mapp.doi:10.1002/hbm.22252
Wee, C.-Y., Yap, P.-T., Denny, K., Browndyke, J. N., Potter, G. G., Welsh-Bohmer, K. A., et al. (2012). Resting-state multi-spectrum functional connectivity networks for identification of MCI patients.PLoS ONE7:e37828. doi:10.1371/journal. pone.0037828
Wu, J., Anwyl, R., and Rowan, M. J. (1995). Beta-Amyloid selectively augments NMDA receptor-mediated synaptic transmission in rat hippocampus. Neurore-port6, 2409–2413. doi:10.1097/00001756-199511270-00031
Wu, X., Li, R., Fleisher, A. S., Reiman, E. M., Guan, X., Zhang, Y., et al. (2011). Altered default mode network connectivity in Alzheimer’s disease – a resting functional MRI and Bayesian network study.Hum. Brain Mapp.32, 1868–1881. doi:10.1002/hbm.21153
Yang, J., Ogasa, T., Ohta, Y., Abe, K., and Wu, J. (2010). Decline of human tactile angle discrimination in patients with mild cognitive impairment and Alzheimer’s dis-ease.J. Alzheimers Dis.22, 225–234. doi:10.3233/JAD-2010-100723
Yoshiyama, Y., Lee, V. M. Y., and Trojanowski, J. Q. (2012). Therapeutic strategies for tau mediated neurodegeneration.J. Neurol. Neurosurg. Psychiatry84, 784–795. doi:10.1136/jnnp-2012-303144
Zhu, D. C., Majumdar, S., Korolev, I. O., Berger, K. L., and Bozoki, A. C. (2013). Alzheimer’s disease and amnestic mild cognitive impairment weaken con-nections within the default-mode network: a multi-modal imaging study.J. Alzheimers Dis.34, 969–984. doi:10.3233/JAD-121879
Conflict of Interest Statement:The authors declare that the research was conducted in the absence of any commercial or financial relationships that could be construed as a potential conflict of interest.
Received: 15 November 2013; accepted: 19 January 2014; published online: 04 February 2014.
Citation: Gomez-Ramirez J and Wu J (2014) Network-based biomarkers in Alzheimer’s disease: review and future directions. Front. Aging Neurosci.6:12. doi: 10.3389/fnagi.2014.00012
This article was submitted to the journal Frontiers in Aging Neuroscience.