Supervised classification of psychomotor competence in minimally
invasive surgery based on instruments motion analysis
Ignacio Oropesa Garcia • Patricia Sánchez-González • Magdalena K. Chmarra • Pablo Lamata • Rodrigo Pérez-Rodríguez • Frank Willem Jansen •
Jenny Dankelman • Enrique J. Gómez
Abstract
Background Objective assessment of psychomotor skills has become an important challenge in the training of minimally invasive surgical (MIS) techniques. Currently, no gold standard defining surgical competence exists for classifying residents according to their surgical skills. Supervised classification has been proposed as a means for objectively establishing competence thresholds in psycho-motor skills evaluation. This report presents a study com-paring three classification methods for establishing their validity in a set of tasks for basic skills' assessment. Methods Linear discriminant analysis (LDA), support vector machines (SVMs), and adaptive neuro-fuzzy infer-ence systems (ANFISs) were used. A total of 42 partici-pants (16 students and 8 residents experienced with <10
laparoscopic surgeries) in the nonexperienced group and 14 residents (experienced with >10 laparoscopic surgeries) and four surgeons in the experienced group performed three box trainer tasks validated for assessment of MIS psychomotor skills. Instrument movements were captured using the TrEndo tracking system, and nine motion ana-lysis parameters (MAPs) were analyzed. The performance of the classifiers was measured by leave-one-out cross-validation using the scores obtained by the participants. Results The mean accuracy performances of the classifiers were71 %(LDA),78.2 % (SVM), and 71.7 %(ANFIS).No statistically significant differences in the performance were identified between the classifiers.
considered. A correlation between the surgeons' previous experience and their execution of the tasks could be ascertained from results. However, misclassifications across all the classifiers could imply the existence of other ¡factors influencing psychomotor competence.
Keywords Minimally invasive surgery • Objective assessment • Training • Supervised classification • TrEndo
The development of training programs is one of the current challenges in the field of minimally invasive surgery (MIS) [1, 2]. Traditional Halsted training based on mentor-apprentice models are time and resource consuming and prone to subjective evaluation of the residents' actual competence [1, 3]. Several reasons make this model unsustainable, for example, the social demand for safer surgeries or accredited professionals, the need to reduce costs in hospitals, and the overloaded schedules of sur-geons [4].
New structured training programs are being proposed that delay direct involvement of residents in real surgeries until they become proficient in the required skills [4, 5]. In this context, the first stages of basic psychomotor training take place in controlled laboratory settings by means of box trainers and virtual reality (VR) simulators [2, 6].
An aspect important to the success of training programa is the definition of objective and standardized accreditation criteria for establishing surgical competence, which can be seen as a compendium of several psychomotor, cognitive, and judgment abilities often difficult to describe [6]. National programs such as the Fundamentals of Laparo-scopic Surgery [7] or the Dutch Cobra Alpha courses [6] recognize this need and set benchmarks throughout the training of psychomotor skills on simulator tasks, espe-cially during the first stages of training.
Simulators enhanced by VR and human motion tracking (HMT) are being used in the definition of competence-based training curricula, in which scoring criteria usually are a compendium of efficiency- and quality-based metrics [5, 6, 8]. These systems are helping to provide increasing insight into the true meaning of psychomotor competence. However, there is still a lack of consensus on a method with sufficient predictive validity to establish whether residents' psychomotor skills are apt for a real intervention or not in the operating room [9].
The incorporation of HMT and VR technologies into surgical training has proved that new kinematic parameters are important and significant in the assessment of psy-chomotor surgical competence [8, 10, 11]. To account for all the available information, several authors have proposed scoring systems based on motion analysis [10, 12].
However, the core problem remains, namely, determining the tasks and motion analysis parameters (MAPs) that best reflect competence according to the skill or skills being assessed [9]. Another important challenge is determining proficiency thresholds to define competence levels because no valid gold standard of competency exists against which to measure performance [13, 14].
One of the approaches explored in the literature makes use of classification methods to determine residents' degree of competence automatically in order to infer knowledge and correlate performance with surgical expertise [9, 11,
15-20]. These methods aim to identify an input feature vector (in this particular case, performance data associated with a resident/surgeon) as a member of an output class. The classes may be defined by the classifier's designer or learned by it. When expertise classes are predefined by the user, the classification model is said to be supervised.
Two phases can be distinguished in the classification process: (1) training, in which the model learns the distri-bution of different metrics registered for every output class considered, and (2) classification, in which the perfor-mance data of a new resident are confronted with the trained model and, based on it, assigned to one of the available classes.
Classification in MIS psychomotor skills assessment can be broadly arranged into sequential and nonsequential analyses [8]. Depending on the nature of the data used, classification can be based on sequential information con-cerning performance such as the order of maneuvers, rep-etitions, and the like [11, 15-17] or on nonsequential parameters obtained after task completion such as path length or overall score [9, 18, 20]. However, reports on classification performance tend to vary significantly between studies due to the experimental surrounding con-ditions such as the number of participants, the tasks used to quantify assessment, and the supervised input criteria of competence used in training the classifiers, among others.
To validate the practical use of several classification approaches, we performed a study comparing different techniques used for sequential classification of surgical competence according to basic psychomotor skills and using data from the MIS instruments' movements in a batch of box trainer tasks. In this manner, in addition to analyzing the relevance of motion analysis in the deter-mination of a surgeon's expertise, we investigated patterns between the performances of the classifiers to understand better the factors that influence surgical competence.
Materials and methods
trainer MIS assessment tasks were used [21]. The regis-tered MAPs served as the input feature vectors to the supervised classifiers, arranged according to the previous surgical experience (i.e., number of surgeries) of the participants.
For each task and classifier, two possible output classes were trained, denoting the participant's performance in the exercise: skilled (S) and not skilled (NS).
Three approaches to supervised classification were selected, each based on a different working principle: (1) a linear classifier based on LDA, (2) a nonlinear classifier using support vector machines, and (3) a fuzzy inference system based on adaptive neuro-fuzzy inference systems (FIS). For the interested reader, a general overview on their working principles is given, presenting their basic concepts and differences. The descriptions are meant as a simple introduction to the fundamental notions of the classifiers. Those interested in exploring these techniques further may find more information in the proposed bibliography on supervised classification [22-25].
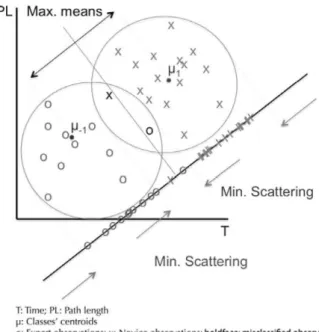
In general, LDA seeks to find linear combinations between input features to characterize and separate two or more output classes [22]. To achieve this, LDA projects the input feature vector onto a single dimension such that data separation maximizes the distance of variances between classes (interclass scattering) or minimizes the distance of variances within them (intraclass scattering). As such, a normal decision hyperplane between classes can be defined in the projected dimension, delineating an optimal sepa-ration boundary. During classification, any new observa-tion is assigned to one or another class depending on which side of the hyperplane it falls. Subjects incorrectly falling on the other side are considered misclassifications (Fig. 1). SVMs are based on the same starting premise as LDA: finding the optimal decision boundaries to separate data from each input category [23]. Unlike LDA, however, SVM acknowledges the possibility that the boundary may not be considered linear but rather may be optimally defined by a curve (Fig. 2). Thus, SVM uses a number of mathematical nonlinear functions (kernel functions) to map or rearrange data into a linearly separable feature space (which may be of a higher dimension than the original one). In the eventuality that the data remain nonseparable and to avoid problems of overfitting (adjustment of the model so tightly to the training data that it becomes too rigid to cope with classification of new observations), SVM introduces a soft margin function dependent on a capacity constant (C) and a variable parameter (|) that must be determined by the user. This function regulates the rele-vance of classification errors during training (i.e., the flexibility /tolerance of the model).
T:Time; PL: Path length fj: Classes' c e n t r o i d s
o: Expert observations; x: Novios observations; boldface: rniscfassihed observations
Fig. 1 Linear discriminant analysis (LDA), imaginary example, using a two-motion analysis parameter (2-MAP) input feature vector, with subjects placed according to their score vector. In the example, the optimal separation between classes yields one subject incorrectly classified per class
Finally, FIS allow introduction of the uncertainty resulting from the qualitative aspects of human knowledge or nature into the classification process by means of if-then rules derived from the input data that define a series of membership functions. By aggregating the inputs of these membership functions, a probabilistic likelihood output may be determined.
For a better explanation of this, an example is shown in Fig. 3. In this example, a new subject is classified according to two different rules. The participant's scores are evaluated into input fuzzy sets by each rule's ante-cedent condition (i.e, "if") to determine the degree to which they conform to their membership functions. If the rule's antecedent has more than one part, an operator (e.g., AND, OR) is applied to obtain a single set. The set is evaluated by the consequent condition (i.e., "then") and aggregated through rules, providing a single output fuzzy set. This fuzzy set is finally evaluated to provide a single probability output.
PL
T: Time; PL: F^th length
Í: Soft margin parameter; K(x,y}: Kernel function
o: Expert observations; x: Novice observations; boldface: reclassified observations
Fig. 2 Support vector machine (SVM), imaginary example, using a Left: Original feature space. Right: Transformed space using kernel two-motion analysis parameter (2-MAP) input feature vector, with function K(x,y). The error weighting factor £ is introduced, flexible subjects placed according to their score vector. Support vectors are enough to accommodate a linear hyperplane regardless of the two shown defining the boundary margins for each region (dotted lines). misclassified subjects
1. Fuzzification 2. Operation
OR (max]
3. Implication
Path Length 2m
INPUT FEATURES
RX:RuleX
IX: Input fuzzy sets for rule x OX: Output fuzzy set for rule x AO: Aggregated output
5. Defuzzification
01
0 2
AO
OUTPUT CLASS
Fig. 4 Box trainer assessment tasks [21]
Grasp and Place (GP)
Peg grasping task, where spherical objects [chickpeas) are placed on
corresponding sequential holes. The scenario includes different blocks
providing different heights, orientations and occlusion zones.
This task is performed with the dominant hand only, using a laparoscopic
grasper.
Coordinated Pulling (CP)
Task that requires placing three elastic bands through their corresponding
posts using solely two laparoscopic graspers. Pairs of posts vary regarding
height and orientation with respect to camera (0, 135, 25 degrees
respectively) within the setting.
Bi -manual task (two I a pa re scope graspers)
Grasp and Transfer (GT)
Peg transfer task, where a small wooden cylinder Is moved through a
series of rings, distributed at different heights and angles. Transfer varies
from left-to-right hand to right-to-left hand depending on the ring.
Bi-manual task (two laparoscopic graspers).
functions are automatically learned and easily adapted based on the training data.
Validation experiment
Input data were obtained in the skills lab at the Leiden University Medical Center (LUMC, Leiden, The Nether-lands). A total of 42 participants comprising surgical experts, residents, and medical students were invited to participate in the study. Because no gold standard exists for determining laparoscopic experience, two input categories were established based on the number of laparoscopic procedures performed: (1) experienced surgeons (Ex) comprising 4 experts and 14 residents who had performed more than 10 surgeries, and nonexperienced surgeons (NEx), comprising 16 students and 8 residents who had performed 10 or fewer surgeries.
Each participant performed each of the following three basic tasks once in a box trainer (Fig. 4): grasp and place (GP), coordinated pulling (CP), and grasp and transfer (GT) [21]. Because the purpose of the tasks was to assess psychomotor performance, the participants had no experi-ence with them, and no previous practice was allowed.
A brief explanation of the tasks' objectives was given to let the participants infer their own strategy based on their own experience and skills. The position of the tasks and the camera within the box trainer were identical for each participant. Moreover, the starting and ending positions of the tips of the instruments and the order of the targets' placements at predefined positions were fixed for each task. The endoscope (ACMI CIRCÓN Microdigital II MV-9695) provided a 0° view on a monitor and was fixed at the same angle for all the tasks and participants. No time restrictions were imposed, and completion was not forced upon the participant.
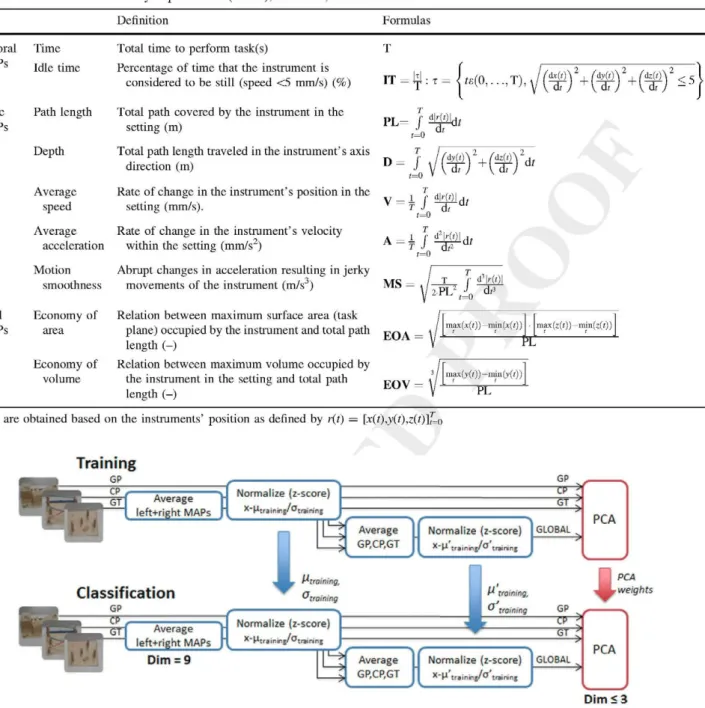
The movements of instruments were recorded using the TrEndo tracking system [9]. Raw motion data of the instruments' movements were used to calculate nine dif-ferent MAPs per task related to temporal, kinetic, and spatial information on performance (Table 1). The MAPs for the right and left hands were averaged for bimanual tasks (CP, GT). The input feature vectors of the classifiers for each task performance were built containing the nine resulting MAP values.
Table 1 Selection of motion analysis parameters (MAPs), definition, and formulation
MAPs Definition Formulas
Temporal MAPs
Kinetic MAPs
Time
Idle time
Path length
Depth
Average speed
Total time to perform task(s)
Percentage of time that the instrument is considered to be still (speed <5 mm/s) (%)
Total path covered by the instrument in the setting (m)
Total path length traveled in the instrument's axis direction (m)
Rate of change in the instrument's position in the setting (mm/s).
Rate of change in the instrument's velocity
IT = « : T= <ie(0, . . . , T )
f
M ) dt < 5P L = f Itííl
D = /
v = i / T
d ídt
dz(t)
dt
Average
acceleration within the setting (mm/s2)
t=0
T
Motion Abrupt changes in acceleration resulting in jerky smoothness movements of the instrument (m/s )
A = H
MS =
¿M>)\ dt
2-PL2
d>Wl
J dt
Spatial MAPs
Economy of Relation between maximum surface area (task
area plane) occupied by the instrument and total path yr\\ length (-)
Economy of Relation between maximum volume occupied by
volume the instrument in the setting and total path FOV — length (-)
max(x(t))— imn(x(t)) max(z(t))-ram(z(t))
P E
max(y(;))— min(y(i)) "PL"
MAPs are obtained based on the instruments' position as defined by r(i) = [x(t),y(t),z(t)]f=o
Normalize (z-score)
GP
" G T
Classification
GP
I
Average
_ ^ GP,CP,GT
Normalize (z-score)
^ " l1 t í a i n r i j / ^ tiainíríf
GLOBAL
PCA
"training.
Average l e f t - r i g h t M A P i
Normalize (z-score)
x~ H i r i ¡ nilf/ Ol ( 1¡ pinj
0,,,,,
[ ^ trainingPCA
r weights
GP
-P >
"or
Dim = 9 Average
1J GP,CP,GT
Normalize (z-score)
* ~ l ^ t r a i n r i ^ ' " tiíininf
GLOBAL PCA
Dim S3
GP: Grasp and Place; CP: Coordinated Pulling; GT: Grasp and Transfer, GLOBAL: Global score. Hirw.rt, oirjininj: mean and standard deviation of training MAP values of each individual task; uViininí, a'ira¡n¡nB: mean and standard deviation of training MAP values of the global score;
PCA: Principal component analysis; Dim; dimensions of input feature vector at each stage of the process.
Fig. 5 Data preparation adapted from Chmarra et al. [9]. The left-and right-hleft-and data are averaged for the coordinated pulling (CP) left-and grasp and transfer (GT) tasks. After normalization, to obtain the global score, the data from the three tasks (GP, CP, GT) are again averaged and normalized. Principal component analysis (PCA) aims
to reduce the dimensionality of the input feature vector. All the training parameters (/i, cr, ¡i , a'', PCA weights) must be stored for use during the classification process
each task using z-score normalization (Fig. 5). A second normalization then was applied to this global scoring.
One of the problems in dealing with multidimensional input data results in the so-called curse of dimensionality, in which the predictive power of the classifiers decreases
variability in the input data. In this way, according to the Kaiser criterion, coefficients with values lower than 1 can be discarded from the final analysis. In this case, it meant decreasing the dimensionality of the input feature vectors from 9 to 3 or less [22].
Exploratory analysis
To validate the categories and reduce the number of sur-geries used in this study, before classification, a descriptive analysis of MAPs was performed. The Mann-Whitney test was used to search for statistically significant differences between categories (p < 0.05). All statistical analyses were performed with SPSS v. 17 (SPSS Inc., Chicago, IL, USA).
Configuration of classifiers' parameters
Different toolboxes and libraries available for Matlab R2009b (Mathworks, Natick, MA, USA) were used to build the classifiers. Configuration of the different param-eters belonging to each classifier was implemented as follows:
• LDA: LDA was performed by means of the Statistics Toolbox. No special configuration of input parameters was required.
• S VM: S VM was implemented by means of the library for
support vector machines (LIBSVM) library [26].
A Gaussian radial-based kernel function (K(x,y) = 2
¿fx-y ) was used. A grid search for the optimal
combi-nation of parameters (C, y) was performed for C = 2~l,..., 217 and y = 2~1 7,..., 24. For each task, the pair
yielding the highest accuracy was selected.
• ANFIS: The Fuzzy Logic Toolbox was used for ANFIS evaluation. An iterative search for the optimal number of membership functions (MF = {2,3,4}) showed that in all cases, the highest accuracy was obtained for MF = 2. Other configuration parameters were Af°epochs = 200 (maximum training steps) and Training error goal = 10~6.
Classifier validation
The classification for each task and the global score were determined according to the expertise shown in perfor-mance of the task as S (skilled) or NS (not skilled). For each input vector, a category tag was assigned to indicate whether the subject was nonexperienced (NEx — 1) or experienced (Ex — 2). Accordingly, each classifier returned an output classifier value for nonskilled (NS — 1) and skilled (S — 2) participants depending on their
assigned class. Each classifier also returned a posterior probability reflecting the uncertainty of assessing an observation as belonging to a particular class.
To evaluate the performance of each classifier, leave-one-out cross-validation was performed [27]. With this evaluation method, data from each subject except one are used to train the system, and the remaining datum is used for validation. This pattern is repeated for every subject, and a confusion matrix can be built from the obtained results relating the classifiers' predictions to the input categories. This approach ensures that the whole data set is used for both training and testing. It is useful when the population size is limited, as was the case in this study. Despite some drawbacks concerning variance of results and computational time, this approach, by its very nature, is considered an unbiased and accurate strategy for classifi-cation [27].
Evaluation methods
Several parameters were calculated to evaluate each classifier:
• Accuracy: Percentage of subjects correctly classified according to the input categories
• Sensitivity: Percentage of Ex subjects classified as S • Specificity: Percentage of NEx subjects classified as NS • Root mean square error (RMSE): Mean error
measure-ment between the expected values (Ex, NEx) and the T predicted values (S, NS) for each classifier.
Additionally, the performance of each classifier was graphically represented by means of receiver operating characteristic (ROC) curves, with plotting of their speci-ficity (x-axis) compared with their sensitivity (y-axis), based on the posterior probability of each classifier. The area under the ROC curve (AUC£[0,1]) is given as a
measure showing the robustness of the classifier. The AUC reflects the probability that the classifier will rank a random experienced participant (Ex) with a higher output value than a random nonexperienced participant (NEx), with 1 being the optimal value and 0.5 reflecting a random probability.
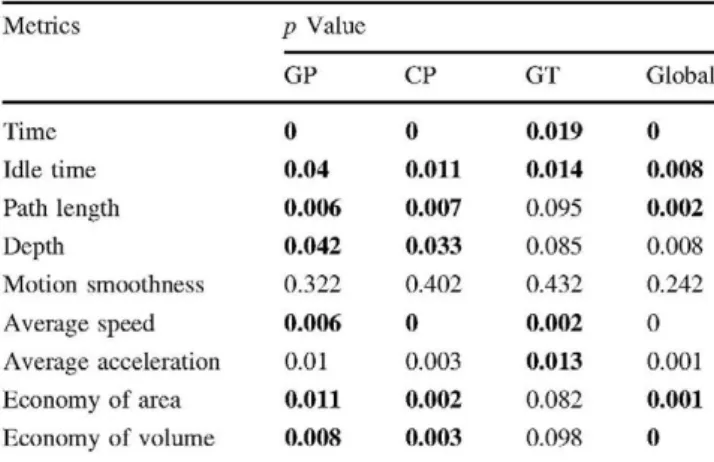
Table 2 Exploratory analysis presenting p values of Mann-Whitney tests analyzing differences between participants
Performance of classifiers
Metrics Time Idle time Path length Depth Motion smoothness Average speed Average acceleration
Economy of area
Economy of volume
p Value GP 0 0.04 0.006 0.042 0.322 0.006 0.01 0.011 0.008 CP 0 0.011 0.007 0.033 0.402 0 0.003 0.002 0.003 GT 0.019 0.014 0.095 0.085 0.432 0.002 0.013 0.082 0.098 Global 0 0.008 0.002 0.008 0.242 0 0.001 0.001 0
GP grasp and place, CP coordinated pulling, GT grasp and transfer, Global global score
Results considered statistically significant (p < 0.05) are given in boldface type
Results
Exploratory analysis
The explorative analysis results are given in Table 2. All the participants performed the three proposed tasks except for one NEx and one Ex. Because of time constraints, they were not able to perform the GT task. The GP and CP tasks presented significant differences for all the MAPs except for motion smoothness. In the case of the GT task, the significant MAPs were time, idle time, average speed, and average acceleration. For the global score, only motion smoothness did not show statistical significance.
The performance results, ROC curves, and classifier plots for each task and classifier can be seen in Table 3 and Figs. 6 and 7, respectively. Overall, the scores reflected a high rate of correct classifications (with accuracy values reaching 83.3 % in some specific cases), as well as the fact that no classifier outperformed the others in terms of sta-tistical significance.
For the GP task, both ANFIS and SVM presented an accuracy of 76.2 % as well as similar sensitivity and specificity results, whereas LDA showed worse results due to a higher rate of misclassifications of the nonexperienced participants. Despite this, the differences with the other two classifiers did not reach statistical significance thresholds. The highest classification rate for the CP task (83.3 %) was shown by SVM, especially with regard to the nonex-perienced participants (87.5 %). For the GT task, LDA and SVM presented the highest accuracy, whereas ANFIS scored below 70 %. In general, the highest accuracy values were obtained for the global score, for which the results presented were robust for the three classifiers in terms of accuracy and specificity. The highest scores for accuracy (83.3 %) and specificity (95.8 %) were obtained by SVM. The classifier plots are presented in Fig. 7. Cochran's test showed no significant differences between the classi-fiers, although in the case of the CP task, the significance values were close to the threshold (p — 0.07). Addition-ally, inspection of the classifier plots showed, for example, differences in classification of the NEx participants for LDA with respect to the other classifiers for task GP or for ANFIS and the Ex participants for task GT and the global
Table 3 Classification results per task and classifier
Task GP CP GT Global Classifier LDA SVM ANFIS LDA SVM ANFIS LDA SVM ANFIS LDA SVM ANFIS Accuracy (%) 61.9 76.2 76.2 73.8 83.3 71.4 72.5 70 62.5 78.6 83.3 73.8 RMSE 0.62 0.48 0.48 0.51 0.41 0.53 0.52 0.3 0.61 0.46 0.38 0.51 Sensitivity (%) 66.7 72.2 66.7 66.7 77.8 72.2 76.5 58.8 52.9 66.7 66.7 61.1 Specificity (%) 58.3 79.2 83.3 79.2 87.5 70.8 69.6 78.3 69.6 87.5 95.8 83.3 AUC 0.6 0.81 0.83 0.76 0.86 0.72 0.73 0.69 0.65 0.81 0.81 0.76
Fig. 6 Receiver operating characteristic (ROC) curves.
Light gray: linear discriminant
analysis (LDA). Black: support vector machine (SVM). Dark
gray: aadaptive neuro-fuzzy
inference system (ANFIS). The x-axis represents 1-specificity, and the y-axis represents sensitivity
1
o.a
0.6
0.4
0.2
GLOBAL
0.5
^T
f-0.5
GP: Grasp and Place: CP: Coordinated Pulling; GT: Grasp and Transfer; GLOBAL: Global score
Discussion
In this report, we present a comparison between three approaches for determining MIS psychomotor competence based on linear (LDA), nonlinear (SVM), and fuzzy (AN-FIS) supervised classifiers. Individually, the three tech-niques have proved their robustness for the intended purpose, with SVM showing better results than the other two classifiers.
With the average score for each of the three tasks and the global score taken into account, the average accuracy was 71 % for LDA, 78.2 % for SVM, and 71.7 % for ANFIS. However, in general, no significant differences were found between any of them. A correlation between the results of the explorative survey and the performance of the classifiers can be observed. The tasks featuring more significant differences per MAP (e.g., task CP: 76.1 % average classification accuracy) tended to achieve better classification scores than the others, with less statistically relevant MAPs (e.g., task GT: 68.3 % average classifica-tion accuracy). The conclusion indicated by these results is that motion analysis is important in the determination of
MIS psychomotor skills, as reported in previous studies [8, 21].
Another issue raised by these results addresses the long-standing question whether assessment of skills should be performed on individual scores obtained at different stations or on a composite, global score [5, 14, 28]. In this study, the global score obtained the overall best results in terms of classifiers' predictability, both in accuracy (78.6 % average) and in specificity (88.9 % average). The same phenomenon was observed by Chmarra et al. [9], who reported that an overall score considering data from all tasks, MAPs, and abilities assessed provided more robust information on surgical performance. However, it may be argued that evaluation of individual tasks may reveal deficiencies in performance of specific abilities.
LDA
SVM
ANFIS
LDA
SVM
ANFIS
Grasp and Place (GP)
*:tf- -+*>** $+ -*f 0* t0t * * *l >° f *,* t t "
¡¡J i. +M^o*+fft********t°**e'i+*"••*•'-**+ *"
L 2
5 I
>o-M-o-£#-oooó¡H!00-£+Ht
K +*•+*<>**+•#+**+»+*•++<*. • • • • • +
p = 0.15
Grasp and Transfer (GT)
S 2 ^f " ' " T T T ' I *"ff **»*•*f+f f.f+= +»<>•
-• .+ + g + * o OB -•-» i * * i * - B -• * + -• -• -• -• O+-
-^-i--**-1) 15 ¡0 ¡5
si** o ** o o++i*** * * • • 0 *4#++- •
' • + ! • « • • • • « • • O O O O O O O *
-I ••o#*oooo»*»«»**o*f * 0 *
10 15 2 0 2 5 3 0
p= 0.41
Coordinated Pulling (CP)
**->t ;•*+
M**o++*t*t+«t*t*-,'{ i. "\ • •; . j ' ' i** *: '• •
¡S s» JS 40
\ *f- ••••*---*f*!*+#**+4+»+a+f^
•+++•4+*+++*° <>•+•+•+* o *++• +
If IS i<l « SI 55 -10
3 j i . . . f v
• 4+0+****+*fO OOO **4+*-0**4 •-*••*
p = 0.07
Global score
r
y f +•»* **»**f *»*•*+*••tt°*4»fo+*-» ••••+*o • • + ; • • * • • # • • + ! • * * ;
;s as ;s
in
a
+++*
•* '
H* t++* 1 ++*++ + **+ * • + *
1 '
15 i l l !5 50 55 •<«
i2 * * +
p= 0.22
GP: Grasp and Place; CP: Coordinated Pulling; GT: Grasp and Transfer; GLOBAL: Global score.
Ex: Experienced participants; NEx: Non-experienced participants.
S: Skilled participant, NS: Non-skilled participant.
Fig. 7 Classifier plots and Cochran significance probability (p) per surgeons (Ex) = 2] and the output classes [nonskilled (NS) = 1; task. For each participant (x-axis), each plot represents the input skilled (S) = 2] as circles and asterisks, respectively. The posterior category tag [nonexperienced surgeons (NEx) = 1; experienced p values are represented as dots
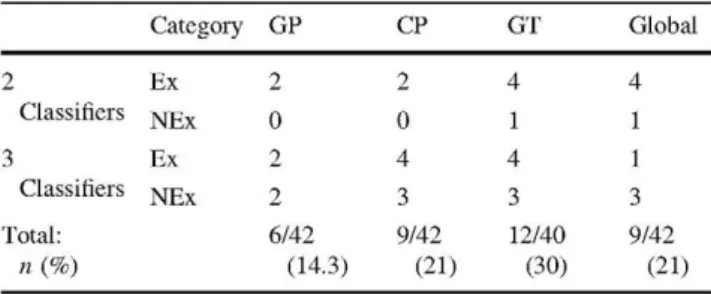
Table 4 Misclassification frequency
Category
Ex
NEx
Ex
NEx
GP
2
0
2
2
6/42
CP
2
0
4
3
9/42 GT
4
1
4
3
12/40
« ( % ) (14.3) (21) (30) (21)
GP grasp and place, CP coordinated pulling, GT grasp and transfer, Global global score, Ex experienced participants, NEx,
nonexperi-enced participants
For each task, the sum and percentage of participants misclassified in terms of 2 or 3 classifiers is provided
As an important consequence, the lack of standards means that supervised classification will encounter diffi-culty choosing the criteria and thresholds that will delimit each considered output class. In this study, we decided to use the number of laparoscopic surgeries performed to determine the competence threshold, a criterion widely extended in several national training programs [6, 30, 31]. The threshold-cutting number of 10 surgeries performed was selected in keeping with previous validation studies in the literature [9, 32, 33]. In this sense, the explorative analysis was a way to conoborate its relevance before its use in the classifiers. As we have shown, this criterion has yielded acceptable results (accuracies of 60-80 % for all classifiers), especially in the classification of novices and residents with a low experience level.
Whereas some of the misclassifications may be conse-quence of the configuration, training, or validation of the classifiers, others may simply reflect a lack of conelation between the number of surgeries performed (experience) and the performance skills shown for a given task (exper-tise). The implications of this last point explain, for example, that an untrained yet skillful novice may be found competent or that an experienced resident may, for some reason (e.g., fatigue), perform a task inconectly.
Cochran's analysis, which concludes that no significant differences occur between the three proposed classifiers, points to this fact that the same subjects are misclassified along the three tasks. More explicitly, through visual inspection of each classifier plot, we can add up for each task the total number of participants that get misclassified for two or three of the classifiers and are therefore sus-ceptible of presenting an expertise not conelated with their experience (Table 4). For the global score, up to nine of the subjects classified were found liable to this effect.
An interesting aspect of our study comes from the comparison with results presented in previous studies fea-turing the proposed techniques for MIS skills assessment (Table 5). It can be seen that LDA presents the highest
similarity between the mean accuracy results in our study and those presented by Chmana et al. [9], which were reported to be of 74 % using a global score obtained based on the performance of four different simulator tasks. It must be observed that both studies bear many similarities in terms of the acquisition system used (TrEndo), the facilities for the experiment (LUMC), the number of trials allowed (one), four of the MAPs (time, path length, depth, and motion smoothness), the data preparation process, and the validation methodology. All these are external factors that may condition the resemblance between them.
This is more evident when the two remaining classifiers are examined with respect to previous studies. Allen et al. [18] reported an average accuracy of 91.6 % using SVM. Although methodologically, the SVMs used were trained in a very similar manner and at least two of the three tasks used (peg transfer and pass rope) shared common assess-ment objectives, our study and theirs had three important differences. The first difference was related to the distri-bution of the participants, who mainly were experts and novices, not residents. It can be postulated that in this instance, the differences between categories would hypo-thetically be more prominent than in cases with consider-ation of intermediate levels.
The second difference related to the number of obser-vations, which in their study mounted up to a total of 696 repetitions across three different assessment tasks per-formed by 30 participants. Two influencing factors can be deduced from this: (1) with a larger sample of trainees, the classifier was less prone to bias enors, and (2) if each participant was able to perform the tasks several times (up to 10 times according to the study), their learning curve for each task must have increased from the first to the last performance, thus having an effect (positive or negative) on the final results.
The third difference related to the choice of metrics. Only time and path length were featured in both studies. Interestingly, a force-related metric also was featured, which may hint at the importance of this information source, as has also been reported by Rosen et al. [11].
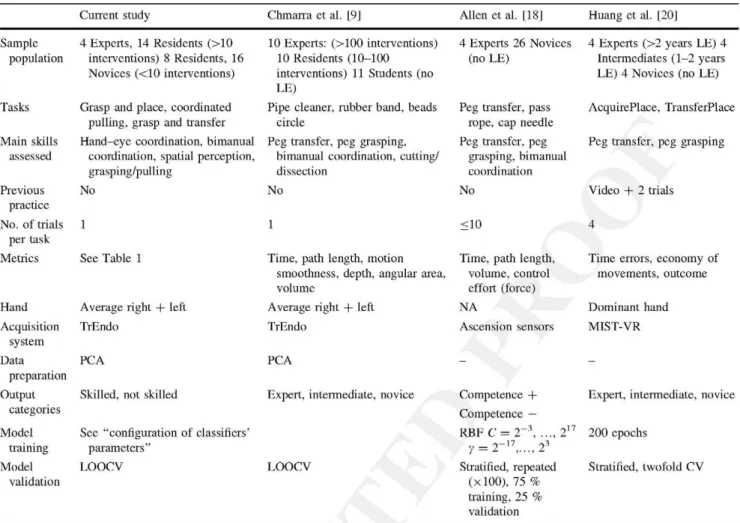
Table 5 Comparisons between studies
Current study Chmarra et al. [9] Allen et al. [18] Huang et al. [20]
Sample population Tasks Main skills assessed Previous practice
No. of trials per task Metrics Hand Acquisition system Data preparation Output categories Model training Model validation
4 Experts, 14 Residents (>10 interventions) 8 Residents, 16 Novices (<10 interventions)
Grasp and place, coordinated pulling, grasp and transfer
Hand-eye coordination, bimanual coordination, spatial perception, grasping/pulling
No
1
See Table 1
Average right + left
TrEndo
PCA
Skilled, not skilled
See "configuration of classifiers' parameters"
LOOCV
10 Experts: (>100 interventions) 10 Residents (10-100 interventions) 11 Students (no LE)
Pipe cleaner, rubber band, beads circle
Peg transfer, peg grasping, bimanual coordination, cutting/ dissection
No
Time, path length, motion smoothness, depth, angular area, volume
Average right + left
TrEndo
PCA
Expert, intermediate, novice .
LOOCV
4 Experts 26 Novices (no LE)
Peg transfer, pass rope, cap needle
Peg transfer, peg grasping, bimanual coordination
No
<10
Time, path length, volume, control effort (force) NA Ascension sensors Competence + Competence —
RBF C = 2~3, ..., :
y = 2 -1 7, . . . , 23
Stratified, repeated (xlOO), 75 % training, 25 % validation
4 Experts (>2 years LE) 4 Intermediates (1-2 years LE) 4 Novices (no LE)
AcquirePlace, TransferPlace
Peg transfer, peg grasping
Video + 2 trials
Time errors, economy of movements, outcome
Dominant hand
MIST-VR
Expert, intermediate, novice
200 epochs
Stratified, twofold CV
LE laparoscopic experience, NA not available, MIST-VR minimally invasive surgical trainer-virtual reality, PCA principal component analysis, RBF radial basis function, C and y, SVM support vector machine, soft margin function parameters, LOOCV, leave-one-out cross-validation, CV
cross-validation
number of participants and trial repetitions ( 1 2 x 4 plus 2 trial runs in Huang et al. [20]), the number of output classes (n — 3), the acquisition system used (VR simulator in Huang's study; it would be interesting to ascertain whether its visual and haptic realism may have had an influence on the determination of competence), and the validation methodology (e.g., they considered only metrics registered for the instrument in the dominant hand). More impor-tantly, only one MAP (time) was common for both studies. One of the other two reported metrics referenced the economy of movements, with the remaining metric refer-encing the number of errors. Therefore, the relative importance of motion with respect to the qualitative scores used was diminished.
On the basis of these findings and the misclassification patterns reflected in Table 4, it is possible to hypothesize that the choice of classifier may not be as relevant as the definition of a good assessment test and scoring system, taking into account optimal combinations of abilities
modeling of the classifier do not have an impact on the system's accuracy but rather to point out other influencing factors.
Evaluation of MIS psychomotor competence based on supervised classification shows a promising research area with real applicability as part of testing and scoring systems, which can be seen not only from the results presented here but also from previous studies [9, 11, 15-20]. These scoring systems could clearly benefit in their definition from more defined assessment standards, but the same could be said the other way around: classification-based systems may help to better define surgical competence in the acquisition of MIS psychomotor skills [11, 17]. Only three possible alternatives have been analyzed, but other solutions based on sequential classifiers such as hidden Markov models may yet improve performance. Future research is needed to improve the classifiers' accuracy and extend them to a complete portfolio of basic skills, tasks, and metrics and to validate classifiers for advanced operating room training, possibly combined with sequential analysis to include temporal information on performance [11].
This study addressed only the use of supervised classi-fication for summative feedback and in terms of deter-mining levels of psychomotor competence. Although they help to put into context the global scores obtained and give them a comprehensible meaning with regard to the levels of competence achieved, they do not offer information on other procedural aspects that may be the cause of errors or vacillations. In this sense, different ways of providing formative feedback to the trainee (e.g., in the form of comprehensible messages such as "target approaching speed is too high") should be explored [19]. Again, sequential classifiers considering the different steps and the duration of the different phases of a task can be valid tools for this. Alternatives exploring the combination of forma-tive and summaforma-tive feedback systems should therefore be analyzed and considered for an effective and objective assessment of MIS psychomotor skills.
Conclusions
This study proved the feasibility of using nonsequential, supervised classification for the assessment of MIS psy-chomotor skills competence based on MAPs. Although SVM globally obtained the best scores, none of the pro-posed techniques clearly outperformed the others. More-over, the coherence of the results reinforces the validity of the classifiers. Their application in training settings may provide immediate summative constructive feedback to residents that helps them improve their learning. Moreover, they may help to provide further insight into the process of
assessing surgical skills in order to build more robust tests and scoring systems.
Acknowledgments The authors thank all the surgeons, residents, and medical students who kindly volunteered and participated in the clinical trials, as well as the staff of the skills laboratory at the Leiden University Medical Centre for providing the available working space.
Disclosures Ignacio Oropesa, Patricia Sánchez-González, Frank Willem Jansen, Jenny Dankelman, and Enrique J. Gómez participate under partial funding of LLP-Leonardo da Vinci project MISTELA (528125-LLP-1-2012-1-UK). Magdalena K. Chmarra, Pablo Lamata, and Rodrigo Pérez-Rodríguez have no conflicts of interest or financial ties to disclose.
References
1. Aggarwal R, Moorthy K, Darzi A (2004) Laparoscopic skills training and assessment. Br J Surg 91:1549-1558
2. Usón J, Sánchez-Margallo FM, Pascual S, Climent S (2010) Formación en cirugía laparoscópica paso a paso, 4th edn. Centro de Cirugía de Mínima Invasión Jesús Usón, Cáceres
3. Fried GM, Feldman LS (2008) Objective assessment of technical performance. World J Surg 32:156-160. doi:10.1007/s00268-007-9143-y
4. Moorthy K, Munz Y, Sarker SK, Darzi A (2003) Objective assessment of technical skills in surgery. Br Med J 327:1032-1037
5. Feldman LS, Sherman V, Fried GM (2004) Using simulators to assess laparoscopic competence: ready for widespread use? Sur-gery 135:28^2. doi:10.1016/S0039-6060(03)00155-7
6. Hiemstra E (2012) Acquiring minimally invasive surgical skills. Department of Minimally Invasive Surgery in Gynaecology, Faculty of Medicine/Leiden University Medical Center (LUMC), Leiden University, Leiden
7. Ritter EM, Scott DJ (2007) Design of a proficiency-based skills training curriculum for the fundamentals of laparoscopic surgery. Surg Innov 14:107-112. doi:10.1177/1553350607302329
8. Oropesa I, Sanchez-Gonzalez P, Lamata P, Chmarra MK, Pag-ador JB, Sanchez-Margallo JA, Sanchez-Margallo FM, Gomez EJ (2011) Methods and tools for objective assessment of psycho-motor skills in laparoscopic surgery. J Surg Res 17LE81-E95. doi: 10.1016/j.jss.2011.06.034
9. Chmarra MK, Klein S, de Winter JCF, Jansen FW, Dankelman J (2010) Objective classification of residents based on their psy-chomotor laparoscopic skills. Surg Endose 24:1031-1039 10. Cotin S, Stylopoulos N, Ottensmeyer M, Neumann P, Rattner D,
Dawson S (2002) Metrics for laparoscopic skills trainers: the weakest link! In: Dohi T, Kikinis R (eds) Medical image com-puting and computer-assisted intervention—MICCAI 2002. Springer, Berlin, pp 35^-3
11. Rosen J, Solazzo M, Hannaford B, Sinanan M (2002) Task decomposition of laparoscopic surgery for objective evaluation of surgical residents' learning curve using hidden Markov model. Comput Aided Surg 7:49-61
12. Fraser SA, Klassen DR, Feldman LS, Ghitulescu GA, Stanbridge D, Fried GM (2003) Evaluating laparoscopic skills: setting the pass/fail score for the MISTELS system. Surg Endose 17:964-967. doi:10.1007/s00464-002-8828-4
skills and subjective in-training evaluations in surgical residents. J Am Coll Surg 198:105-110
14. Chmarra MK, Grimbergen CA, Jansen FW, Dankelman J (2010) How to objectively classify residents based on their psychomotor laparoscopic skills? Minim Invasive Ther Allied Technol 19:2-11. doi:10.3109/13645700903492977
15. Reiley CE, Hager GD (2009) Task versus subtask surgical skill evaluation of robotic minimally invasive surgery. Med Image Comput Comput Assist Interv 12:435^142
16. Leong JJH, Nicolaou M, Atallah L, Mylonas GP, Darzi A (2007) HMM assessment of quality of movement trajectory in laparo-scopic surgery. Comput Aided Surg 12:335-346
17. Megali G, Sinigaglia S, Tonet O, Dario P (2006) Modelling and evaluation of surgical performance using hidden Markov models. IEEE Trans Biomed Eng 53:1911-1919. doi:10.1109/TBME. 2006.881784
18. Allen BF, Nistor V, Dutson E, Carman G, Lewis C, Faloutsos P (2010) Support vector machines improve the accuracy of evalu-ation for the performance of laparoscopic training tasks. Surg Endose 24:170-178. doi:10.1007/s00464-009-0556-6
19. Riojas M, Feng C, Hamilton A, Rozenblit J (2011) Knowledge elicitation for performance assessment in a computerized surgical training system. Appl Soft Comput 11:3697-3708. doi:10.1016/j. asoc.2011.01.041
20. Huang J, Payandeh S, Doris P, Hajshirmohammadi I (2005) Fuzzy classification: towards evaluating performance on a sur-gical simulator. Stud Health Technol Inform 111:194-200 21. Oropesa I, Chmarra MK, Sanchez-Gonzalez P, Lamata P,
Rodrigues SP, Enciso S, Sanchez-Margallo EM, Jansen FW, Dankelman J, Gomez EJ (2012) Relevance of motion-related assessment metrics in laparoscopic surgery. Surg Innov 20: 302-315. doi: 10.1177/1553350612459808
22. Duda RO, Hart PE, Stork DG (2001) Pattern classification, 2nd edn. Wiley, New York
23. Cortes C, Vapnik V (1995) Support-vector networks. Mach Learn 20:273-297
24. Jang J-R (1993) ANFIS: adaptive-network-based fuzzy inference system: systems, man, and cybernetics. IEEE Trans 23:665-685
25. Pérez-Rodríguez R, Marcano-Cedeño A, Costa Ú, Solana J, Cáceres C, Opisso E, Tormos JM, Medina J, Gómez EJ (2012) Inverse kinematics of a 6 DoF human upper limb using ANFIS and ANN for anticipatory actuation in ADL-based physical neurorehabilitation. Expert Syst Appl 39:9612-9622. doi: 10.
1016/j.eswa.2012.02.143
26. Chang C, Lin C (2011) LIBSVM: a library for support vector machines. ACM Trans Intell Syst Technol 2:27. doi: 10.1145/ 1961189.1961199
27. Jain AK, Duin RPW, Mao Jianchang (2000) Statistical pattern recognition: a review: pattern analysis and machine intelligence. IEEE Trans 22:4-37
28. Darzi A, Datta V, Mackay S (2001) The challenge of objective assessment of surgical skill. Am J Surg 181:484^-86
29. Horeman T, Rodrigues SP, van den Dobbelsteen JJ, Jansen FW, Dankelman J (2012) Visual force feedback in laparoscopic training. Surg Endose 26:242-248. doi:10.1007/s00464-011-1861-4
30. Soreide K, Glomsaker T, Soreide JA (2008) Surgery in Norway: beyond the scalpel in the 21st century. Arch Surg 143:1011-1016. doi: 10.1001/archsurg. 143.10.1011
31. Dumon KR, Traynor O, Broos P, Gruwez JA, Darzi A, Williams NN (2004) Surgical education in the new millennium: the European perspective. Surg Clin North Am 84:1471-1491, viii.
doi:10.1016/j.suc.2004.06.005
32. Aggarwal R, Grantcharov T, Moorthy K, Milland T, Papasavas P, Dosis A, Bello F, Darzi A (2007) An evaluation of the feasibility, validity, and reliability of laparoscopic skills assessment in the operating room. Ann Surg 245:992-999

![Fig. 4 Box trainer assessment tasks [21]](https://thumb-us.123doks.com/thumbv2/123dok_es/6825698.835498/5.892.275.815.93.625/fig-box-trainer-assessment-tasks.webp)

![Fig. 7 Classifier plots and Cochran significance probability (p) per surgeons (Ex) = 2] and the output classes [nonskilled (NS) = 1; task](https://thumb-us.123doks.com/thumbv2/123dok_es/6825698.835498/10.892.79.816.86.861/classifier-cochran-significance-probability-surgeons-output-classes-nonskilled.webp)