Supervised Metaplasticity for Big Data:
Application t o Pollutant Concentrations Forecast
J. Fombellida , M.J. Alarcon, S. Torres-Alegre, and D. Andina
Abstract. Artificial Metaplasticity Multilayer Perceptron is a training
algorithm implementation for Artificial Neural Networks inspired in bio-logical metaplasticity property of neurons and Shannon's information theory. It is based on the hypothesis that a higher amount of informa-tion from a Data Set is included in the most atypical data. Using this theory basis a supervised algorithm is developed giving more relevance to the less frequent patterns and subtracting relevance to the more frequent ones. This algorithm has achieved deeper learning on several mutidisci-plinar data sets without the need of a Deep Network. The application of this algorithm to a key nowadays environmental problem: the pol-lutant concentrations prediction in cities, is now considered. The city selected is Salamanca, Mexico, that has been ranked as one of the most polluted cities in the world. The concerning registered pollutants are particles in the order of 10 |xm or less (PMio). The prediction of con-centrations of those pollutants can be a powerful tool in order to take preventive measures such as the reduction of emissions and alerting the affected population. In this paper the results obtained are compared with previous recent published algorithms for the prediction of the pollutant concentration. Discussed and conclusions are presented.
Keywords: Metaplasticity • Big Data • Plasticity • MLP • AMP
Pollutant concentration • Artificial neural network
1 I n t r o d u c t i o n
The air quality in cities is highly impacted depending on the degree of indus-trialization, population density, traffic density, topographical characteristics and meteorological variables [7,8,12] and many other social and environmental char-acteristics. Among the different aspects that have influence on this problem it has been demonstrated that the global and regional variations in the climate together with the topographical conditions of the studied area highly affect the transport and dispersion of pollutants [11,14]. Parallel studies are focused on the appearance of severe episodes of pollution due not only to sudden increases in the concentration of the pollutants but also to certain meteorological conditions that reduce the ability of the atmosphere to disperse the concentrations [9,13].
Among the meteorological parameters that have influence on the pollu-tant concentrations wind patterns, clouds, rain and temperature can affect how quickly pollutants move away from an area. As a consequence of the alterations in the pollutant concentrations the changes in the chemical composition of the atmosphere may produce changes in climate, bring acid rain, destroy the ozone layer and affect the Earth's biodiversity. So it is proved that air quality is deci-sive for human health and the environment. These problems have attracted the interest of researchers, which have developed different forecasting strategies.
In this research we continue with our previous works [6]. The object under study in this article is the prediction of concentrations of PM\Q for the city of Salamanca (Mexico), where they frequently exceed the legislated air quality standards [5]. We propose a model for the prediction of the average concentration of PM\Q for the next 24 h. In the experiments that have been performed in the frame of this investigation several neural networks belonging to the multiplayer perceptron type has been used to classify the patterns in the available databases. To check the possible improvements on the results of pollutant concentration prediction, based on the application of Shannon's theory in this work networks training has been performed using two supervised training methods: first the basic one is a backpropagation method (BPA), and additionally a variation based in the artificial neural metaplasticity theory have been applied.
The first step is to optimize the parameters used in the nominal BPA algo-rithm to be sure that the results obtained with the modifications of the method are compared with the best performance obtained by the classic method. For the second step it is needed to apply probability information about the input patterns, the second experiment uses an estimation of a priori knowledge of the probability of the input distribution considering a Guassian probability distrib-ution in order to improve the results of the basic training method.
For assessing this algorithm's accuracy of classification, we used the most com-mon performance measures: MSE and MAE. The results obtained were validated using the 10-fold cross-validation method.
The remainder of this paper is organized as follows. Section 2 presents a detailed description of the database and the algorithms. In Sect. 3 the experi-mental results obtained are present. A brief discussion of these results is showed in Sect. 4. Finally Sect. 5 summarizes the main conclusions.
2 Materials and Methods
2.1 Study Area
Salamanca city is located in the state of Guanajuato, Mexico, and it has an approximate population of 260 769 inhabitants. The city is 340 km northwest from Mexico City, with coordinates 20°34'09" North latitude, and 101°11'39" West longitude. The Automatic Environmental Monitoring Network (AEMN) was installed in Salamanca in 2007. The system has the necessary instrumen-tation to measure the concentration of criteria pollutants as well as the mete-orological variables. The measured metemete-orological variables are: wind direction (WD), wind speed (WS), temperature (T), relative humidity (RH), atmospheric pressure (AP), precipitation (P) and solar radiation (SR).
2.2 Methodology
The proposed model predicts the average concentration of PM\Q for the next 24 h based on the information provided by the AEMN. The model combines artificial neural networks with clustering algorithms that have been previously applied in order to find relationships among pollutant and meteorological variables. These relationships that are expressed as groups there the inputs are pre-classified help us to get additional information in order to obtain a more accurate prediction model. The clustering algorithm is not part of the study of this article, only the results are used as an input to the network, details can be found on [6].
2.3 Data Preparation
Due to the large amount of signaling information included in the database as well as to the random erroneous measurements, it is necessary to review and refine the gathered information. Interpolation method was used to replace the missing data. For the pre-processing of the data based on different clustering algorithm (K-Means and FCM) PM\Q pollutant concentrations, wind direction, wind speed, temperature and relative humidity were used to create patterns. These patterns were created as follows:
P = [CPM10 , WS, WDI, T, HR] (1)
where, CPM10 is PMio concentration, WS is wind speed, WDI is the Wind
The final network input patterns will contain a label corresponding to the result of the clustering algorithm. In order to compare the results obtained with the ones presented by [6] the same input patterns original groups have been used:
- K-Means: Prediction based on 1 previous day using 8 clusters. - FCM: Prediction based on 1 previous day using 7 clusters.
In both cases the total amount of patterns of the network is 962.
To obtain results statistically independent of the distribution of the patterns a 10 fold cross validation evaluation method has been considered. Using this method the possible dependence of the results with the distribution of the sam-ples in the training or performance evaluation sets is eliminated: all the samsam-ples are used to train the networks and all the samples are used to evaluate the per-formance. For these experiment we have created ten data groups as initial sets to create 10 different final folders. In each one of these final folder the training set that will be used in the experiments as inputs to the networks for training the system and evaluating the evolution of the error in the classification will consists in 9 of the previous 10 groups. The final evaluation of the performance of the network will use the other element. The 10 folders will be created with the variation of the initial set. This is the mathematical basis of the 10 fold cross validation method.
50 initial networks are created using random values. The networks are trained from the same initial conditions (same initial values for weights and biases of the neurons) presenting the information corresponding to each of the 10 folders. Finally the mean values of the results will be calculated to eliminate the possi-ble statistical influence in the results due to the concrete fixed selection of some patterns to train the system and the fixed selection of other patterns to evaluate the results.
2.4 Artificial Metaplasticity Neural Network Model
Based on the theory and applications presented on [3,10,15], for these exper-iments multiplayer perceptron neural networks have been used with a input composed by 6 attributes contained in each single pattern, a hidden layer com-posed by 3 neurons (in previous experiments it has been proved that 3 neurons is enough to get a good level of flexibility to define the decision regions), and an out-put layer with just 1 neuron (that will give us the final result of the prediction).
The activation function used in all the neurons of the system is sigmoid logarithmic. For the experiments we have considered that the input values of the patterns x¿ have to be normalized. The initialization of the weights of the neurons is random but included in an interval [—0.8,+0.8], parameter value a is constant and equal to 1. Doing this so the range of inputs to the activation function a^ujiXi will be limited to the interval [—4.8,+4.8]. Then the initial part of the training is compliant with the premise of not saturating the output of the neurons.
-A-in the MLP learn-A-ing equation that has the properties of a probability density function.
«i;. „
+
!, = .«.(„-,»™l = «í;.
( í
,-^™l (
S
,
So, as the pdf weighting function proposed is the distribution of the input patterns that does not depend on the network parameters, the AMMLP algo-rithm can then be summarized as a weighting operation for updating each weight in each MLP learning iteration as
A*w = w* (x) Aw (3)
being Aw = w (t + I) — w (i) the weight updating value obtained by usual BPA and w* (x) the realization of the described weighting function w* (x) for each input training pattern x.
Metaplasticity Influence Based on the Probability Distribution. The
idea is to use the existing information of the distribution of probability of the inputs to the network to improve the classification results and the speed of the learning curve (being able to use a smaller number of patterns as inputs to the network to obtain the same results, that can be very useful to avoid overspecialization if the data base contains very few available patterns).
In this article we consider that the probability distribution is known a priori: One suboptimal solution tested in this paper for fx (x) is
where w*x (x) is defined as l/fx (x), N is the number of neurons in the MLP
input, and parameters A and B G R+ are algorithm optimization values which
depend on the specific application of the AMLP algorithm. These concrete values will be evaluated in the second part of the experiment. Equation4 is a gaussian distribution, so it has been assumed that X pdf is Gaussian (if it is not the case, the real X pdf should be used instead). Then, w*x (x) has high values for
unfrequent x values and close to 1 for the frequent ones and can therefore be straightforwardly applied in weights updating procedure to model the biological metaplasticity during learning.
3 Results
3.1 Network Characteristics
Structure of the network
- Number of neurons included in the hidden layer: Based on previous expe-rience [6] it has been considered that 3 neurons are considered ideal for a tradeoff between the flexibility in the definition of the decision regions and the complexity of the system.
- Number of neurons in the output layer: 1.
- Activation function: Sigmoid logarithmic with an output included in the interval [0,1].
Conditions considered to finalize the network training:
- Reach a predefined number of inputs presented to the network: 200 iteration (each iteration the whole set is presented to the network). The errors are calculated at the end of each iteration.
3.2 Evaluation M e t h o d
The ANN model performance was evaluated through the following parameters: Mean Absolute Error (MAE) and Mean Square Error (MSE):
1 N
MAE=-Y
J\X
i-Y
i\ (5)
i=l
1 N
MSE=-Y
J\X
i-Y
if (6)
i=l
3.3 Experiments Using K-Means Clustered Inputs
Nominal Backpropagation Algorithm. According to the existing literature
due to the fact the inputs have been normalized to a hypersphere of radius 1 in order to have a training method considered convergent it is necessary that the learning rate is included in the interval (0,1]. Based on this premise the value 1 will be considered as the upper limit for the learning rate in the nominal backpropagation experiments. In this first part of the training we will study the behavior of the nominal backpropagation method maintaining the learning rate inside the theoretical limits. The best results obtained for MSE and MAE corresponds to value rj = 1:
- % MSE = 0.0012 - % MAE = 0.0270
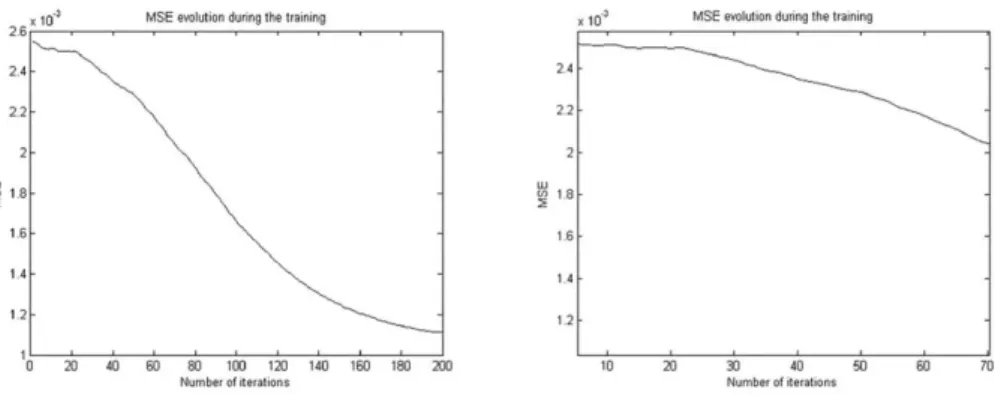
Evolution of MSE error during the training phase is shown in Fig. 1.
Gaussian Function Experiment. The Gaussian function has two parameters
to be optimized: A and B. The experiments show that the optimum values selected are A = 10 and B = 0.55, the results obtained are:
- % MSE = 0.0010 - % MAE = 0.0245
MSE evolution during the training x 1 0'3 MSE evolution during the training 2 4 2.2 2 1.8 1.6 1.4 1.2
.^x
\ \ \ \ \ \ . ^ ^ 2.4 2.2 2¡ 1 . 8
1.6 1.4 1.2 , ^ ^ ^ ^ _ ^ ^ \ ^
0 20 40 80 100 120 140 160 Number of iterations
10 20 30 40 50 Number of iterations
Fig. 1. K-Means - evolution of the MSE error (detail in right figure) r\ = 1 - nominal
backpropagation 2.8 2.6 2.4 2.2 2 1.8 1.6 1.4 1.2 1 0.8t x10'3
20 40
MSE evolution during the training
60 80 100 120 140 Number of iterations
160 180 2(
2.6 2.4 2.2 2 ¡ 1 . 8 1.6 1.4 1.2 1 0 x10'3 10
MSE evolution during the training
20 30 40 50 Number of iterations
60 -^ -" 70
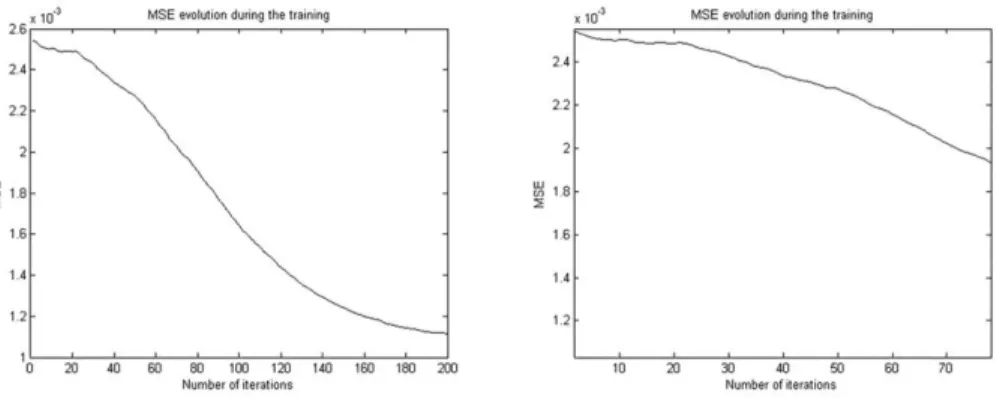
Fig. 2. K-Means - evolution of the MSE error (detail in right figure) , 4 = 1 0 . 6 = 0.55
- Gaussian
3 . 4 E x p e r i m e n t s U s i n g F u z z y C - M e a n s C l u s t e r e d I n p u t s
N o m i n a l B a c k p r o p a g a t i o n A l g o r i t h m . T h e best results obtained for M S E
and M A E corresponds to value r¡ = 1: - % MSE = 0.0012
- % M A E = 0.0267
Evolution of MSE error during t h e training phase is shown in Fig. 3.
G a u s s i a n F u n c t i o n E x p e r i m e n t . T h e o p t i m u m values selected are A = 10
and B = 0.55, t h e results obtained are: MSE = 0.0010
M A E = 0.0245
2.6 2.4 2.2 2 1.8 1.6 1.4 1.2 [ KID"3
20 40
MSE evolutio
60 80
:
''; in I I
n during the training
100 120 140 r of iterations
160 180 200
2.4 2.2 2 w 1.8 2 1 6 1.4 1.2 x10'3 10 MSE evolutic 20 30 Numbi
n during the training
40 50 60 r of iterations
70 -• -"
Fig. 3. Fuzzy CMeans evolution of the MSE error (detail in right figure) r\ = 1
-nominal backpropagation 2.8 2.6 2.4 2.2 2 1.8 1.6 1.4 1.2 1 KID'3
08o 40
MSE evolution during the training
60 80 100 120 140 Number of iterations
160 180 200
2.6 2.4 2.2 2 m 1-8 5 1.6 1.4 1.2 1 KID'3 10
MSE evolution during the training
20 30 40 50 60 Number of iterations
" " " " ^-""^ -" 70
Fig. 4. Fuzzy C-Means - evolution of the MSE error (detail in right figure) A = 10
B = 0.55 - Gaussian
4 Discussion
- The results obtained from the Gaussian metaplasticity improve those recently obtained in [6] both MSE and MAE. We can confirm then that a deeper learn-ing is obtained form the same Data Set just by applylearn-ing the Bio-inspired Metaplasticity. The hypothesis that the patterns with less occurrence fre-quency (atypical data) contain more information than the patterns with more frequency is so reinforced, and this information can be applied in ANN learn-ing to improve the prediction results.
- The results obtained from the variants K-Means and Fuzzy C-Means are very similar between them once the different parameters have been optimized. Differences are considered negligible in both MSE and MAE. The amount of information provided by both types of clustering can be considered similar. - In the detail of the evolution of the error it can be observed that the evolution
Big Data, where atypical p a t t e r n s have usually irrelevant impact in t h e overall learning while being responsible of relevant information, as it must h a p p e n with t h e influence of atypical p a t t e r n s in t h e PM\Q concentrations.
5 Conclusions
In this paper, t h e artificial metaplasticity, a Bio-inspired m e t h o d implemented on classical MLP, has been applied t o t h e nowadays problem of pollutant con-centration risk estimation. T h e goal of this research was t o improve t h e accuracy of t h e prediction in previous recent published results while reducing t h e training time. T h e results show t h a t t h e use of t h e A M M L P algorithm is an option for accurate pollutant concentration prediction and could be used as a computer aided system for taking decisions protecting public health. It also con be con-cluded t h a t atypical p a t t e r n s in t h e continuously growing D a t a Set of measures can be responsible of significant changes in PM^o, and most similar prediction m e t h o d s are not considering properly their value for t h e overall performance of t h e prediction.
References
1. U.S.EPA: U.S. Environmental Protection Agency (2012). www.epa.gov/air/
airpollutants.html
2. SESA: Spanish acronym for Spanish Society of Environmental Health (2008). http://www.sanidadambiental.com/2008/08/19/environment-and-health/
3. Andina, D., Ropero-Pelaez, J.: On the biological plausibility of artificial metaplas-ticity learning algorithm. Neurocomputing (2012). doi:10.1016/j.neucom.2012.09. 028
4. Andina, D., Alvarez-Vellisco, A., Jevtic, A., Fombellida, J.: Artificial metaplasticity can improve artificial neural network learning. Intell. Autom. Soft Comput. Spec. Issue Signal Process. Soft Comput. 15(4), 681-694 (2009)
5. Barron-Adame, J.M., Cortina-Januchs, M.G., Vega-Corona, A., Andina, D.: Unsu-pervised system to classify SO2 pollutant concentrations in Salamanca, Mexico. Expert Syst. Appl. 39, 107-116 (2012)
6. Cortina-Januchs, M.G., Quintanilla-Dominguez, J., Vega-Corona, A., Andina, D.: Development of a model for forecasting of PM10 concentrations in Salamanca, Mexico. Atmos. Pollut. Res. 6, 626-634 (2015). doi:10.5094/APR.2015.071
7. Celik, M., Kadi, I.: The relation between meteorological factors and pollutants concentration in Karabuk city. G.U. J. Sci. 20, 89-95 (2007)
8. D'Amato, G., Cecchi, L., D'Amato, M., Liccardi, G.: Urban air pollution and climate change as environmental risk factors of respiratory allergy: an update. J. Investig. Allergol. Clin. Immunol. 20, 95-102 (2010)
9. Elminir, H.K.: Dependence of urban air pollutants on meteorology. Sci. Total Env-iron. 350, 225-237 (2005)
11. Lee, S.H., Sung, Y.H., Lee, H.W.: Impact of regional trans-boundary ozone asso-ciated with complex terrain on urban air quality. Atmos. Environ. 42, 7384-7396 (2008)
12. Nagendra, S.M.S., Khare, M.: Artificial neural network based line source models for vehicular exhaust emission predictions of an urban roadway. Transp. Res. Part D-Transp. Environ. 9, 199-208 (2004)
13. Pearce, J.L., Beringer, J., Nicholls, N., Hyndman, R.J., Tapper, N.J.: Quantifying the influence of local meteorology on air quality using generalized additive models. Atmos. Environ. 45, 1328-1336 (2011)
14. Perez, P., Trier, A., Reyes, J.: Prediction of PM2.5 concentrations several hours in advance using neural networks in Santiago, Chile. Atmos. Environ. 34, 1189-1196 (2000)