Gradient induced artifacts in simultaneous EEG-fMRI: Effect of
synchronization on spiral and EPI k-space trajectories
A.B. Solana , JA Hernández-Tamames , E. Manzanedo , R. García-Álvarez , F.O. Zelaya , F. del Pozo
A B S T R A C T
The nature of the gradient induced electroencephalography (EEG) artifact is analyzed and compared for two functional magnetic resonance imaging (fMRI) pulse sequences with different k-space trajectories: echo planar imaging (EPI) and spiral. Furthermore, the performance of the average artifact subtraction algorithm (AAS) to remove the gradient artifact for both sequences is evaluated. The results show that the EEG gradient artifact for spiral sequences is one order of magnitude higher than for EPI sequences due to the chirping spectrum of the spiral sequence and the dB/dt of its crusher gradients. However, in the presence of accurate synchronization, the use of AAS yields the same artifact suppression efficiency for both pulse sequences below 80 Hz. The quality of EEG signal after AAS is demonstrated for phantom and human data. EEG spectrogram and visual evoked potential (VEP) are compared outside the scanner and use both EPI and spiral pulse sequences. MR related artifact residues affect the spectra over 40 Hz (less than 0.2 uV up to 120 Hz) and modify the amplitude of PI, N2 and P300 in the VEP. These modifications in the EEG signal have to be taken into account when interpreting EEG data acquired in simultaneous EEG-fMRI experiments.
1. Introduction
Most functional magnetic resonance imaging (fMRI) studies are based on gradient-echo echo planar imaging (EP1). However, GE-EP1 is highly affected by magnetic field inhomogeneities causing both local image distortion and signal dropout, mainly in brain areas near air-tissue interfaces [1]. Spiral in-out techniques are a promising alternative as they provide advantages in the study of those brain areas [2]. However, spiral imaging is hardware demanding, and its k-space trajectories incorporate slew rate-limited and amplitude-limited regimes [2,3]. These hardware constraints in the spiral pulse sequence profiles affect the gradient induced artifact [4-6] features that are commonly observed in simultaneous electroencephalography (EEG) and functional magnetic resonance imaging (fMRI) acquisition
[7], increasing the amplitude of the artifact in some instances by up to one order of magnitude higher than when EPI sequence is used [8],
As it has been reported in recent publications [9,10], synchroni-zation of both the EEG system and the MR scanner is necessary to achieve an optimal removal of the gradient artifact using artifact average subtraction (AAS) techniques, developed originally by Allen
et al. [4]. These reports showed that the performance of the algorithm is maximized when the clocks of the MR and EEG systems are synchronized, (phase-locked clocks) and when repetition time (TR) is a multiple of the EEG sampling interval.
The primary aims of this article are, first, to provide a comprehen-sive characterization of the EEG gradient artifact depending on the fMRI pulse sequence and, second, to demonstrate the impact of synchroni-zation and pulse sequence in its subsequent elimination. A conven-tional GE-EP1 sequence and a spiral K-space filling fMRI sequence (GE-SPRLIO) [2] were used for phantom and human data. To our knowledge, this is the first work that analyzes the impact of using non-EP1 sequences in EEG signal quality in non-simulated data and in presence of synchronization schemes for simultaneous EEG-fMRI.
2. Materials and methods
2.1. EEG data acquisition
Five phantom sessions were repeated with the same MR protocol including an EEG acquisition of 6 minutes inside the scanner without any pulse sequence running. For the phantom data, the EEG cap was fitted to a water spherical MR phantom previously covered with Abralyt 2000 electrolyte paste in order to capture a pure gradient artifact. For simplicity, the induced EEG signals in the phantom experiment will be called 'EEG to make easier to understand the applied methodology, equivalent to the one applied with a human subject.
Data from the human volunteers were obtained with eyes closed and during a visual task.
The visual task was repeated inside and outside the MR scanner in order to recover the visual evoked potential (VEP) as a measurement of EEG quality across trials. The design was thought to be valid for both techniques, EEG and fMRI, so it was designed as a mixed event-block paradigm described as follows:
- The paradigm consisted of the presentation of photos of objects with the same background color and with neutral emotional content. - The task lasted 5 minutes and 30 seconds and was divided in
5 cycles of 20 seconds rest and 42 seconds of image presentation (one block). Each block consisted of 12 images.
- Each image was present on the screen during 1 second, and the interstimulus time was randomized to be 2 seconds, 2.5 seconds or 3 seconds. Each of these interstimulus times appeared 4 times per block. During rest and during the interstimulus time, a fixation-cross appeared on the screen.
- To maintain the attention during the task and to obtain a VEP with P300 wave, the subjects were instructed to store the images in their memories.
- Three versions of the task were available to be done to the same person (one of them outside the scanner, and two inside the scanner with two different MR pulse sequences or parameters.)
A Visuastim digital system (Resonance Technology Inc.) was used to show the images to the subject inside the scanner using MR compatible goggles. Superlab 4.5 was used to program the visual task. The system was synchronized with the MR scanner using the TTL trigger pulse. The first MR trigger pulse that was sent after the MR dummy volumes began the task. Additionally, a National Instruments USB-6009 digital card was attached to the computer where Superlab 4.5 was running. This card was used to send a mark to the EEG recording software program immediately before each new image stimulus presentation happened.
The local ethics committee approved these experiments, and informed consent was obtained from the volunteers.
2.2. MR1 data acquisition
2.3. Data analysis: gradient artifact and pulse sequence
MATLAB R2009a was used to plot the pulse sequence X, Y and Z gradients and the EEG signal of one of the individual channels located in the left central cortex (channel C3), during the acquisition of one image slice from the phantom data for each type of sequence, GE-EPI and GE-SPRLIO.
2.4. Data analysis: EEG signal quality assessment (phantom data)
Since the removal of the gradient artifact using AAS [4] depends on the repeatability of the waveform across volumes [8,9], a preliminary analysis of the performance of AAS was made for both kinds of sequences with and without synchronization. EEG signal (100 volumes) was segmented in TR periods taking the MR trigger marker signal as reference for the EEG segmentation. A realignment procedure was used prior to this preliminary analysis and to the application of the AAS for the cases without synchronization to minimize the variability across successive volumes. Then, the mean and the standard deviation per time point (taking EEG channel C3 as representative channel) were computed for all the segments in each condition.
We applied the AAS algorithm [4] as implemented in Brain Vision Analyzer 2.0, using a sliding window of 21 volumes to compute the artifact template. After AAS, EEG signal was subsampled to 500 Hz. Finally, the spectral content of EEG signals between 0.5-125 Hz was measured using the average voltage density (VSD; uV/Hz) with a Welch spectral estimation of 1024 windowed samples (2.048 seconds) in MATLAB R2009a [11]. Two quantitative measurements were extracted from the obtained voltage density spectra. First, the effectiveness of the AAS was calculated as the attenuation of signal amplitude Eq. (1) due to the AAS and compared with the background noise Eq. (2) at the slice frequency and harmonics [10]. The previous metric is a local measurement as it is calculated for specific affected frequencies; a local better AAS performance is obtained when the attenuation from Eq. (2) is equal to the attenuation calculated in Eq. (1). Second, the Euclidean distance was calculated as a global measure of the similarity between the background spectrum and each corrected spectrum for each pulse sequence as indicated in Eq. (3) for the range of frequencies defined by f0-fmax (l-125Hz in the phantom case).
Attr, i(/) = -20-(og1 fVSDcorrected
VSDuncorrected/
A^backgroundif) — — 2 0 • logí0 Í fVSDbackground
VSDuncorrected/
(i)
(2)
Euclidean Distance
--A
¡=/o J2 (VSDcorrectedi - VSDbackground¡)2 (3)MRI data were collected with a 3.0 T HDxt General Electric MR scanner using a whole-body radiofrequency coil for signal excitation and an 8-channel brain coil for reception.
Single-shot GE-EPI and GE-SPRLIO spiral in-out [2] fMRI acquisition parameters were: acquisition matrix: 64 x 64, voxel dimension: 3.75 x 3.75 x 4-mm, 100 whole brain volumes consist-ing of 36 near-axial slices with TE = 28 ms/TR2880 ms were acquired (TR = 2880.72 ms for the non-synchronization scheme).
The simultaneous EEG-fMRI acquisition for the phantom data was repeated for the following conditions: (i) in the absence of any pulse sequence (background noise inside the scanner); (ii) GE-EPI without synchronization (iii) SPRLIO without synchronization; (iv) GE-EPI with synchronization; and, (v) GE-SPRLIO with synchronization. The human data were acquired in the following conditions: (i) in the absence of sequences, (vi) EPI with synchronization and (vii) GE-SPRLIO with synchronization.
2.5. Data analysis: EEG signal quality assessment (human data)
For both, the resting fMRI with closed eyes and the visual task series EEG epochs, after the removal of gradient artifact with AAS, the pulse-related artifact (PA) was removed using an independent components analysis (ICA) approach [12]. The same ICA was used to remove blinks from visual task series.
Gradient X - G E - E P l
(i) Gradient Artefact of channel C3 (1 slice) - GE - EPI without synchronization
0.03 0.04 0. Time (s)
Gradient Y - G E - E P l
0.03 0.04 0. Time (s)
Gradient Z - G E - E P l
3.03 0.031 0.032 0.033 0.034 0.035 0.036 0.037 0.038 0.039 0.04 Time (s)
(ii) Gradient Artefact of channel C3 (1 slice) - GE - EPI with synchronization 0.02 0.03 0.04 0.05
Time (s)
Gradient Artefact in EEG channel C3 (1 slice)
Gradient X - G E - S P R L I O
x1cfii) Gradient Artefact of channel C3 (1 slice - GE - SPRLIO without synchronization
0.03 0.04 0.0E Time (s)
Gradient Y - G E - S P R L I O
0.03 0.04 0.05 Time (s)
G r a d i e n t Z - G E - S P R L I O | 0.03 0.031 0.032 0.033 0.034 0.035 0.036 0.037 0.038 0.039 0.04 Time (S)
x104 iv) Gradient Artefact of channel C3 (1 slice - G E - SPRLIO with synchronization
_ x-\04
0.02 0.03 0.04 0.05 Time (s)
Gradient Artefact in EEG channel C3 (1 slice)
0.03 0.04
Time (s) 3.03 0.031 0.032 0.033 0.034 0.035 0.036 0.037 0.038 0.039 0.04
(i) Background noise
0 20 40 60 Frequency (Hz)
60
50
40
30
20
10
1
• 1 ii 1 1
LL
i
(iv) After AAS: GE - EPI without synchronization
0 20 40 60 8C Frequency (Hz)
100 120
700
600
| 500
£" 400
¿
3 300
u:
= 200
100
(iii) Before AAS: GE - Spiral
|
A I .. 1
J^
0 20 40 60 8C Frequency (Hz)
1.4
r:
j o ,. 0 . 6 j 0.4
0.2
i
V
' ll
"J
V
v7 '
" 1 1
1
Uu
0 20 40 100 120
Frequency (Hz)
(v) After AAS: GE - SPIRAL without synchronization 1.6 —
1.4
y y y J I
0 2 0 40 60 8C
Frequency (Hz)
1.6 1.4
f:
*
, . . ! : :
0.2
(vi) AHer AAS: GE
1 y
v 1 V ll
- EPI with syncrhonization
y y 1 ^k
0 2 0 40 100 120
(vii) After AAS: GE - Spiral with syncrhonization
1.4 1.2
0.8 0.6 0.4 0.2
1 1 1 III *
v
1
0 2 0 40 60 8C Frequency (Hz)
100 120
(i) In absence of sequence after PA correction (ii) After AAS and PA correction: GE - EPI
0 20 40 60 8C Frequency (Hz)
100 120 0 20 40 60 Frequency (Hz)
(iii After AAS and PA correction
i
40 60 80 G E-±
100
SPIRAL
120
0 20 40 60 80 Frequency (Hz)
100 120
120 ,— 100 80 60 40 20 -I Background
I EPI Sync I EPI No Sync
0 12.5 25 37.5 50 62.5 75 87.5 100 112.5120
Frequency (Hz)
I Background
I Spiral Sync I Spiral No Sync
< 50
-37.5 50 62.5 75
Frequency (Hz)
87.5 100 112.5120
Fig. 3. Attenuation of signal amplitude (-201ogl0[corrected/uncorrected]) after AAS for
GE-EPI (top) and GE-SPRLIO (bottom) compared with the background noise (-201ogl0 [background/uncorrected]) at the slice frequency (12.5 Hz) and harmonics.
Then, two measurements were obtained: VEPs (reflecting the low frequency) and ERSP (event-related spectral power, reflecting the spectral content in a higher range of frequencies). First, the segments from the occipital electrodes (01, 02, Oz and POz) were averaged to obtain a unique occipital VEP per subject per condition. Second, the mean spectral content (ERSP) of all the segments from the same occipital electrodes between 0.5-80 Hz was measured using the average voltage density (uV/Hz) with a Welch spectral estimation of 512 windowed samples in MATLAB R2009a [11],
Three resting closed eyes epochs were extracted from the EEG signal of a subject, (a) in the absence of sequence, (b) with GE-EPI, and (c) with GE-SPRLIO. The spectral content of EEG signals between 0.5-125 Hz was measured using the average voltage density (uV/Hz) with a Welch spectral estimation of 1024 windowed samples (2.048 seconds) in MATLAB R2009a [11]. The Euclidean distance in Eq. (3) was also calculated between the spectra in the absence of sequence and for each kind of pulse sequence for two frequency ranges: 1-125 Hz and 11-125 Hz. The second frequency range was introduced to avoid the influence of different performance of the pulse-related artifact removal algorithm in the lower part of the spectrum, out of the scope of this work.
3. Results
3.1. Gradient artifact and pulse sequence
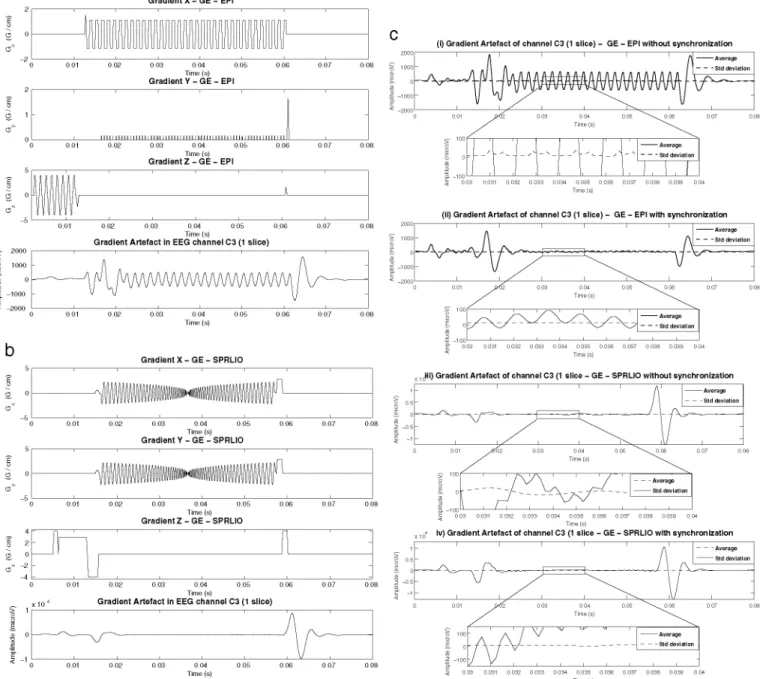
Examples of the EEG induced gradient artifact waveform for the same session, in channel C3 (see Appendix A) for both GE-EPI and GE-SPRLIO, are illustrated in Fig. l(a-b). Time zero corresponds to the beginning of the MR pulse generation for one slice. The artifact oscillations in the EEG signal begin with the application of the slice selective (Z) gradient that it is simultaneous to the excitation RF pulse. These oscillations correspond to an additive temporal derivative of the commutation of gradients [6] where the maximum amplitudes happen with simultaneous and sharp changes in them. The maximum amplitude of the gradient artifact is due to the crusher gradients at the end of the readout in both sequences. However, it is larger in GE-SPRLIO because the amplitude transition (dB/dt) in its crusher gradients is larger than in GE-EPI. Moreover, they appear in the three gradient axes almost simultaneously.
During the readout period GE-EPI gradient artifact presents a sinusoidal oscillation of approximately 700 Hz for the parameters of the study (zoom information in Fig. lc(ii)). The EEG system hardware BPF attenuates frequencies beyond 250 Hz following a decay of 30 dB/ octave leaving these attenuated oscillations at 700 Hz in the GE-EPI gradient artifact during readout. By contrast, for the GE-SPRLIO, the readout oscillations are constantly varying causing a chirping spectrum for its derivative. This causes the gradient artifact during readout periods to exhibit power in the low frequency range, as can be observed in Fig. lc(iv).
3.2. EEG signal quality assessment (phantom data)
Fig. lc (i-iii) shows that the standard deviation contains some amount of residual signal related to the gradient artifact waveform when running without synchronization whilst full synchronization allows it to remain near baseline and comparable to the background noise (Fig. lc (ii-iv)).
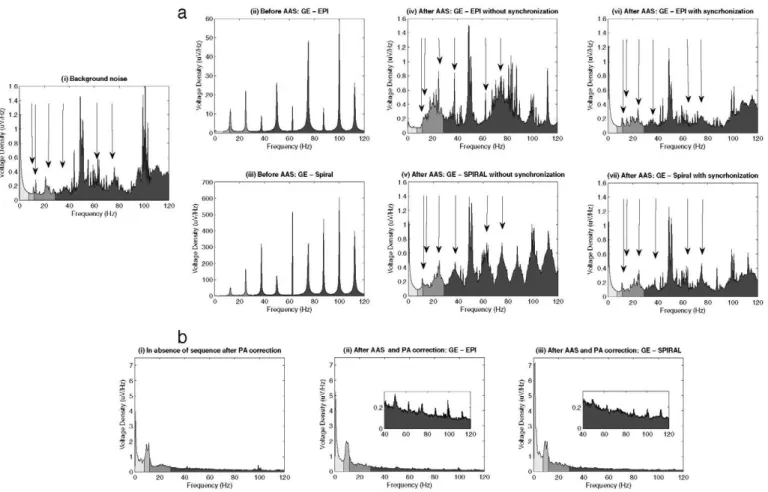
In Fig. 2a the results of the spectral analysis for the seven different EEG experimental conditions for the phantom data are presented. The maximum spectral density before AAS (Fig. 2a (ii-iii)) is concentrated at the slice acquisition frequency (12.5 Hz, as shown in Eq. (4)) and its harmonics for both sequences,
st = TR/ns = 2880ms/36 = 80ms
->s/ = 1/st = l/80ms = 12.5Hz (4)
where st is the time to acquire one slice, ns is the number of slice per TR and sf is the frequency for each slice acquisition time.
For GE-SPRLIO, the peak amplitudes are around one order of magnitude higher than for GE-EPI, and the attenuation after AAS is also more than 20 dB higher for GE-SPRLIO (Fig. 3). In Fig. 2a (iv-v) it can be seen that peaks of power density at the slice frequency and harmonics remain in the spectrum when there is no synchronization; this causes a broader distortion around the slice frequency harmonics for GE-SPRLIO. Fig. 2a (vi-vii) shows that with a synchronization scheme, the
Table 1
Euclidean distance: background spectrum vs. corrected sequence spectra.
GE -EPI No Sync
GE - Spiral No Sync
GE - EPI Sync
GE - Spiral Sync
Euclidean distance (au.)
4,23 3,2 2,42 2,3
Table 2
Euclidean distance: in the absence of sequence spectrum vs. corrected spectra.
EPI SPRLIO EPI SPRLIO (2 Hz-125 Hz) (2 Hz-125 Hz) (11 Hz-125 Hz) (11 Hz-125 Hz)
Euclidean 1.38 distance (a.u.)
Visual ERP: subject 1 Visual ERSP subject 1: Outside Visual ERSP subject 1: EPI Visual ERSP subject 1: Spiral
20
15
I
1 0
03 3 5
Q.
1 °
-6
-10
Outside
EPI
^ P I P A I
l i
' / I
A' .7 i
í \ i
- ' / ^ ^ & .
200 Time (ms) Visual ERP: subject 4
Outside
EPI
SPIRAL
>jj
[A \ y~
1 *VJCv\^ ^",'
L7 - i
200
Time (ms)
Frequency (Hz
Visual ERSP subject 4: Outside Visual ERSP subject 4: EPI Visual ERSP subject 4: Spiral
20 40 60
Frequency (Hz;
Fig. 4. VEP and ERSP of two subjects during three conditions: outside the MR scanner, during GE-EPI and during GE-SPRLIO, both with synchronization.
obtained spectrum for both sequences is most similar to the background noise recorded in the l-70Hz band. However, it can be seen that the peaks of amplitude in the harmonics of slice frequency over 70 Hz are higher for GE-SPRLIO. In Fig. 3 and Table 1 we show that the synchronization setup is always closer to the background spectrum for both sequences in the harmonics of the slice frequency up to 120 Hz.
3.3. EEG signal quality assessment (human data)
Fig. 2b shows the results of the spectral analysis for one of the subjects, which confirmed that after gradient and pulse-related artifacts correction for both sequences, GE-EPI and GE-SPRLIO, a suitable EEG spectrum profile could be extracted. However, for both sequences there are some power density residuals at harmonics of the slice frequency, but they show the same order for EPI and GE-SPRLIO. Additionally, the Euclidean distances between the spectrum in the absence of sequence and after correcting each kind of pulse sequence are shown in Table 2. This global quantitative measure-ment show that for a frequency range between 11-125 Hz the AAS performance is better for the human data and in the same range of values for GE-EPI and GE-SPRLIO.
Fig. 4 depicts the extracted VEPs and ERSPs for two of the subjects obtained during the three similar tasks under the following three conditions: outside the scanner; during GE-EPI with synchronization; and, during GE-SPRLIO with synchronization. The subjects shown in
Fig. 4 were selected because they obtained better performance of the task measured by less errors in the identification task and clearer VEP outside the scanner. The main VEP waves Nl, PI and N2 and the cognitive evoked response P300 are easily observed for the three cases in similar instants for both subjects. The ERSPs show the main activity of the segments that appears in low frequencies for the three conditions. The VSDs for GE-EPI and GE-SPRLIO show some spiky
residues of low amplitude in higher frequencies in the spectrum but of the same range for both pulse sequences (below 0.2 uV/Hz).
4. Discussion
The main sources of inadequate EEG gradient induced artifact suppression arise from the intrinsic subsampling performed by the EEG system (5 kHz). The first removal approach is to obtain the same sampled signal every MR acquisition volume. For that purpose, the two main requirements are: first, that TR is multiple of the EEG sampling interval and, second, that both systems use of the same clock signal (EEG system and MR Scanner) [9,10]. This is the reason why it is necessary to ensure that the actual TR is always verified for every fMRl sequence acquisition, when making simultaneous EEG-fMRl recordings.1 Fig. 2a (vi-vii) illustrates how the voltage density
of the corrected EEG signal is similar to the background noise in the 1-40 Hz band when full synchronization is achieved for the phantom. The residues in the human data for both sequences for the resting state data and the ERSP (Fig. 4) are below 0.2 uV up to 120 Hz. In a previous work [8] comparing the gradient-induced artifact of EPI and spiral trajectories in simulated-only or phantom-based-simulated data, it was pointed out that the EEG quality in the alpha band was unacceptable.
However, these authors used a very different synchronization scheme from the one used in this work. In addition, the residues of
1 The authors would like to indicate that General Electric MR GE-EPI clinical
Phantom Background noise C3 Phantom After AAS: GE - EPI C3 Phantom After AAS: GE - Spiral C3
20 40 60 80 100
Frequency (Hz
Phantom Background noise F3
40 60 80
Frequency (Hz)
Phantom After AAS: GE - EPI F3
1.5
I
S 1t
20 40 60 80 100
Frequency (Hz)
Phantom Background noise Cz
3 40 60 80 1(
Frequency (Hz)
Phantom After AAS: GE - EPI Cz
20 40 60 80 100
Frequency (Hz
40 60 80
Frequency (Hz)
>
20 40 60 80 100 120
Frequency (Hz)
Phantom After AAS: GE - Spiral F3
20 40 60 80 100 120
Frequency (Hz)
Phantom After AAS: GE - Spiral Cz
20 40 60 80 100 120
Frequency (Hz)
x10 Gradient artefact for EPl, Spiral SPRLIO and Spiral SPEP
— EPl
-Spiral SPRLIO • • Spiral SPEP
1 3
I ! : I f : IIV l|
0 10 20 30 40 50 60 70
Time (ms)
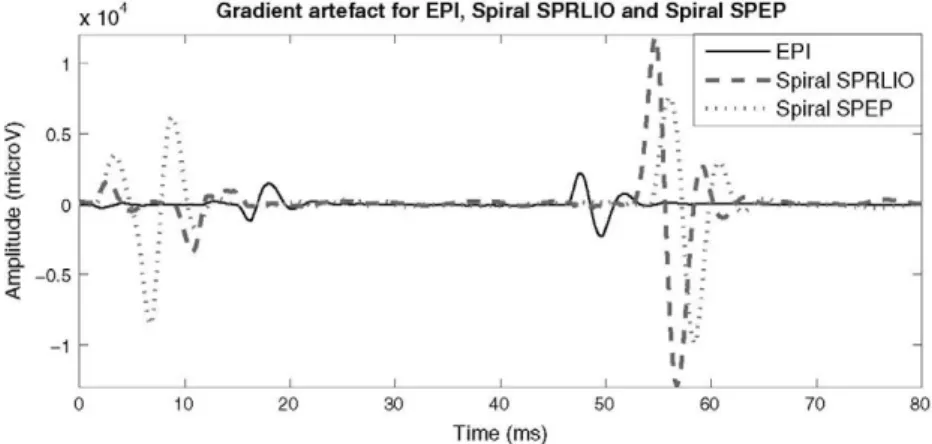
Fig. 6. Gradient artifact for two spiral fMRI pulse sequences (GE-SPRLIO and SPEP) and EPL
the gradient artifact at higher harmonics in the human data have the same order of magnitude for both sequences due to the fact that phantom recordings have higher eddy currents that increase the gradient artifact in the induced EEG signal and also because the PA removal approach also removes some residual gradient artifact from the EEG signal. We have also shown that the VEPs can be extracted for the simultaneous EEG-fMRI acquisition for both sequences as a measurement of quality. However, we observed during the preprocessing of the data that the ICA step for the elimination of the pulse-related artifact and the ocular artifact is crucial to obtain good VEPs.
Other spiral sequences show also higher gradient crushers com-pared to EPl and chirp spectrum (see Appendix A) [13], generating higher amplitude gradient-induced artifacts. This leads to higher residues at higher frequencies after AAS [14] and more sensitivity to the lack of synchronization, according to the result in Fig. 2a (v). Small differences in the sampling scheme cause large induced gradient artifacts in the EEG signal due to the larger dB/dt. For the same reason, small spatial shifts of the EEG electrodes, such as the ones produced by head movement in human studies [15] could be an important drawback for spiral-based fMRI sequences.
5. Conclusion
Our results have shown that full synchronization is a crucial key for the optimization of gradient artifact correction, independent of the applied pulse sequence (e.g., EPl or spiral); and that there are substantial differences in the nature of the gradient induced EEG signal artifact, for at least two of the most common fast imaging methods. This work contains, to our knowledge, the first quantitative comparison between the effects of spiral acquisition methods and conventional EPl in the same session, for real data in both phantom and human subjects. The EEG signal modifications in simultaneous EEG-fMRI recordings have to be taken into account when interpret-ing EEG data in this kind of experiments.
Acknowledgments
The authors would like to thank Professor Gary H. Glover and Dr Stephen Wastling for technical MR support. We also want to thank Dr. Marcos Rios for the design of the visual task. Fudnación CIEN-Fundacion Reina Sofia, Centro de Investigación en red Ciber-BBN, projects MADR.IB S-SAL-312-2006 by Comunidad de Madrid and TEC2009-14587-C03-02 by Spanish Government, Consejo Social of Universidad Politécnica de Madrid and fellowship RR02/2009 (UPM) have provided funds towards this project.
Appendix A
In reference [6] it is indicated that the amplitude and polarity of gradient artifact changes along channels, but the timing character-istics in all the channels are similar.
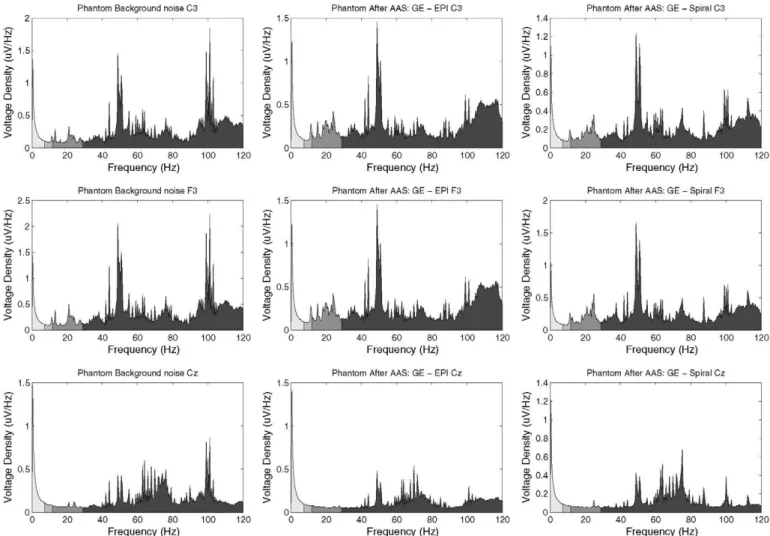
So, as the positioning of the phantom inside the MR scanner can cause differences in the gradient artifact that is induced [9,10], the scanning within each phantom session were made without moving the phantom, and all the comparisons were also made within session. The results are shown only for one representative channel (C3) as other authors have done in similar papers [8-10]. In order to show similar results for other channels Fig. 5 shows channel C3, F3 (worst case representative) and Cz (best case representative) before and after AAS for EPl and spiral. The same conclusions extracted by comparing C3 can be made for the other two channels.
We have used another spiral-based sequence, a spiral sequence known as 'SPEP' provided by the Functional MRI lab at University of California at San Diego [13]. The gradient-induced artifact amplitude in SPEP is of the same order of magnitude and characteristic associated frequencies of SPRLIO, but it is not exactly the same in onset time and waveform because the pulse sequence profile differs from SPRLIO. This is shown in Fig. 6.
As we stated, the spiral trajectories have a broader spectrum that will affect most of the frequencies (independent of the specific pulse sequence). And, as also stated in the manuscript, the main distortion in the EEG signals will be due to higher crusher gradients and simultaneous in different axis. This will happen in all kind of sequences if the crushers are of high amplitude. There is undoubt-edly a large family of spiral and EPl sequences used in different labs by the research community; but we chose to analyze the ones that generically contain the main features found in all sequences.
References
[1 ] Weiskopf N, Hutton C, Josephs O, Turner R, Deichmann R. Optimized EPl for fMRI studies of the orbitofrontal cortex: compensation of susceptibility-induced gradients in the readout direction. Magn Reso Mater Phys 2007;20:39-49.
[2] Glover GH, Law CS. Spiral-in/out BOLD fMRI for increased SNR and reduced susceptibility artifacts. Magn Reson Med 2001;46:515-22.
[ 3 ] Bornert P, Schomberg H, Aldefeld B, Groen J. Improvements in spiral MR imaging. Magn Reson Mater Phys 1999;9:29-41.
[4] Allen PJ, Josephs O, Turner R. A method for removing imaging artifact from continuous EEG recorded during functional MRI. Neuroimage 2000;12:230-9.
[5] Ritter P, Becker R, Graefe C, Villringer A. Evaluating gradient artifact correction of EEG data acquired simultaneously with fMRI. Magn Reson Imaging 2007;25:923-32.
[6] Yan WX, Mullinger KJ, Brookes MJ, Bowtell R. Understanding gradient artefacts in simultaneous EEG/fMRI. Neuroimage 2009;46:459-71.
[8] Ryali S, Glover GH, Chang C, Menon V. Development, validation, and comparison of ICA-based gradient artifact reduction algorithms for simultaneous EEG-spiral in/out and echo-planar fMRI recordings. Neuroimage 2009;48:348-61.
[9] Mandelkow H, Haider P, Boesiger P, Brandéis D. Synchronization facilitates removal of MRI artefacts from concurrent EEG recordings and increases usable bandwidth. Neuroimage 2006;32:1120-6.
[10] Mullinger KJ, Morgan PS, Bowtell RW. Improved artifact correction for combined electroencephalography/functional MRI by means of synchronization and use of vectorcardiogram recordings. J Magn Reson Imaging 2008;27:607-16.
[11] Welch P. The use of Fast Fourier Transform for the estimation of power espectra: a method based on time averaging over short, modified periodograms. IEEE Trans Audio Electroacustics 1967;15:70-3.
[12] Srivastava G, Crottaz-Herbette S, Lau KM, Glover GH, Menon V. ICA-based procedures for removing ballistocardiogram artifacts from EEG data acquired in the MRI scanner. Neuroimage 2005;24:50-60.
[13] Wong EC, Buxton RB, Frank LR. Implementation of quantitative perfusion imaging techniques for functional brain mapping using pulsed arterial spin labeling. NMR Biomed 1997;10:237-49.
[14] Mullinger KJ, Yan WX, Bowtell R. Reducing the gradient artefact in simultaneous EEG-fMRI by adjusting the subject's axial position. Neuroimage 2011;54:1942-50.
![Fig. 3. Attenuation of signal amplitude (-201ogl0[corrected/uncorrected]) after AAS for](https://thumb-us.123doks.com/thumbv2/123dok_es/6816960.834760/5.877.48.423.76.510/fig-attenuation-signal-amplitude-ogl-corrected-uncorrected-aas.webp)