Immune response on rabbit does of different genetic types subjected to reproductive, environment and immunologic challenges
222
0
0
Texto completo
(2)
(3) AUTORIZACIÓN DE LOS DIRECTORES DE TESIS PARA SU PRESENTACIÓN. Los Dres. JUAN MANUEL CORPA ARENAS y JUAN JOSÉ PASCUAL AMORÓS, como Directores de la Tesis Doctoral “Immune response on rabbit does of different genetic types subjected to reproductive, environment and immunologic challenges”, realizada en el Departamento de PRODUCCIÓN Y SANIDAD ANIMAL, SALUD PÚBLICA VETERINARIA Y CIENCIA Y TECNOLOGÍA DE LOS ALIMENTOS, por la Doctoranda Dña. SELENA FERRIAN, autorizamos la presentación de la citada Tesis Doctoral, dado que réune las condiciones necesarias para su defensa.. En Valencia, a 18 de diciembre de 2012. Los Directores de la Tesis.. Fdo. Dr. Juan Manuel Corpa Arenas. Fdo. Dr. Juan José Pascual Amorós.
(4)
(5) D. Juan Manuel Corpa Arenas, Profesor Catedrático del área de conocimiento de Sanidad Animal y Anatomía Patológica Comparadas, adscrito al Departamento de Producción y Sanidad Animal, Salud Pública Veterinaria y Ciencia y Tecnología de los Alimentos: Universidad CEU Cardenal Herrera y D. Juan José Pascual Amorós, Profesor Catedrático del área de conocimiento de Producción Animal, adscrito al Departamento de Ciencia Animal: Universidad Politécnica de Valencia,. INFORMAN:. Que el trabajo titulado Immune response on rabbit does of different genetic types subjected to reproductive, environment and immunologic challenges, del que es autora Dña. Selena Ferrian, Graduada en Ciencias y Tecnólogias de la Producción Animal por la Facoltá di Agraria de la Universitá degli Studi di Bologna y con Máster en Producción Animal por la Universidad Politécnica de Valencia, ha sido realizado bajo nuestra dirección y cumple las condiciones exigidas para optar al Grado de Doctor Internacional en Ciencias de la Salud. Y para que conste, firmo el presente en Valencia, a dieciocho de diciembre de dos mil doce.. Fdo. Dr. Juan Manuel Corpa Arenas. Fdo. Dr. Juan José Pascual Amorós.
(6)
(7) Este trabajo ha sido financiado por los siguientes proyectos de investigación de varias entidades: Universidad CEU Cardenal Herrera (Banco Santander/CEU-UCH: Programa Copernicus (PRCEU-UCH/COOP 01/08), Generalitat Valenciana (ACOMP/2009/207 y ACOMP/2010/062) y la Comisión Interministerial de Ciencia y Tecnología (AGL200800273/GAN y AGL2011-30170-CO2-02). Igualmente la doctoranda ha disfrutado de una beca otorgada por la Generalitat Valenciana - Programa Santiago Grisolía (GRISOLIA/2009/073- GRISOLIA 09/36)..
(8)
(9) Dedicada a mi familia y a mis amigos.
(10)
(11) AGRADECIMIENTOS Al finalizar un trabajo tan dificultoso como el desarrollo de una tesis doctoral es inevitable afirmar que ese aporte hubiese sido imposible sin la participación de personas e instituciones que han facilitado las cosas para que este trabajo llegue a un feliz término. Por ello, es para mí un verdadero placer utilizar este espacio para ser objetiva, expresándoles mis agradecimientos. Debo agradecer de manera especial y sincera al los doctores Juan Manuel Corpa y Juan José Pascual por aceptarme para realizar esta tesis doctoral bajo su dirección. Su apoyo incondicional, sus apreciados y relevantes consejos, críticas, comentarios y sugerencias durante el desarrollo de esta investigación han permitido un enorme cambio tanto profesional como personal en mis ideas. Les agradezco también por haberme facilitado siempre los medios suficientes para llevar a cabo todas las actividades propuestas durante el desarrollo de esta tesis. En particular gracias a Juanjo por su eficacia y destreza, sin ti muchas herramientas científicas no estarían igual de aprovechadas, me enorgullece haberte tenido como director, por tu entusiasmo y espíritu de superación que sin darte cuenta lo infundes a los demás. ¡Para mí todo un ejemplo!. Y a Juanma que ha sido mi segundo padre en España, pero madre todavía más, por su carácter tan maternal. Gracias por estos cuatro años, la verdad que han sido mis años más felices, desde luego no me podía imaginar que existían directores como tu y que ir al trabajo todos los días fuese algo tan agradable. Gracias por todos los momentos que nos has permitido pasar todos juntos y por la calidad de momentos que hemos pasado juntos a ti. Necesitaría varias hojas para darte las gracias por todo. Gracias también por haberme formado como profesional, por haber sido mi punto de referencia en cada momento y por haberme reñido en los cambios estacionales. Te voy a recordar con mucho cariño y que Dios quiera que los futuros jefes vayan a ser como tú, aunque lo dudo mucho. Quiero expresar también mi más sincero agradecimiento a mi profesor del Máster en Ciencia Animal, el Dr. Enrique Blas quien fue realmente el que me inspiró para que siguiera la carrera investigadora. Debo destacar, por encima de todo, además de su importante aporte y participación activa en el desarrollo de esta tesis, su disponibilidad, paciencia y enorme espíritu paterno. No cabe duda que su presencia y participación ha enriquecido a mi persona y al trabajo realizado. Ojalá llegara a ser como tu, la preciosa dote de enseñanza te distingue frente a cualquiera. Agradezco de manera especial al Foulum Research Centre, por permitir que esta tesis doctoral se desarrollara en el marco de un proyecto de colaboración entre nuestro grupo y el grupo del Dr. Mogens Vestergaard. Debo agradecer por la calidad, amabilidad y disponibilidad durante mi estancia en este centro de investigación, durante la cual tuve todo el apoyo profesional y logístico para alcanzar los objetivos perseguidos. Muchas gracias a Yens, Carlsten y al “Big boss” por contribuir en mi experiencia tan importante para mi formación como investigadora. A la Dra. Concha Cervera de la granja experimental de la Universidad Politécnica de Valencia, su siempre atenta y efectiva colaboración, durante la totalidad de la realización de este trabajo, se vió reflejada en muchos de los resultados obtenidos. Aprovecho para agradecer también a Eugenio, Luis, Davi y Juan Carlos, del grupo de la Dr. Concha Cervera,.
(12) además de Ceferino, quien también colaboró con nosotros activamente durante todos los estudios. Para todos vosotros, mis más sinceros agradecimientos. Gracias al Dr. Juan Pablo Sánchez, del centro de Investigación y Tecnología Agroalimentarias de Lleida e al Dr. Nic Friggens del AgroParisTech de París, por su pronta colaboración en los estudios. A los veterinarios Pacheco y Xavi Mora por su desinteresada colaboración; al poner a nuestra disposición toda su información en sanidad cunicola y base de datos de granjas, lo que facilitó el análisis del área de estudio. Sin olvidar a los granjeros de la Comunidad Valenciana y de Cataluña por su pronta disponibilidad y amabilidad en proporcionar los animales enfermos. Entre los compañeros miembros de nuestro grupo de investigación, muchas gracias David, Laura, Agustín, Rocío y Joaquín. En particular debo resaltar mis agradecimientos para algunas personas, mis compañeras Irene, Ana y Mariola. Quiero expresar mi agradecimiento especial a vosotras, compañeras siempre generosas y dispuestas como pocos, con las cuales he compartido conocimientos y experiencias de tipo profesional y personal de gran valor. Habéis estado siempre a mi lado, como amigas, hermanas y compañeras. Difícilmente podré encontrar compañeras como vosotras…mil y mil gracias! Para el resto de compañeros del laboratorio: a JI (José Ignacio), gracias por tu ayuda en todo momento, por tu alegría y sonrisa cada día, a Mª Carmen, a Maite, pero en particular gracias a Juanjo, que sin duda ha representado un pilar muy importante para mí en el día-día. A parte de un compañero de laboratorio, he podido conocer a uno de mis mejores amigos, con el cual he pasado momentos inolvidables durante estos años. Gracias por hacer tan llevaderos y divertidos todos los días de trabajo en el laboratorio, además de los momentos pasados fuera del mismo. ¡No tengo palabras! Para todos los miembros del Departamento de Producción y Sanidad Animal, Salud Pública Veterinaria y Ciencia y Tecnología de los Alimentos y al personal administrativo de la Universidad CEU Cardenal Herrera, vayan también mis más sinceros agradecimientos. Debo agradecer de manera especial a Silvia, de Administración, su paciencia y eficacia nos permitió obtener facilidades ante nuestros numerosos viajes a las granjas. Quiero recordar también a los técnicos y personal de la Universidad CEU Cardenal Herrera; su trabajo también ha sido importante para que esta tesis llegara a buen puerto. Quiero expresar mi agradecimiento especial a Cristina, Elisa, Ana, Vanesa y José Antonio, por su valiosa colaboración y amistad, sin olvidar en mencionar al Dr. Ignacio Pérez por su amabilidad cada vez que surgía algún problema con el citometro de flujo. A mis mejores amigos en Valencia: Hicham, que desde hace casi 9 años representa mi familia aquí en Valencia, junto con Lara, Borja, Carol, Eva, Teresa, Robert, Cristina, Dani, y Jacobo, de quien siempre he recibido palabras de aliento; sin olvidar los de Italia y Dinamarca: Valeria, Cristiano, Fabio, Angela, Carlo, Damiano, Enrico y Mouna, simplemente por vuestra amistad. A mis compañeros y amigos del Máster: Cristian, Sawsen, Teresa y al profesor Jorge, gracias por todos vuestros consejos y confianza..
(13) A mis compañeros y amigos de la Facultad de Agrónomos que llevo en el corazón desde cuando llegué a España: Carmina, Paquito y Toni, gracias a vosotros he saboreado durante mi “Erasmus” una Valencia acogedora, agradable y alegre, que me animó a quedarme para obtener estos logros. A mis compañeros y amigos de trabajos del fin de semana: Laura, Adrian, Marta, Frida, Vicente e Issam, gracias por vuestro apoyo incondicionado durante todos los años pasados juntos. A mis padres, Mario y Morena, por su ejemplo de lucha y honestidad, que pese a su contrariedad en la lejanía de casa, al día de hoy, espero puedan consolarse viendo el fruto de este trabajo; a mi hermana Melissa por su tenacidad y superación; a Quique y su familia sin duda, por su ayuda, paciencia, comprensión, generosidad y cariño en ocasiones difíciles; desde cuando os conocí habéis cuidado de mi como a una más de la familia…por ellos y para ellos! Finalmente, debo agradecer a la Generalitat Valenciana con su Programa Santiago Grisolía, por haber financiado gran parte de mis estudios doctorales otorgándome una beca a partir de la convocatoria del año 2009; sin olvidar a la Universidad CEU Cardenal Herrera por la financiación general de todos los estudios, congresos, cursos y estancia en el extranjero..
(14)
(15)
(16)
(17) ABSTRACT Rabbit health is considered a main handicap on commercial farms. The overall objective of this thesis was to study the immune response of rabbit does of different genetic types subjected to reproductive, environment and immunologic challenges, and its relationship with body condition. Effect of selection was studied using different genetic types. Three studies were carried out: In the first study, the main objectives were to compare the peripheral blood lymphocyte populations of multiparous rabbit does under two reproductive rhythms [insemination at 11 days post partum (dpp) and weaning at 28 dpp; insemination at 25 dpp and weaning at 42 dpp], and to assess the influence on those of kits. Additionally, does’ perirenal fat thickness was also measured at partum and weaning to observe if body condition correlated with lymphocyte populations. During whole lactation, counts of total CD5+, CD4+ and CD8+ lymphocytes of females were generally lower in rabbit does weaned at 42 dpp as compared to 28 dpp. Moreover, counts of total B and CD5+ lymphocytes in rabbit does weaned at 42 dpp correlated with their body condition, unlike that observed in rabbit does weaned at 28 dpp. Some correlations between lymphocyte counts in both groups of does and weaning rabbits were observed. At weaning, those young rabbits weaned at 42 dpp had a lower number of CD4+ lymphocytes than those weaned at 28 dpp. In conclusion, the 42-ddp rabbit does presented a lower number of total lymphocytes and lymphocyte subsets during lactation and at weaning, and a poorer adaptation capacity during the gestation-lactation cycle. In the second study, the effect of selection for reproduction (V line, selected for litter size at weaning) or foundation for reproductive longevity (the LP line) was investigated under normal and heat stress conditions. The cross between two maternal lines (V36 animals) was compared with the same cross, but 20 generations earlier, using a cryopreserved control population (V16 animals). To evaluate the possible correlation between energy balance and the immunological status of females, daily feed intake (DFI) during lactation week 2 and perirenal fat thickness (PFT) on 14 dpp were controlled by ultrasound. The results show that housing under heat stress conditions reduced the B lymphocytes counts in female rabbits. The highest lymphocytes population value in blood (total, T CD5+, CD4+ and CD8+) was noted at first parturition, while the B lymphocytes count was lower at second parturition. Selection for litter size at weaning (V females) reduced the average counts of total and B lymphocytes in blood, mainly because these populations in V36 females continuously lowered from first to second parturition under normal housing conditions. Thus, more selected females (V36) at second parturition showed lower counts in blood for total T CD5+ and CD25+ lymphocytes. The main differences in blood counts between V36 and V16 females disappeared when housed under heat stress conditions, except for T CD5+ and CD25+, which increased in the V16 vs. V36 females on day 10 post-partum. Under normal conditions, no differences between LP and V36 females were found for most lymphocyte populations, only higher counts in CD25+ for LP females. However, the lymphocytes counts (especially total and T CD5+) of LP females increased under heat vs. normal conditions when lymphocytes populations obtained the lowest values (second parturition), while V36 females’ counts remained invariable. Feed intake and females’ perirenal fat thickness positively correlated with B lymphocytes counts in the blood of primiparous rabbit females in week 2 of lactation. In conclusion, these results indicate that selection for litter size at weaning might diminish animals’ immune system response and adaptation capacity, while.
(18) the foundation for reproductive longevity criteria leads to more robust rabbit females as they present greater modulation under heat stress conditions when the immune system is affected. The third study aimed to evaluate differences in the immune response in maternal lines of reproductive rabbit does, founded for the same criteria as in the previous study (V and LP lines). Females were subjected to three different reproductive effort levels: post-partum (PP) mating at first lactation and 9 kits at the second; post-weaning (PW) mating at first lactation and 9 kits at the second; and PW mating at first lactation and 5 kits during the second. At second weaning (30 dpp), an acute response was induced by an intravenous infusion of lipopolysaccharide (LPS). LP females seemed to be less affected during the hyperacute phase than V females, presenting lower plasma glucose content at 1.5 h post-infusion (pi) and rectal temperature at 6 h pi; they showed a greater ulterior immune response, with higher levels of c-reactive protein at 48 h pi and haptoglobin in plasma from 24 h pi. The survival test conferred a higher culling risk for V than for LP females during the first post-challenge hours. Moreover, the advantage of the LP in terms of survival rate over the V line came exclusively from the females mated after a first weaning (PW), which were also the main group responsible for the increase of NEFA in blood after 6 h pi. These results suggest that, with regard to immune response to LPS challenge, foundation by hyperlongevity productive criteria (LP females) contributes to obtain a more robust population of rabbit does characterized by improved response ability. In conclusion, from the results obtained in the three thesis studies, it may conclude that there seems to be an evident relationship between body condition and health status of reproductive rabbit does as evident positive correlations were observed between body condition and main lymphocyte population counts in the first two studies, and non-esterified fatty acids (NEFAs) levels in blood seem to be the only plasma trait relating to female survival in the immunological challenge developed in the third study. Thus, these results confirm the initial thesis hypothesis which proposed that body condition is proposed to play a mediating role and entails that, for animals at the same production and genetic level, the better the body condition, the better the immune response..
(19) RESUMEN La salud de los animales puede ser considerada como uno de los principales obstáculos en las granjas cunícolas comerciales. El objetivo general de esta tesis doctoral, fue estudiar la respuesta inmune en conejas reproductoras de diferentes tipos genéticos sometidas a desafíos reproductivos, ambientales e inmunológicos y su relación con la condición corporal. Para ello se llevaron a cabo tres estudios. En el primer estudio, los principales objetivos fueron comparar las poblaciones linfocitarias en sangre periférica de conejas multíparas bajo dos ritmos reproductivos: (1) inseminación artificial a los 11 días post-parto (dpp) con un destete a los 28 dpp con (2) inseminación a 25 dpp y destete a los 42 dpp]. También se estudió las poblaciones linfocitarias sanguíneas de los gazapos de las hembras anteriormente señaladas. Adicionalmente, se valoró el espesor de la grasa perirenal al parto y destete para observar si la condición corporal se correlacionaba con las poblaciones linfocitarias. Durante el ciclo de lactación, el recuento de linfocitos totales, CD5+, CD4+ y CD8+ fueron generalmente más bajos en las conejas destetadas a los 42 dpp comparadas con las destetadas a 28 dpp. Además, los recuentos de linfocitos totales, linfocitos B y CD5+ en conejas destetadas a los 42 dpp se correlacionaron con su condición corporal, contrariamente a lo observado en las hembras destetadas a los 28 dpp. También se observaron correlaciones entre los recuentos linfocitarios de los dos grupos de hembras y sus gazapos. De tal forma que en el momento del destete, los gazapos destetados a los 42 dpp presentaron un menor número de linfocitos CD4+ que los destetados a los 28 dpp. En conclusión, las conejas destetadas a los 42 dpp presentaron un menor número de linfocitos totales y subpoblaciones de éstos durante la lactación y en el destete, así como menor capacidad de modulación de dichas poblaciones celulares durante el ciclo de gestaciónlactación. En el segundo trabajo se estudió el efecto de la selección por reproducción (línea V, seleccionada por tamaño de camada al destete, utilizando dos grupos de animales -V16 y V36- separados por 20 generaciones) o por longevidad reproductiva (línea LP), en condiciones normales y de estrés por calor. Para evaluar la posible correlación entre el balance energético y el estado inmunológico de las conejas, se controló el consumo diario de alimento (DFI) durante la segunda semana de la lactación y espesor de la grasa perirenal (PFT) el 14 dpp. Respecto a los resultados, se observó un menor recuento de linfocitos B en la cámara climática. Los recuentos más altos de linfocitos sanguíneos (totales, T CD5+, CD4+ y CD8+) se observaron en el primer parto, mientras que los recuentos de linfocitos B fueron menores en el segundo parto. La selección por tamaño de camada al destete (hembras V) redujo los recuentos promedio de linfocitos totales y B en la sangre, principalmente porque estas poblaciones en las hembras V36 disminuyeron de manera continua desde el primer al segundo parto, en condiciones normales de alojamiento. Por lo tanto, las conejas de la línea V y de la generación actual (V36) mostraron en el segundo parto menores recuentos de linfocitos totales, T CD5+ y CD25+. Estas diferencias en los recuentos sanguíneos entre V36 y V16 desaparecieron cuando los animales fueron alojados bajo condiciones de estrés térmico, excepto para las poblaciones de linfocitos T CD5+ y CD25+, que aumentaron en las hembras V16en el día 10 post-parto. En condiciones normales, no hubo diferencias entre las hembras LP y V36 para la mayoría de las poblaciones linfocitarias, únicamente se observaron recuentos más elevados de linfocitos CD25+ en las conejas LP. Sin embargo, los recuentos de linfocitos (especialmente totales y T CD5+) de las hembras LP aumentaron en.
(20) cámara climática frente a la cámara convencional, mientras que los recuentos de las V36 permanecieron invariables. Se encontraron correlaciones positivas entre el consumo de alimento y el espesor de la grasa perirenal, con los recuentos de linfocitos B de las conejas en la segunda semana de lactación. Estos resultados indican que la selección por tamaño de camada al destete, podría haber tenido efectos perniciosos en el sistema inmunológico de los animales, de tal forma que muestran un menor número en algunas poblaciones linfocitarias y una peor respuesta inmune, mientras que la selección por criterios de híper-longevidad reproductiva habría conducido a la obtención de animales más robustos, ya que presentan mayores recuentos linfocitarios bajo condiciones de estrés térmico, cuando el sistema inmune se ve gravemente afectado. En el tercer estudio se continuó evaluando las diferencias entre la respuesta inmune de distintas líneas maternas de conejas reproductoras empleando, para ello, hembras seleccionadas por los mismos criterios del estudio anterior. Las conejas reproductoras fueron sometidas a tres niveles diferentes de esfuerzo reproductivo: (1) conejas cubiertas post-parto (PP) en la primera semana de lactación y con 9 gazapos durante el segundo parto; (2) conejas cubiertas post-destete (PW) en la primera semana de lactación y con 9 gazapos durante el segundo parto y (3) conejas cubiertas post-destete (PW) en la primera semana de lactación y 5 gazapos durante el segundo parto. Al segundo destete (30 dpp), se indujo una respuesta inflamatoria aguda mediante la infusión intravenosa de lipopolisacárido de pared bacteriana (LPS). Las hembras LP parecieron estar menos afectadas durante la fase aguda que las hembras V, mostrando menores niveles de glucosa en plasma sanguíneo a las 1,5 horas post inoculación (pi) y una menor temperatura rectal a las 6 h pi, además mostraron una mayor respuesta inmunitaria ulterior, con niveles más altos de proteína c-reactiva a las 48 h pi y haptoglobina en plasma a partir de las 24 h pi. Tras realizar un test de supervivencia se asignó un mayor riesgo de sacrificio para hembras V que LP, durante las primeras horas después del desafío. Además, la ventaja en términos de tasa de supervivencia de la LP sobre la línea V procede exclusivamente de las hembras cubiertas después de la primera semana de destete (PW), que también era el grupo principal responsable del aumento de ácidos grasos no esterificados (NEFAs) en sangre después de 6 h pi. Estos resultados vuelven a confirmar que, respecto a la respuesta inmune frente a un desafío con LPS, la fundación por criterios de híper-longevidad productiva (hembras LP) conduce a obtener una población más robusta de conejas, que se caracteriza por la capacidad de una respuesta mejorada. En conclusión, a partir de los resultados de estos tres estudios, se puede concluir que, parece haber una clara relación entre la condición corporal y el estado de salud de las conejas reproductoras, se han observado evidentes correlaciones positivas entre la condición corporal y los principales recuentos de poblaciones linfocitarias en los dos primeros estudios, y los niveles de NEFAs en plasma parecen ser el único parámetro en relación con la supervivencia de las conejas al desafío inmunológico desarrollado en el tercer estudio. Por lo tanto, estos resultados apoyan la hipótesis inicial de esta tesis, confirmando que la condición corporal desempeña un papel mediador fundamental. De tal forma que en animales bajo el mismo nivel productivo y el mismo nivel genético, a mejor condición corporal, mejor respuesta inmunitaria..
(21)
(22)
(23) ABBREVIATIONS AD Anno domini Ag Antigen AI Artificial insemination AMP Antimicrobial peptide AP-1 Activating protein 1 APC Antigen presenting cell APP Acute phase protein BALT Broncus-associated lymphoid tissue BC Before Christ Bcl-2 B cell lymphoma-2 BCR B-cell receptor BLUP Best linear unbiased prediction BM Bone marrow BW Body weight CC Climatic chamber CCR CC-chemokine receptor CD Cluster of differentiation CH Conventional housing CNS Central nervous system CPK Creatine phosphokinase CRP C-reactive protein CSF Colony-stimulating factor cTEC Cortical thymic epithelial cell CTLA Antigen cytotoxic T lymphocyte-associated CV Coefficient of variation CXCL Chemokine (C-X-C motif) ligand CXCR CXC-chemokine receptor DC Dendritic cell DE Digestible energy DFI Daily feed intake DM Dry matter DN Doble negative DP Doble positive DPr Digestible protein dpp Days post partum EBE Estimated body energy ECF Eosinophilchemotactic factor EDTA Ethylenediaminetetraacetic acid ERE Epizootic rabbit enteropathy ETP Early thymic progenitor FasL Fas ligand Fc Fragment crystallizable FcR Fc receptor FoxP3 Forkhead box P3 GALT Gut-associated lymphoid tissue GITR Glucocorticoid induced tumor necrosis factor receptor.
(24) GM-CSF Granulocyte-macrophage-colony stimulating factor GOT Glutamic-oxaloacetic transaminase GPT Glutamic-pyruvic transaminase Hb Haemoglobin H:L Heterophil/lymphocyte Hp Haptoglobin HPC Hematopoietic progenitor cell HSC Hematopoietic stem cell Hsp Heat-shock protein HSPC Hematopoietic stem and progenitor cell IEL Intraepithelial lymphocyte IFN Interferon Ig Immunoglobulin IGF Insulin-like growth factor IgH Immunoglobulin heavy chain IgL Immunoglobulin light chain IL Interleukin iNOS Inducible nitric oxid synthase IRF Interferon regulatory factor iTreg Induced or adaptive T regulatory cell KIR Killer cell immunoglobulin-like receptor LA Leukocyte antigen LCA Last control alive LFA Lymphocyte function-associated antigen LGL Large granular lymphocyte LN Lymph node LP Hyperlongevity productive rabbit line LPS Lipopolysaccharide LT Lymphotoxin MAC Membrane attack complex MALT Mucosa-associated lymphoid tissue MASP Mannan-binding lectin-associated serine protease MB Mannan-binding MC Mast cell MCH Mean corpuscular haemoglobin MCHC Mean corpuscular haemoglobin concentration MCP Monocyte chemotactic factor MCV Mean corpuscular volume MD2 Lymphocyte antigen 96 MHC Major histocompatibility complex MIg Membrane immunoglobulin MPS Mononuclear phagocytic system mTEC Medullary thymic epithelial cell MyD88 Myeloid differentiation primary response gene (88) NADPH Nicotinamide adenine dinucleotide phosphate NALT Nasopharynx-associated lymphoid tissue NEFA Non esterified fatty acid NET Neutrophil extracellular trap.
(25) NFAT Nuclear factor of activated T-cell NFkB Nuclear factor-kappa beta NO Nitric oxide No. Number of observations NOD Nucleotide Oligomerization Domain NK Natural killer NKP Natural killer precursor NKR Natural killer cell receptor nTreg Natural T regulatory cell PALS Periarteriolar lymphoid sheath PAMP Pathogen-associated molecular pattern PBS Phosphate-buffered saline PCV Packed cell volume PFT Perirenal fat thickness pi Post-infusion pMHC Peptide-major histocompatibility complex PMN Polymorphonuclear neutrophil PP Post-partum PRR Pattern recognition receptor pTα Pre-Tα chain PW Post-weaning RDW Red cell distribution width RER Rough endoplasmic reticulum RLA Rabbit leukocyte antigen RNS Reactive nitrogen species ROS Reactive oxygen species SCA-1 Stem-cell antigen-1 SD Standard deviation SE Standard error SLO Secondary lymphoid organ SP Single positive SPF Specific pathogen free TAP Transporter associated with antigen processing Tc Cytotoxic T cell TCR T-cell receptor TD T-cell dependent Tfh Follicular helper T cell TGF Tumor growth factor Th Helper T cell TI T-cell independent TIR Toll/interleukin-1 receptor TIRAP Toll-interleukin 1 receptor (TIR) domain containing adaptor protein TLR Toll-like receptor TNF Tumor necrosis factor Tr1 Regulatory T cell type 1 TRAF Tumor necrosis factor receptor associated factor TRAM Toll-like receptor adaptor molecule Treg CD4+CD25+Foxp3+ regulatory T cell.
(26) TRG T-cell receptor gamma TRIF TIR-domain-containing adapter-inducing interferon-β UP Perirenal fat thickness at partum V Reproductive rabbit line selected by litter size at weaning WBC White blood cell.
(27) INDEX A. GENERAL INTRODUCTION --------------------------------------------------------------------------3 1. RABBIT BREEDING -------------------------------------------------------------------------------------------- 3 1.1. History of the rabbit breeding ----------------------------------------------------------------------------- 3 1.2. Rabbits in the world and European context ------------------------------------------------------------- 8 1.3. Rabbits in the national context --------------------------------------------------------------------------- 10 2. IMMUNE SYSTEM -------------------------------------------------------------------------------------------- 13 2.1. Introduction -------------------------------------------------------------------------------------------------- 13 2.2. Organization of the rabbit immune system ------------------------------------------------------------- 13 2.3. Cells of the immune system ------------------------------------------------------------------------------- 21 2.3.1. Phagocytic cells -------------------------------------------------------------------------------------- 22 2.3.1.1. Mononuclear phagocytes: monocytes and tissue macrophages --------------------- 24 2.3.1.2. Dendritic cells ------------------------------------------------------------------------------- 26 2.3.1.3. Polymorphonuclear granulocytes --------------------------------------------------------- 27 2.3.2. Mast cells ---------------------------------------------------------------------------------------------- 28 2.3.3. Natural killer cells ----------------------------------------------------------------------------------- 29 2.3.4. Lymphocytes ------------------------------------------------------------------------------------------ 31 2.3.4.1. B lymphocytes ------------------------------------------------------------------------------- 33 2.3.4.2. T lymphocytes ------------------------------------------------------------------------------- 39 2.4. Immune response ------------------------------------------------------------------------------------------- 47 2.4.1. Innate immune response ---------------------------------------------------------------------------- 48 2.4.1.1. Components of innate immunity --------------------------------------------------------- 52 2.4.2. Adaptive immune response ------------------------------------------------------------------------- 55 2.4.2.1. Role of the Mayor Histocompatibility Complex (MHC) in immune responses------------------------------------------------------------------------------------------------ 57 2.4.2.2. Role of the B-cell receptors (BCR) in immune responses ---------------------------- 61 2.4.2.3. Role of the T- cell receptors (TCR) in immune responses --------------------------- 62 2.4.2.4. Cell-mediated response -------------------------------------------------------------------- 64 2.4.2.5. Humoral response --------------------------------------------------------------------------- 66 3. EFFECT OF ENVIRONMENT ON THE RABBIT IMMUNE SYSTEM ----------------------------- 68 3.1. Effect of reproductive effort ------------------------------------------------------------------------------ 71 3.1.1. Effect of reproductive rhythm on the female performance and body condition ------------------------------------------------------------------------------------------------------ 71 3.1.2. Effect of reproductive rhythm on the female immune system -------------------------------- 74 3.2. Effect of environmental temperature -------------------------------------------------------------------- 75 3.2.1. Effect of heat stress on the rabbit performances ------------------------------------------------ 75 3.2.2. Effect of heat stress on the rabbit immune system --------------------------------------------- 77 3.3. Effect of sporadic immunological challenge ----------------------------------------------------------- 79 3.3.1. Genetic variability for immune responses ------------------------------------------------------- 79 3.3.2. Effect of lipopolysaccharide infusion on the rabbit immune system ------------------------ 80 3.3.2.1. Effect of lipopolysaccharide infusion on body temperature ------------------------- 82 3.3.2.2. Effect of lipopolysaccharide infusion on energy metabolities in plasma --------------------------------------------------------------------------------------------------- 83 3.3.2.3. Effect of lipopolysaccharide infusion on acute phase proteins in blood----------------------------------------------------------------------------------------------------- 83 4. GENETIC SELECTION, BODY CONDITION AND HEALTH IN REPRODUCTIVE RABBIT DOES ----------------------------------------------------------------------------- 85 4.1. Nutrient partitioning ---------------------------------------------------------------------------------------- 86 4.2. Body condition and reproduction ------------------------------------------------------------------------ 86 4.3. Genetic selection and resources allocation ------------------------------------------------------------ 88 4.3.1. Selection for litter size ------------------------------------------------------------------------------ 88 4.3.2. Selection for longevity ------------------------------------------------------------------------------ 90 4.3.3. Robustness -------------------------------------------------------------------------------------------- 92.
(28) B. HYPOTHESES AND OBJETIVES --------------------------------------------------------------- 95 C. MATERIALS AND METHODS -------------------------------------------------------------------- 101 1. STUDY DESIGN I -------------------------------------------------------------------------------------------- 101 1.1. Animals ---------------------------------------------------------------------------------------------------- 101 1.2. Haematological studies and flow citometry analysis ----------------------------------------------- 101 1.3. Ultrasound measurements ------------------------------------------------------------------------------- 102 1.4. Statistical analysis ---------------------------------------------------------------------------------------- 102 2. STUDY DESIGN II ------------------------------------------------------------------------------------------- 104 2.1. Animals ---------------------------------------------------------------------------------------------------- 104 2.2. Experimental procedure --------------------------------------------------------------------------------- 104 2.3. Haematological studies and flow citometry analysis ----------------------------------------------- 105 2.4. Ultrasound measurements ------------------------------------------------------------------------------- 106 2.5. Statistical analysis ---------------------------------------------------------------------------------------- 106 3. STUDY DESIGN III ------------------------------------------------------------------------------------------ 107 3.1. Animals ---------------------------------------------------------------------------------------------------- 107 3.2. Experimental procedure --------------------------------------------------------------------------------- 107 3.3. Performance traits ---------------------------------------------------------------------------------------- 107 3.4. LPS challenge --------------------------------------------------------------------------------------------- 108 3.5. Plasma analyse -------------------------------------------------------------------------------------------- 108 3.6. Statistical analysis ---------------------------------------------------------------------------------------- 108 3.6.1. Rectal temperature and plasma traits data ----------------------------------------------------- 108 3.6.2. Survival after the immunological challenge --------------------------------------------------- 109. D. RESULTS -------------------------------------------------------------------------------------------------- 113 1. STUDY I--------------------------------------------------------------------------------------------------------- 113 2. STUDY II-------------------------------------------------------------------------------------------------------- 118 3. STUDY III------------------------------------------------------------------------------------------------------- 123 3.1. Rectal temperature and plasma traits ------------------------------------------------------------------ 123 3.2. Survival after immunological challenge -------------------------------------------------------------- 126. E. GENERAL DISCUSSION ----------------------------------------------------------------------------- 131 F. FINAL CONCLUSIONS ------------------------------------------------------------------------------- 141 G. REFERENCES ------------------------------------------------------------------------------------------- 145.
(29) GENERAL INTRODUCTION.
(30)
(31) A. General Introduction. A.. GENERAL INTRODUCTION. 1.. RABBIT BREEDING. 1.1.. History of rabbit breeding. Considerable evidence suggests that Asia is the centre of origin of the mammalian superordinal clade Glires, which includes extant orders Rodentia and Lagomorpha (Rose et al., 2008). The fossilized skeleton of a rabbit-like creature, which lived 55 million years ago, was found in Mongolia, Gomphos elkema, and as known, it is the oldest member of the rabbit family to have ever been found (Meng et al., 2004). Gomphos shares a series of cranioskeletal characters with extant rabbits, hares and pikas, but retains primitive dentition and jaw as compared to its modern relatives. Phylogenetic analyses support the position of Gomphos as stem lagomorphs (Asher et al., 2005). In Turkey, a sphinx has been found which rests on two rabbits dating back to the 14th century BC (Figure 1).. Figure 1. Sphinx gate of Alaca Hüyük in the 14th century BC. Ruler standing on a two-headed eagle catching two rabbits.. There are evidences to indicate that both wild and domestic European rabbits belong to the single species Oryctolagus cuniculus, which is the sole extant representative of the genus Oryctolagus, which appeared in the Iberian Peninsula, from where it went to West France and North Africa (Gibb, 1990; Mitchell-Jones et al., 1999). Paleontological data indicate a limited morphological diversification of the genus Oryctolagus since its appearance at the end of the Miocene (24 - 5 million years BC), where the oldest fossil was found near Granada (Rogel-Gaillard et al., 2009). Fossil remains from the middle Pliocene helped recognize two species: O. lacosti in South France and NorthWest Italy, O. laynensis in the Iberian Peninsula. The latter is thought to be the origin of the extant O. cuniculus (Lopez-Martínez, 1989). Other O. cuniculus fossils dating back to the mid-Pleistocene (800,000-130,000 BC) come from Baza, Andalusia (South Spain) (RogelGaillard et al., 2009). Archaeozoological data indicate that the original range of rabbits was restricted to the Iberian Peninsula and to South France as far as the River Loire (Callou, 1995). Nowadays, two subspecies (Table 1) have been recognized in the Iberian Peninsula (South Europe). Oryctolagus cuniculus algirus occupies the southwestern part of the peninsula. 3.
(32) A. General Introduction. (roughly Portugal and South Spain). There is some overlap of ranges with O. c. algirus and O. c. cuniculus, which occupy all the northern and western points of O. c. algirus (BijuDuval et al., 1991). O. c. cuniculus is thought to be the descendant of the early domestic rabbits released into the wild (Gibb, 1990), and is now the subspecies that was introduced throughout Europe, and certainly worldwide (Angulo, 2004). O. c. algirus is also found in North Africa, in the Mediterranean region and on Atlantic islands (Branco et al., 2000). Table 1. Taxonomy of Oryctolagus cuniculus (Wilson and Reeder, 2005). Domain Supergroup Kingdom Clade Subregnum Group Superphyla Phylum Subphylum Infraphylum Superclass Class Subclass Infraclass Order Family Genus Species Subspecies. Eukaryota Opisthokonta Animalia Eumetazoa Bilateria Nephrozoa Deuterostomia Chordata Vertebrata Gnathostomata Tetrapoda Mammaliad Theria Placentalia Lagomorpha Leporidae Oryctolagus Oryctolagus cuniculus O. c. algirus - O. c. brachyotus O. c. cnossius - O. c. cuniculus O. c. habetensis - O. c. huxleyi. The European rabbit (Oryctolagus cuniculus) has been introduced into many locations around the world, and all breeds of domestic rabbit originate from the European species. Nearly half the world’s rabbit subspecies are in danger of extinction, and many are among the most vulnerable species of all mammals (Sandford, 1996). However, other subspecies have been widely spread, and are even considered a pest in some geographical areas. Currently, ranges include all Western European countries, Ireland and the UK (including all islands), Austria, parts of Sweden, Poland, the Czech Republic, Hungary, Romania, Ukraine, and the Mediterranean islands of Sicily, Corsica, Sardinia, Crete, the Balearics (Thompson and King, 1994), and also Croatia and Slovakia (Mitchell-Jones et al., 1999). It was introduced into Australia in 1788, and again into South America in Argentina and Chile in 1859, and is found in many islands of the Pacific, off the African coast, New Zealand and the Caribbean (Figure 2) (Thompson and King, 1994). The first news of the presence of rabbits in Spain is estimated to date back to 1,000 BC when the Phoenicians arrived to Iberia (Rogel-Gaillard et al., 2009). Their attention was caught by a large amount of gray rabbits if compared to those that existed in their original place, and they called them "Damans", which were like guinea pigs, but bigger. In fact, during the last millennium BC, southern regions and areas of the Mediterranean coast of the Iberian Peninsula emphasized their relations with Eastern colonizers (Phoenicians and Greeks), while those inlands were influenced by Indo-Europeans (Celts), which entered via the Pyrenees.. 4.
(33) A. General Introduction. Native Introduced. Figure 2. Distribution range map of Oryctolagus cuniculus, native or introduced (Linnaeus, 1758).. It is believed that the name of Spain derives from these animals. Damans in their language was shapan, for which the country was called i-shaphan-im or "the land of hyraxes", small rodents from their country, which were mistaken with rabbits (Slifkin, 2011). Later, the Romans converted the phrase i-shaphan-ím, given an influence of Greek Spania, into its Latin form, Hispania, which evolved into the modern Spanish word "España" for Spain (Rogel-Gaillard et al., 2009). In fact in the 2nd century BC, rabbits had been introduced from Spain into the Italian Peninsula (Hatcher and Battey, 2011). The Romans, therefore, gave Spain the meaning of "land rich in rabbits", as we can read in written records of Cicero, Caesar, Pliny, Cato, Livy, and, in particular, Catullus, referring to Hispania as "Cuniculi Peninsula" (on some coins minted at the time of Hadrian; 117-138 AD), including personifications of Spain as a lady with a rabbit sitting at her feet (Figure 3), referring to the time that he lived in Spain (Rogers et al., 1994).. Figure 3. Second century Roman coins during the Hadrian Empire (117 to 138 BC). Dimensions: 19mm x 20mm, 7.12g. (Cuniculture: http://www.cuniculture.info/Docs/Elevage/Histori-02.htm).. 5.
(34) A. General Introduction. During Roman times, the rabbit was still emblematic of Spain (Moreki, 2007), and it was present not only in Spain, but also in South France and North Africa (Gibb, 1990; MitchellJones et al., 1999). Rabbits had still not yet been domesticated, although Varro (116 to 27 BC) suggested that rabbits be kept in leporaria, stone-walled pens or parks, with hares and other wild species for hunting (Hatcher and Battey, 2011). These leporaria were the origin of the warrens or game parks that subsequently developed in the Middle Ages. In France, it became the sole right of the lord of the manor to keep warrens. Rabbits were scarcely hunted, and were captured with snares, nooses or nets (Lebas et al., 1997). Pliny the Elder (23-79 BC), in his Naturalis Historia, wrote how this animal was used to prepare a delicacy based on fetal rabbits called laurices. Gregory of Tours (538-594 BC), in his Historia Francorum ("History of the Franks") Book V, 4, reported that Pope Gregory I authorized the use of laurices during Lent or other fasts, declared them to be a marine species, like fish or shellfish. This led to the development of cuniculture in monasteries during the early Middle Age, although breeding did not really take its roots in Europe until the 16th century (Carneiro et al., 2011). Some authors suggest that rabbits were introduced later into Britain by the Romans, who kept them in fenced-off warrens and harvested their meat and fur. The earliest known written records on rabbits in Britain date back to the 12th century. They were first described as "conies" after the second part of their scientific name Oryctolagus cuniculus (Bixby and Whitman, 2005). During the 16th century, breeding seemed to have spread across to France, Italy, Flanders and England. In 1595, Agricola mentioned the existence of gray-brown (wild), white, black, piebald (black and white) and ash-gray rabbits. In 1606, Olivier de Serres classified three types of rabbit: the wild rabbit, the semi-wild or "warren" rabbit raised inside walls or ditches, and the domesticated or hutch-bred rabbit (Figure 4). The meat of the last type was described as insipid and that of the wild- or semi-wild type as delicate. Domestication began in France since 1700, where a wild rabbit, called Agouti, was known to be brown, white, yellow, black and spotted (Lebas et al., 1997).. Figure 4. The starting chapter devoted to Garenne in the work of Olivier de Serres (1605) entitled "The Theatre of Agriculture and Husbandry of Fields". (Cuniculture: http://www.cuniculture.info/Docs/Elevage/Histori-02.htm).. 6.
(35) A. General Introduction. From Spain, the rabbit moved to America after being introduced by conquerors. Introduced into South America unsuccessfully several times since the mid-nineteenth century, but successfully at around 1936 where it maintains limited ranges in Argentina and Chile. Found on many islands in the Pacific, off the African coast, New Zealand, and the Caribbean (Thompson and King, 1994). During the 19th century, society profoundly changed, especially in Europe. After the abolition of aristocratic privileges and hunting practices, rabbit breeding in farms developed in Western Europe in both rural and urban areas. This period saw the beginning of what was to become practiced selective breeding. Numerous rural people started to migrate to work in new urban industries. In the small gardens often attached to their homes, the new workers started to breed poultry and rabbits. Indeed these animals allowed the development of kitchen by-products and became part of crop production in small gardens (Figures 5). Rabbits were then reared in small cages in a room annexed to the house, and even in the dwelling itself, as evidenced by several paintings from that time (Lebas et al., 1997).. a. b. c. d. Figures 5. Children feeding rabbits in front of their cages. a: Table J. F. Herring, mid-19th century; b: Table Felix Schlesinger, late 19th century; c: Hutchin rural areas. Girl holding a rabbit-Detail of a Table J. L. Krimmel painted in 1812; d: Merchant of rabbits (a mother and her cubs) – Engraving by H. Wolf, late 19th century, U.S. (Cuniculture: http://www.cuniculture.info/Docs/Elevage/Histori02.htm).. In the 20th century, with the development of more intensive rabbit production, the first feed concentrates appeared. During World War II, rabbit production developed extensively throughout Europe and Japan to cope with meat shortages. Under these demanding conditions, rabbits demonstrated their highly efficient feed-conversion capacity. In the 1950s, production slumped in Japan and North European countries as other meats with more flavour became readily available. At the same time, a boom in the New Zealand White rabbit and its offshoot, the Californian rabbit, was seen. Traditional European breeds (Fauve de Bourgogne, Argenté de Champagne and French Belier) underwent regression. French and. 7.
(36) A. General Introduction. Italian breeders worked to substantially improve the first New Zealand White and Californian rabbits imported from the United States. In Spain, different genetic lines have been set up, which have been exported to several countries. Their attractive appearance and quiet manner have made domestic rabbits good, relatively undemanding pets. As they are easily raised in captivity, rabbits are also important as laboratory animals for medical and scientific purposes (Sandford, 1996). Other quantitatively minor activities include rabbit breeding for experimentation purposes, for example, in the pharmaceutical industry, rabbit hair production (Angora rabbits), furs (Orylag Rex rabbits), as well as domestic rabbits (Rosell et al., 2000b). 1.2.. Rabbits in the world and European context. Global production rose roughly from 1975 to 1990 (Lebas et al., 1997). An estimate of rabbit meat production (1994) by Colin and Lebas, including almost all the countries in the world, suggests a possible production of 1.5 million tons. This means a per capita input of annual consumption of roughly 280 g of rabbit meat, if compared against the 10 kg/year consumed in France and the 15 kg/year in Naples, Italy (Lebas et al., 1997). Besides, FAOSTAT (2012) reports other, revealing that world rabbit meat production in the same year amounted to 883,796 tons, nearly half that declared by previous authors. Industrial rabbit production started to develop in Europe in the late 1970’s; in the 1980s, rabbitries incorporated a series of techniques that allowed production to improve. In the 1990s, specialized industrial rabbit meat production based on "new" genetic rabbit lines developed, and farmers were assisted by specialists in business management, nutrition, pathology and genetics, only to become highly competitive farms compared to other farmers exploiting different species of meat-producing animals. According to the data provided by the FAOSTAT (2012), world rabbit meat production has steadily grown since the late 1990s, reaching 1,136,305 tons in 2004, representing a 13% increase as of 1998. China remained the largest producer, accounting for 41% of total production in 2004. It should be noted that the entrance of rabbit meat from this source into the European Union was banned in 2002. This measure emerged after the detection of serious deficiencies in the control of waste and use of veterinary products from China, which is not allowed by the Standing Veterinary Committee of the EU. Since then, the measure has not been relented. In 2004, other major producing countries to consider are Italy with 18%, the Democratic People's Republic of Korea with an average of 8%, and Spain with 6%. World rabbit meat production since 2005 has ranged from 1,191,255 to 1,401,081 tons in 2009 (FAOSTAT, 2012). The latest FAOSTAT data of 2010 indicate that rabbit meat production rose to 1,421,695 tons worldwide, which is a similar trend to 2009 in each country. According to this source, the evolution of global rabbit meat production in the last ten years has grown until 2007 to then lower and stabilize in recent years, presenting a similar trend of world meat production (Figure 6). Asia with 809,071 tons remains the largest producer, where China generates 669,000 tons, accounting for 47% of global rabbit meat production, followed by Europe as Italy generates 255,400 tons (Figure 7).. 8.
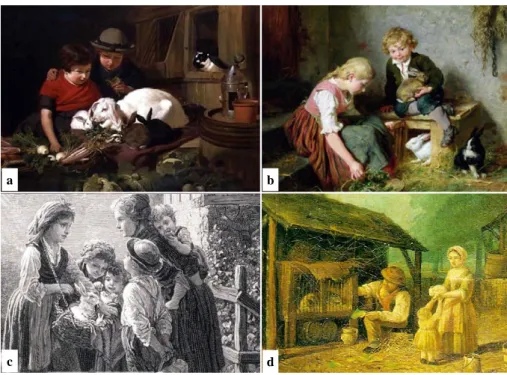
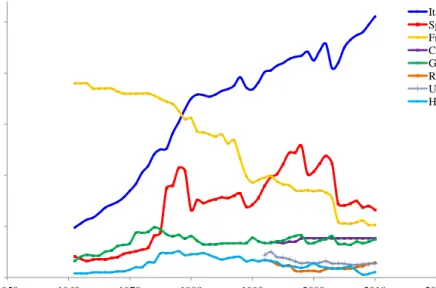
(37) 350000000. 1600000. 300000000. 1400000 1200000. 250000000. 1000000 200000000 800000 150000000 600000 100000000. 400000. 50000000. World + (Total) 5000 Meat, Total + (Total) 1765 Production (tons). Rabbit meat production (tons). Meat production (tons). A. General Introduction. 200000. World + (Total) 5000 Rabbit meat 1141 Production (tons) 0 1950. 1960. 1970. 1990. 1980. 2000. 2010. 0 2020. Year. Figure 6. Evolution of world rabbit meat production (tons) vs. evolution of world meat production (tons) (FAOSTAT, 2012). 900000. Rabbit meat production (tons). 800000. Africa Asia Europe America. 700000 600000 500000 400000 300000 200000 100000 0 1960. 1970. 1980. 1990. 2000. 2010. Year. Figure 7. Evolution of world rabbit meat production by continents (tons) (FAOSTAT, 2012).. Overall, worldwide rabbit meat production has remained constant in recent years, but mainly thanks to increased production in China. Of the one million, four hundred thousand tons, 509,107 tons correspond to the EU. Of this figure, Italy is the largest producer, accounting for 50% of European production in 2010. The Italian rabbit meat production increased incessantly at the expense of Hungary. The second country that stands out for its rabbit meat production is Spain with 66,200 tons, whose production remains constant over the years, be it with oscillations. France with 51,665 tons ranks third place, although its production tends to decrease (Figure 8). Beyond the EU, Egypt is highlighted (69,840 tons) as maintaining high production, which remains similar to that of 2003 (FAOSTAT, 2012).. 9.
(38) A. General Introduction. In its directory, FAO data (2005) indicate that Italy presents the highest rabbit meat consumption per capita per year in Europe at 3.84 kg. It is followed by Czech republic (3.82 kg), Republic of Malta (3.69 kg), Spain (2.5 kg), France (1.37 kg), Cyprus (1.03 kg), Greece (0.55 kg), Germany (0.45 kg) and, finally, Hungary (0.23 kg).. Italy Spain France Czech Republic Germany Russian Federation Ukraine Hungary. Rabbit meat production (tons). 250000. 200000. 150000. 100000. 50000. 0 1950. 1960. 1970. 1980. 1990. 2000. 2010. 2020. Year. Figure 8. Evolution of European countries rabbit meat production (tons) (FAOSTAT, 2012).. According to world rabbit meat production figures (FAOSTAT, 2012), the evolution of the number of slaughtered producing animals recorded in recent years was similar. In 2004, the number of producing animals slaughtered around the world was of 817,779,000 animals. In 2005, 865,457,000 were recorded, while in 2007 this number was 951,935,000 animals. A slight decrease was recorded in 2008, although it increased again in 2009, with the same number of animals in 2010 (1,050,641,000 animals), and the country with the largest number of animals recorded was China with 514,600,000, representing 50% of the global amount. In Europe, 325,106,000 animals were recorded in 2010, representing 31% of the global number of producing animals slaughtered, for which Italy leads with 169,700,000 animals, followed by Spain with 58,800,000 and France with 36,777,000. 1.3.. Rabbits in the national context. In Spain, rabbit breeding started to be modernized in the 1950s, and continued to evolve into the 1960s and 1970s. Industrial rabbit production began in Spain in the late 1960s and the early 1970s. It progressed from raising rabbits on the ground in niches or wooden cages placed in pens, townhouses in exterior walls or stalls, to exploiting them in metal cages located outdoors, either under covers or in rudimentary or empty rooms. Rabbit breeding was a largely rural, family activity. Fed mainly on green fodder and domestic food scraps, rabbits underwent enormous productive changes throughout the year, with slow, irregular growth, and could cause major health problems (Roca, 2009). Today, rabbits are exploited economically for meat production, and also for skin and hair production, although this latter exploitation is often a byproduct in most cases. Rabbits are. 10.
(39) A. General Introduction. also kept as pets (dwarf breeds), and used for experimentation purposes and for carrying out reforestation hunting (wild rabbits). During the early years of industrial rabbit production in Spain, rabbit meat production represented a business opportunity. Rabbit breeding started to move toward an industrialization and modernization process based on animal breeding, feed formulation and health plans. Rabbit meat production increased from 24,500 tons in the year 1970 to 69,279 tons in the late 80's to reach the full production in 1997, being 122,181 tons. A number of advances were also recorded at the time: medium farms became large-sized ones and small ones disappeared, and animals were housed in metal cages with equipping management, plus holding cages with nesting, females productive labor and the artificial insemination technique. In 1997, with the emergence of Epizootic Rabbit Enteropathy, domestic production was severely affected by the presence of this new disease, which destabilized almost all the farms in Spain (Licois et al., 2000). In fact, FAO statistics estimate a decline in production in 2000 of 15% if compared to 1997, which led farmers to alarming situations as a result of this disease and to modifying traditional management protocols in an attempt to overcome this serious problem. Since late 2004, rabbit breeding in Spain has remained in a situation of crisis, which became particularly acute in 2007 when, according to data compiled by the Spanish Ministry of Environment and Rural and Marine Affairs (2010a), a crisis broke out in which prices and the increased the price of grain for feed were influencing factors. It was then when the poor market situation of rabbit skin was exacerbated following the closure of the Chinese market, the traditional destination for tanning. Production as of this year ranged from 70,000 tons of meat per year (Figure 8). According to the census data published in the latest National Survey of Rabbit (2008), the national census amounted to 1,221,495 breeding females, with a total of 6,903,718 animals for both genders and age in 2007. In terms of Spanish regions, the Valencian Community ranked third, after Catalonia and Aragon with 158,459 females. This drop in the number of animals was between 16-20% as compared to the results of the 2004 survey, where the national census stated 1,458,387 breeding females and a total of 8,563,791 animals. The Spanish Ministry of Environment and Rural and Marine Affairs (MARM) data confirm that the rabbit meat-producing sector in Spain has remained in a crisis situation for years. The number of farms has decreased dramatically (54%) between 1993 and 2007. This crisis has been coupled with a significant decrease of 33.87% in the rate of average rabbit meat consumption per capita/year from 1999 to 2009 for Spain (Kallas and Gil, 2012). In 2009, the number of farms dropped by 11%, and by the end of the year, there were 4,090 farms. Latest data provided by Spanish Ministry of Agriculture, Food and Environment (MAGRAMA, 2011) reported numbers also dropped drastically in 2011, 3,806 farms were recorded on April 2011. Traditionally, the balance of foreign trade in the Spanish rabbit sector has been generally positive. However in recent years, the absolute stock value has gradually lowered. In 2009, 610 tons were imported (491 EU and other third world countries) and 2220 tons were exported (1883 to EU countries). Both exports and imports to/from the EU dropped. Rabbits. 11.
(40) A. General Introduction. are annually imported, especially from France, and are also exported to neighboring countries where rabbit meat production sometimes proves insufficient to cover its own consumption. The evolution of both Spanish rabbit meat production and the number of Spanish producing animals slaughtered in the last ten years increased until 2002, after which it lowered until 2004 and has remained constant to the present-day (Figure 9).. Number of producing animals slaughtered. 120000000. 100000000. 80000000. 60000000. 40000000. 20000000. 0 1994 1995 1996 1997 1998 1999 2000 2001 2002 2003 2004 2005 2006 2007 2008 2009 2010 Year. Figure 9. Evolution of the number of Spanish producing animals slaughtered (FAOSTAT, 2012).. As this section describes, the main weakness in modern rabbit production systems are problems related to rabbit health, which is probably also the main reason of farms closing through loss of competitiveness that this entails. Digestive troubles are the most important causes of losses (about 25% around weaning; i.e., 18-50 days of age) and the low welfarestatus in rabbit breeding throughout Europe. Consequently, antibiotherapy is extensively used to improve the digestive security of rabbits. However, the second main pathology problem in rabbit breeding relates to does’ health status, mainly linked with deficient corporal status and to intense reproduction rhythm, which could lead to large replacement rates (Rosell and de la Fuente, 2009) and worse general health on rabbit farms (Pascual et al., 2012). More effort made to improve knowledge on the female rabbit immune system and how management, genetic and feeding practices can affect the immune response of the females could help reduce the weaknesses of rabbit production linked to health.. 12.
(41) A. General Introduction. 2.. IMMUNE SYSTEM. 2.1.. Introduction. All organisms have mechanisms to defend against possible attacks by pathogens and foreign invasions. On the phylogenetic scale, these defence mechanisms significantly differ on the phylogenetic scale, with a tendency towards greater complexity and power of defense responses, and also towards the specific recognition of the pathogenesis of the most evolved species. The immune system has evolved to protect the host against the attack of foreign, potentially pathogenic, microorganisms. It does so by recognizing the antigens expressed by those microorganisms and by developing an immune response against all cells expressing them, with the ultimate aim of their elimination (O`Garra and Vieira, 2004). The first defense mechanism, and the most effective, is to prevent entrance of pathogens through the development of physical (such as skin and the mucosal surfaces) and/or chemical barriers (pH and various soluble factors, such as lysozyme interferon and complement). Such barriers are found in all living species and have unique characteristics depending on which organism is concerned. Along with these barriers, animals, invertebrates and vertebrates have a second level of complexity, which presents an immune system responsible for defense. In the case of invertebrates, they have only an innate immune system, which involves cellular components, (phagocytic cells) and soluble or humoral components. Only vertebrate animals have a third level of complexity, called an adaptive or acquired immune system, possessing T and B lymphocytes, and antibodies. Approximately 500 million years ago, two types of recombinatorial adaptive immune systems appeared in vertebrates (Panzer and Cooper, 2006). Among the key features setting them apart from invertebrate animals, vertebrates have the ability to not only specifically recognize an antigen (due to the wide variety of different receptors on the surface of T and B lymphocytes), but to recall previous exposures to antigen (memory) and to respond more effectively after getting back in touch with the same antigen (maturation of the immune response). In short, the infection site and type of pathogen largely determine which immune responses will be effective (Roitt et al., 1996). 2.2.. Organization of the rabbit immune system. Immune system development differs in various animal species (Jeklova et al., 2007b). At birth, rabbits are physiologically immature, hairless, and open their eyes on day 10 of life (Sterzl and Silverstein, 1967). Their lymphoid organs are not fully developed. First, lymphatic follicles start to form at the age of 2 weeks. During maturation, the numbers of follicles increase (Thorbecke, 1960; Jeklova et al., 2007a) and, moreover, lymphocyte subset distribution in spleen, lymph nodes and the peripheral blood of rabbits undergoes noticeable postnatal development. In any case, the rabbit’s lymphoid system is generally organized in the same way as that of other mammals (Drouet-Viard and Fortun-Lamothe, 2002). Lymphoid organs are classified as either primary or secondary organs (Roitt et al., 1996). Primary organs are the bone marrow and thymus, and are responsible for the production and. 13.
(42) A. General Introduction. maturation of lymphocytes. Secondary organs include the spleen, Peyer's patches, the appendix, tonsils and lymph nodes. They are responsible for further maturation of lymphocytes and initiation of an immune response (Weih and Caamaño, 2003). The bone marrow, thymus gland, fetal liver and the vermiform appendix are primary organs in rabbits. Thus, they acquire their repertoire of specific antigen receptors to cope with the antigenic challenges received during their lifespan (Roitt et al., 1996). Bone marrow (BM) resides within the medullary cavity of bones (Del Fattore et al., 2010). It is a network of connective tissue fibers, fat cells, blood vessels and blood-producing cells. BM produces both red and white blood cells, including lymphocytes. Both T and B lymphocytes are produced in BM. Young T-cells move to the thymus for final development, but B-cells remain in BM during maturation. At this time, IL-7 is secreted by stromal cells, which stimulate the growth and survival of B-cells and T-cells. Chemokine CXCL12 is responsible for early B-cell development stages (Janeway et al., 2001). This process is named lymphopoiesis and refers to the production of new lymphocytes (Snyder, 2012). Once B-cells have fully developed in BM, they are also released into circulation and the majority are located in secondary lymphoid organs. There are interspecies variations in the B-cell development and repertoire generation processes, which contrasts with the greater consistency of T-cell development. B-cell development in mice and humans, with postnatal B-cell generation of a new repertoire in BM throughout life, is regarded a 'standard' pattern; however in other species, the gut-associated lymphoid tissue (GALT) works as the primary lymphoid organ (Alitheen et al., 2010). The mammalian thymus arises as bilateral structures from the third pharyngeal pouch in the embryonic foregut (Manley, 2000; Boehm et al., 2003). On the basis of functional and epithelial components, three zones are recognized: a subcapsular zone, cortex and medulla (Fry and Donald McGavin, 2012) (Figure 10). Subcapsular zone Trabecula. Dead cell. Thymocyte Nurse cell. Dividing thymocyte. Medulla. Cortex. Cortical epithelial cell. Interdigitating dendritic cell Blood vessel Macrophage. Medullary epithelial cell Hassall`s corpuscles. Figure 10. Diagrammatic cross section of a portion of the thymus, showing several lobules separated by connective tissue strands (trabeculae). The densely populated outer cortex is thought to contain many immature thymocytes (blue), which undergo rapid proliferation coupled with an enormous rate of cell death. Also present in the outer cortex are thymic nurse cells (gray). The medulla is sparsely populated and is thought to contain thymocytes that are more mature. During their stay within the thymus, thymocytes interact with various stromal cells, including cortical epithelial cells (light red),. 14.
(43) A. General Introduction. medullary epithelial cells (tan), interdigitating dendritic cells (purple), and macrophages (yellow). These cells produce thymic hormones and express high levels of class I and class II MHC molecules. Hassalls corpuscles, found in the medulla, contain concentric layers of degenerating epithelial cells (Goldsby et al., 2003).. Thymus size is variable and depends on age. The thymus undergoes its maximum development at birth (Varga et al., 2011), but begins to diminish after sexual maturity. However, it is conceivable that T-cell generation within the thymus continues into adult life, albeit at a low rate (Roitt et al., 1996). The thymus is a primary or central lymphoid organ, which educates T-cells to identify foreign cells in the body, such as invading bacteria, and to mark them for destruction by other immune cells. T-cells precursors proliferate and mature in the thymus gland and learn to distinguish between self- and non self cells. Therefore, it plays an important key role in cell-mediated immunity (Dorko et al., 2011). Moreover it performs an important endocrine function by secreting thymic hormones involved in T lymphocytes development and antibody production (Roitt et al., 1996). At an early stage, T-cells precursors have both lymphoid and myeloid potential (Bleul and Boehm, 2000; Liu et al., 2005), and are characterized by the expression of CXC-chemokine receptor 4 (CXCR4) and CC-chemokine receptor 9 (CCR9) which, along with CCR7, play a central role in this precocious thymus colonization stage. In this differentiation stage, lymphoid cells also express stem- and progenitor-cell markers KIT (also known as CD117) and stem-cell antigen-1 (SCA-1) (Love and Bhandoola, 2011) (Figure 11). HSC. Subcapsular zone DN1/ ETP. DN2. Cortex DN3. DN4. DP pre-selection. DP post-selection Medulla. CD117 SCA-1. CD117 CD25. Low CD117 CD25 CD3. Low CD117 CD3 Pre-TCR. CXCR4 CCR7 CCR9. CXCR4 CCR7 CCR9. CXCR4 CCR7 CCR9. CXCR4. CD3 CD4 CD8 Pre-TCR. CD3 CD4 CD8 TCR. CXCR4 CCR9. CCR7 CCR9. Figure 11. Chemotactic receptors expressed by progenitors of thymocytes. CCR: CC-chemokine receptor; CXCR: CXC-chemokine receptor; DN: Doble negative; DP: Doble positive; ETP: Early thymic progenitor; HSC: Hematopoietic stem cells; TCR: T-cell receptor.. Bone marrow-derived T lymphocytes enter circulation, travel to the thymus and enter the subcapsular zone through the corticomedullary junction (Fry and Donald McGavin, 2012). The intrathymic development of T-cells consists of several phases which require a dynamic relocation of developing lymphocytes within the multiple architectural structures of this organ (Romano et al., 2012). In the subcapsular zone, lymphoid progenitor cells begin differentiation and selection processes, and develop into more mature naive T-lymphocytes as they traverse the thymic cortex to the medulla. In the cortex, the T lymphocytes that. 15.
(44) A. General Introduction. recognize self-molecules (i.e., major histocompatibility complex molecules), but not selfantigens, are permitted to mature by a process called positive selection. When both have been recognized, they are removed by macrophages at the corticomedullary junction during a process called negative selection. The cells that do not recognize major histocompatibility complex molecules (MHC) are removed by apoptosis (Fry and Donald McGavin, 2012), so they cannot harm the body. Traditionally, the developmental pathway is divided into three subsequent steps, as defined by peculiar immunophenotypic patterns: the CD4−CD8− double negative (DN) stage; the CD4+CD8+ double positive (DP) stage; the CD4−CD8+ or CD4+CD8− single positive (SP) stage (Romano et al., 2012). As seen in Figure 12, these steps are: (1) entry of lymphoid progenitor cells into the thymus; (2) generation of CD4+CD8+ double positive (DP) thymocytes in the cortex; (3) positive selection of DP thymocytes in the cortex; and (4) interaction of positively selected thymocytes with medullary thymic epithelial cells to complete thymocyte maturation and to, eventually, export mature T-cells from the thymus (5) (Romano et al., 2012). After maturing in the thymus, mature naive T lymphocytes leave the thymus through postcapillary venules in the corticomedullary region, enter the circulation and recirculate through secondary lymphoid tissues in a highly regulated manner (Fry and Donald McGavin, 2012), where most remain to become mature immunocompetent T lymphocytes. DN3 DN2. Subcapsular zone. DN4. DC DN1. HSC. Cortex Macrophage. POSITIVE SELECTION. DP cTEC Corticomedullary junction. ETP Fibroblast. CD4 SP. CD8 SP Medulla. SP NEGATIVE SELECTION mTEC SP. Thymus. Figure 12. Steps of T-cell development in humans. The lymphoid progenitor cell enters the thymus through the corticomedullary junction. DN thymocytes (CD4−CD8−) migrate across the subcapsular region and then the outer cortex. Interaction between DN cells and cTECs generates DP thymocytes (CD3+CD4+CD8+). Positively selected thymocytes interact with mTECs to complete the maturation process. In the medulla, self-reactive thymocytes are deleted, SP (CD3+CD4+or CD3+CD8+) thymocytes are generated and, eventually, the mature T-cells from the thymus are exported. cTECs: Cortical thymic epithelial cells; DC: Dendritic cell; DN: Doble negative; DP: Doble positive; ETP: Early thymic progenitor; HSC: Hematopoietic stem cells; mTECs: Medullary thymic epithelial cells; SP: Single positive (Adapted from Romano et al., 2012).. 16.
Figure


+7


Documento similar
Comparison of the experimental Ni K-edge XANES spectra for 1 Eq-ML of NiO on SiO 2 and MgO and the theoretical spectra calculated for both a NiO cluster (solid line) and for a
Here, we investigated the effect of fluoride- exposure on the reproductive ability of male rats and the relationship of oxidative damage and spermatozoa mitochondrial
No obstante, como esta enfermedad afecta a cada persona de manera diferente, no todas las opciones de cuidado y tratamiento pueden ser apropiadas para cada individuo.. La forma
The expansionary monetary policy measures have had a negative impact on net interest margins both via the reduction in interest rates and –less powerfully- the flattening of the
Jointly estimate this entry game with several outcome equations (fees/rates, credit limits) for bank accounts, credit cards and lines of credit. Use simulation methods to
In our sample, 2890 deals were issued by less reputable underwriters (i.e. a weighted syndication underwriting reputation share below the share of the 7 th largest underwriter
The program is based on the following pillars: (a) students become the main agents of their learning by constructing their own knowledge; (b) the teacher must be the guide to
This paper reviews the current available bone targeting drug delivery systems, focusing on nanoparticles, proposed for osteoporosis treatment.. Bone targeting delivery systems is
