Franchising survival: micro and macro considerations
61
0
0
Texto completo
(2)
(3)
(4) DEDICATORIA Y AGRADECIMIENTO A mis padres, el erudito y la muralla, de quienes aún veo destellos de eternidad: ¡Atención! que sus ojos miren al infinito, porque sus palabras, gestos y omisiones, atrapados aún con luz y brisas de vida, han gestado nuevos y brillantes futuros, escribiéndolos en mi sangre y mi risa; A mis mentores, los genios que han arado, a mi mentora, con quien tengo aura común, a su amiga, también mi mentora, de estricta razón, y a quien no le queda un pelo, sino enseñanzas de buena ambición, ¡A ustedes! ¡Gracias por el ruedo entrelazado! A mis amigos, el demonio, el perro y el pato, al cocinero torpe y su tocayo despistado, quienes de cena en cena, de charla en charla, retando sin vacile alguno al estándar, han conseguido mantener en todos nosotros, infinitas esperanzas, y grandes arrebatos; Y a mis inspiraciones, mis fábulas inauditas, al bosque de mi vida y la luna de mis cielos oscuros, a ellas, nacidas con temprana sabidurı́a e infinito clamor de mar profundo, ¡un gracias eterno y un abrazo de vibrante energı́a! Gracias a todos, a su realidad y su número finito, asignado a priori, en nuestra inquebrantable ley. Porras (2018). III.
(5) Contents 1. Introduction. 1. 2. Literature Review. 5. 2.1. First-mover advantages . . . . . . . . . . . . . . . . . . . . . . . . . . .. 5. 2.2. Country-level factors . . . . . . . . . . . . . . . . . . . . . . . . . . . . .. 8. 3. Data and methodology. 11. 3.1. Sample . . . . . . . . . . . . . . . . . . . . . . . . . . . . . . . . . . . .. 11. 3.1.1. Construction of the dataset . . . . . . . . . . . . . . . . . . . . .. 12. 3.1.2. Missing data . . . . . . . . . . . . . . . . . . . . . . . . . . . . .. 14. 3.2. Operationalization of variables . . . . . . . . . . . . . . . . . . . . . . .. 15. 3.2.1. Dependent variable . . . . . . . . . . . . . . . . . . . . . . . . .. 15. 3.2.2. Interest variables . . . . . . . . . . . . . . . . . . . . . . . . . . .. 15. 3.2.3. Control variables . . . . . . . . . . . . . . . . . . . . . . . . . . .. 16. 3.3. Descriptive analysis . . . . . . . . . . . . . . . . . . . . . . . . . . . . .. 19. 3.4. Methodology . . . . . . . . . . . . . . . . . . . . . . . . . . . . . . . . .. 24. 3.5. Model specification and diagnostics . . . . . . . . . . . . . . . . . . . .. 27. 4. Results. 29. 5. Conclusion and discussion. 33. References. 37. Appendix A. Sensitivity analysis. 43. Appendix B. Robustness analysis. 49. Appendix C. Atypical data. 52. IV.
(6) List of Tables 1.. Sample sources . . . . . . . . . . . . . . . . . . . . . . . . . . . . . . .. 11. 2.. Sample composition . . . . . . . . . . . . . . . . . . . . . . . . . . . . .. 12. 3.. Snapshot data example . . . . . . . . . . . . . . . . . . . . . . . . . . .. 13. 4.. Time-span data example . . . . . . . . . . . . . . . . . . . . . . . . . . .. 13. 5.. Failure rates by country and economic sector . . . . . . . . . . . . . . .. 19. 6.. Descriptive statistics . . . . . . . . . . . . . . . . . . . . . . . . . . . . .. 20. 7.. Firm-level variables correlation matrix . . . . . . . . . . . . . . . . . . .. 22. 8.. Country-level variables correlation matrix . . . . . . . . . . . . . . . . .. 22. 9.. T-tests for equality of means . . . . . . . . . . . . . . . . . . . . . . . . .. 23. 10. Estimation results from the Cox regressions . . . . . . . . . . . . . . . .. 30. A.1. Estimation results: Sensitivity analysis on the non-imputed data . . . . .. 43. A.2. Estimation results:. Sensitivity analysis on a sub-sample without. Venezuela . . . . . . . . . . . . . . . . . . . . . . . . . . . . . . . . . . .. 46. B.1. Estimation results: Robustness analysis . . . . . . . . . . . . . . . . . .. 49. V.
(7) List of Figures 1.. Franchise representation by country . . . . . . . . . . . . . . . . . . . .. 2. 2.. Country-level variables evolution, period 2009-2016 . . . . . . . . . . .. 21. VI.
(8) Resumen La franquicia es hoy en dı́a una parte representativa de la economı́a en varios paı́ses del mundo, ası́ como también es un tema de interés no solo para investigadores sino también para muchos otros agentes económicos. Su carácter multidisciplinario, las diferentes oportunidades que abre a nivel micro y macroeconómico, y su influencia positiva en el desarrollo económico, hacen el estudio de los factores que afectan su supervivencia un área de interés para franquiciadores, franquiciados y hacedores de polı́tica económica. En este contexto, este estudio contribuye a la literatura en curso de supervivencia de franquicias, haciendo un análisis de las variables que influyen en ella a nivel de empresa, y a nivel de paı́s anfitrión, al mismo tiempo y en diferentes sectores económicos, usando un conjunto de datos de sobrevivencia de cuatro paı́ses de América Latina y dos paı́ses de Europa, para el periodo 2009-2016. Los resultados de un modelo de regresión de supervivencia soportan las hipótesis de que, a nivel de empresa, a medida que una marca entra más temprano al mercado de franquicias, con mayor experiencia de negocio y con caracterı́sticas que evitan en mayor medida los problemas de agencia, esta tiende a incrementar su probabilidad de supervivencia. De la misma manera, conforme mejora la situación económica, institucional, de infraestructura y tecnológica de su paı́s anfitrión, la probabilidad de supervivencia de las franquicias también se ve incrementada.. Palabras clave: Franquicia, Análisis de supervivencia, Regresión de Cox, Ventajas del primer entrante, Factores macroeconómicos. VII.
(9) Abstract Franchising is nowadays a representative part of the economy in several countries worldwide, as well as it is a topic of interest not only to researchers, but to many other economic agents.. Its multidisciplinary nature, the different. opportunities it opens at the micro and macroeconomic levels, and its positive contribution to economic development, make the study of the factors that affect its survival, an area of interest for franchisors, franchisees and policy makers. In this context, this study attempts to contribute to the ongoing literature on franchising survival, by making an analysis of the variables that influence franchisors’ survival at the firm level, and at the country level, at the same time, and in different economic sectors, by using a survival dataset of four Latin American and two European countries, for the period 2009-2016.. The results of a survival. regression model support the set of hypotheses that first moving franchises, with greater business experience and with contract characteristics that avoid to a greater extent the agency problems, are more likely to survive. In the same sense, as the economic, institutional, infrastructural and technological situation in their host country improves, the franchise’s survival chances are also increased.. Keywords:. Franchising, Survival analysis, Cox regression, First-mover. advantages, Macroeconomic factors. VIII.
(10) 1.. Introduction Franchising is defined as a contractual vertical relationship between two. independent firms. One of them, known as the franchisor, sells his brand name and know-how to the other part, known as the franchisee, in exchange of a monetary compensation. This monetary compensation usually is in the form of a royalty and/or entrance fee (Blair and Lafontaine, 2005). In this relationship, the franchisee is an entrepreneur, and the usual hierarchical structure of employer-employee, is replaced by a risk sharing contract between the two franchise parts (Lafontaine, 1992). This organizational form is nowadays a representative part of the economy in many countries worldwide, as well as it is a topic of interest not only to researchers, but to many other economic agents, given its multidisciplinary nature and the different opportunities it opens at the micro and at the macroeconomic levels (Hoy and Stanworth, 2003). At the microeconomic level, authors as Bordonaba et al. (2009) and Michael (2014) suggest that this organizational form provides entrepreneurs the opportunity to enter the market with certain advantages, in comparison to independent business owners, so that they can achieve higher performance and lower failure rates. One such advantage is that franchisees enter the market with a shared and usually known trademark that gives the consumer a “unified experience over time and space” (Michael, 2014: pp. 612), given that the franchisor has developed standard operating procedures and routines that are transferred to the franchisee.. Furthermore, by. belonging to a brand, the franchisees can exploit the advertising developed by the franchisor to reduce costs and increase the franchisee’s outlet outcomes (Michael, 2014). At the macroeconomic level, it is suggested by different authors that franchising is a growing force, both in developed and emerging countries; and that it can be an economic development driver. Falbe and Welsh (1998), Kosová and Lafontaine (2012), Hussain et al. (2013) and Michael (2014) mention, on the side of developed countries1 , that the countries like United States and France have a significant representation of franchising in their economic outputs, with high growth rates in terms of turnover and 1 Obeying. the criteria of the UNDP (2017), which mentions that a developed country is the one with. a Human Development Index higher than 0.8.. 1.
(11) number of brands. Indeed, as shown in Figure 1, the turnover generated by franchising in the United States reached the 5.59% of the gross domestic product (GDP) in 2016. Also, the number of brands in this country has grown on an average of 9.14% between 2010 and 2016. France and Spain on their behalf have a turnover/GDP rate around the 2%, with average brand growth rates of 4.81% and 5.66% respectively. Likewise, Hoy and Stanworth (2003), and Brookes and Altinay (2017) mention that franchising has been growing at a high pace in emerging countries2 in the last years, reaching similar levels to the ones of developed countries, given its potential benefits. Two main examples of franchising forces from emerging countries are the cases of Brazil and Mexico. In Figure 1 it can be noticed that Brazil has almost the same number of brands (3039 franchises) as the United States (3828 franchises), as well as it has a similar brand growth rate (9.35%). In the same sense, Mexico reaches similar levels to the ones of France and Spain. Furthermore, in Colombia, the franchise industry has had a brand growth rate of 6.25% and a turnover/GDP rate of 1.9%, which are higher values than the ones from Spain.. Figure 1: Franchise representation by country. Data source: World Bank, Iberoamerican Franchise Association, World Franchise Council and French Franchise Federation (2017). 2 Those. with a Human Development Index between 0.7 and 0.8.. 2.
(12) Given the force of franchising in the globe economy, researchers have investigated if it can have influence on economic development. Kaufmann and Leibenstein (1988) and Michael (2014) have suggested that franchising has a positive significant effect on economic growth, and that it can be an economic development driver. If franchising can overcome the obstacles and challenges of their host countries, it can be a source of retail know-how to turn on the spark of the development process through job creation, business growth and the stimulation of entrepreneurial skills (Beck, 2010). However, it is stated by Lafontaine and Shaw (1998), and Kosová and Lafontaine (2010) that the brand growth rates, directly affected by the creation and failure of new brands, deserve a more profound analysis. This, since the entry and exit of brands to the market is a complex topic of study. So, it responds to different environmental and contract characteristics surrounding franchising.. Certainly, many researchers. throughout the economics and management literature have studied franchising survival, both of franchisor’s brands (e.g. Shane 1996, 2001; Lafontaine and Shaw, 1998) and franchisees’ outlets (e.g. Falbe and Welsh, 1998; Michael and Combs, 2008). Nevertheless, these articles study different factors that influence on survival, in an isolated way and in particular countries and industries. Such factors include the business experience before franchising (Lafontaine and Shaw, 1998), first-mover advantages (Bordonaba et al., 2009), as well as the effects of institutional quality (Shane and Foo, 1999). Given that franchising is a growing phenomenon and that it can contribute to the economic development of countries, the creation of “surviving-oriented” contexts is an area of interest for policy makers. Also, the research of factors influencing survival is of interest to franchisors and franchisees. Franchisors may want to know how to orient their contract policies and strategies in a way that their brands survive, and potential franchisees could use the empirical evidence as an aid to choose a brand to invest on (Shane, 1996; 2001). In this sense, this study contributes to the ongoing literature on franchising survival, by analyzing the variables that influence franchisors’ survival at the firm level, and at the country level, at the same time, and in different economic sectors, in the context of some Latin American and European countries, in the period 2009-2016. To this end, it proceeds as follows. Chapter 2 reviews the literature and. 3.
(13) develops the hypotheses. The data for the franchisors present in six countries (Brazil, Colombia, France, Mexico, Spain and Venezuela) between 2009 and 2016, the studied variables, and the econometric procedures are described in Chapter 3. The results from the empirical specifications using survival analysis models, concerning how firm-level and country-level factors affect franchising survival are provided in Chapter 4. Concluding comments are offered in Chapter 5.. 4.
(14) 2.. Literature Review In the previous section it was reviewed that franchising survival is influenced at the. same time by different factors at the firm and at the country level. On the side of the firm-level factors, it will be first developed the first-mover advantages hypothesis, applied to the franchising context. Then, the country level factors related to the economic, institutional, infrastructural and technological environments of the host countries to franchising will be analyzed.. 2.1.. First-mover advantages. Throughout the industrial economics literature, the entry timing strategy of firms, i.e. whether they decide to enter to a nascent or to an already developed market, has contradictory results on their survival chances (Bordonaba et al. 2009). Lieberman and Montgomery (1988; 1998) explain that the existence of both, advantages and disadvantages, depends on the firm’s strategies as a first-mover, its initial stock of resources and the economic sector where it will entry. To understand this variety of results, the three main sources of first-mover advantages will be explained, along with their mechanisms and possible failures. Such sources are: technological leadership, pre-emption of scarce assets and buyer switching costs. Technological leadership can happen through two mechanisms.. The first. mechanism refers to a learning curve, where the knowledge acquired by first-moving firms allows them to generate economies of scale, a main influence factor on the survival of new firms (Williamson, 1985). If firms can keep such knowledge, they generate entry barriers to later entrant businesses, due to the fact that they are not able to generate the same costs advantages than the first-moving firms (Spence, 1981; cited in Lieberman and Montgomery, 1988). A second mechanism consists on the research and development (R&D) and patent races, which take relevance when the technological advantage is a function of R&D expenditures. First-moving firms enjoy advantages with it because they become leaders on the technological race, being able to exploit the results and restrain their rivals. However, there is not any guarantee that pioneers will ensure a strong position on the market as time passes, especially if they do not take actions to sustain their acquired leadership. This could 5.
(15) happen because they can be overtaken by competitors who enter later with stronger resources or capabilities. Also, if the industry where the new firm is entering has a high degree of product technology change, the pioneer may fail due to its lack of ability to innovate or because it misses the best opportunities to innovate, given that new and evolving markets are shrouded by technological and market uncertainties (Lieberman and Montgomery, 1988; 1998). The industries where franchising competes, namely the retail and services sectors, are of relatively low technology (Michael, 2003). Nevertheless, the existence of specific kind of retail product technology and know-how, e.g. “secret recipes”, make this first source relevant to the purposes of this study. Franchisors can take advantages from the early registration of their know-how and innovation activities on new products, like it happens with many franchise industries when their products adapt to the host country culture (Alon et al., 2000; Baena, 2006). Through these strategies, franchisors can create brand loyalty, obtain profits and restrain their potential competitors. The second source of first-mover advantages, pre-emption of scarce resources, refers to the fact that first-movers are able to appropriate of existing scarce assets, either tangible or intangible, before their competitors. Specifically, pioneers can obtain earlier inputs, locations, infrastructure and equipment.. Because of their sooner. entrance to the market, pioneers will have superior information and may be able to acquire assets at lower prices than their later entrant competitors. Also, first-movers can take advantage of unattended (and attractive) niches, and cover their unsatisfied demand, either in geographical, technological or customer perceptual space. Additionally, these firms can invest on plant and equipment with an enlarged capacity, allowing them to produce with lower costs and sell at lower prices, generating entry barriers (Lieberman and Montgomery, 1988; Couerderoy and Durand, 2004). Nevertheless, it is mentioned by Lieberman and Montgomery (1998) and Michael (2003) that these advantages, aided by the initial existing resources of the firm, must be secured through the continuous investment in organizational and complementary assets. If such investments are not made, late entrant firms with a higher resource base may become a strong competition, causing first entrants to fail, or even acquiring them, increasing the last entrant own resources, skills and market position. This point of view is compatible with the resource scarcity theory proposed by. 6.
(16) Oxenfeldt and Kelly (1969) 3 . Indeed, franchisors sell their know-how and the right to sell their products to franchisees, who have scarce resources, to expand their brand and reach the needed economies of scale in order to stay on the market (Shane and Foo, 1999; Michael and Combs, 2008). Evidently, after the franchise enters the market, it must acquire new organizational, marketing and other complementary assets (e.g. new technologies and marketing material) to ensure its position, either by investing the profits generated through their own outlets, or with the investments made by new and existing franchisees. Finally, a late-entrant firm must invest extra resources to attract customers away from the first-mover, especially when the first mover has used its resources and leadership to create an industry standard. These costs include transaction costs and investments that the buyer makes in adapting to the new product, the training of new suppliers and the investment on marketing, software and any other assets necessary for the switch of the costumers to his or her product (Lieberman and Montgomery, 1988). In the case of franchising, first-movers also benefit from brand loyalty. Given that they arrived earlier to the market, customers are more likely to desire the characteristics of their product, rather than the one of late-entrants (Carpenter and Nakamoto, 1989), increasing the buyer switching costs of late-entrant franchises. In this context and supporting the research of Bordonaba et al. (2009) in a wider geographical context, franchisors are said to benefit from the early acquirement of knowledge, strategic scarce resources and consumers loyalty, which allows them to create the needed economies of scale to survive. Therefore, it is proposed that: Hypothesis 1 (H1). First-moving franchisors are less likely to fail.. 3 Resource. scarcity theory suggests that firms would likely expand through franchising on their initial. steps of life because they have capital, informational and managerial constraints (Combs and Ketchen, 1999). When they have reached a minimum level of economies of scale, they will bend toward companyowned outlets, re-acquiring the franchised ones (Oxenfeldt and Kelly, 1969).. 7.
(17) 2.2.. Country-level factors. Firm survival, and specifically, franchising survival, does not only depend on firm characteristics, but also on the environment where it develops (i.e. their host country), which is represented by variables like economy, technology, infrastructure and institutions. On the economy side, researchers like Buddelmeyer et al. (2006) and Ejermo and Xiao (2014) found that the failure probability of entrepreneurs increases on recession times; situation that would be explained through business cycle theory. As mentioned by Lucas (1976), business cycle theory attempts to explain why aggregate variables go under repeated fluctuations on a similar trend, which is said to be common to all decentralized market economies. In this context, Parker (2009) suggests that on economic recessions, a fall on the gross domestic product (GDP), accompanied with an increase on the unemployment rates would have two effects on entrepreneurship and firm survival. First, the unemployed population would have incentives to become self-employed and engage into entrepreneurial activity to get out of the unemployment. Second, a fall on the real GDP, based on a fall on the demand levels of goods and services, would lead to capital unavailability and lower profits of firms, causing the exit of many entrepreneurs. On the other hand, when the economy grows, there will be a “prosperity pull effect”, generating a boost effect on entrepreneurial activity. Hence, based on this behavior explanation, it is proposed that: Hypothesis 2 (H2). When the host country’s economy grows, franchisors are less likely to fail. Likewise, a country’s technology and infrastructure levels of development influence on a firm’s performance and survival. Goldman (1981, 2001) suggests that for the successful transfer of retail technology and formats, the host country must have adequate infrastructure, complementary technologies and according shopping patterns. When such conditions are met, the newly arrived retail establishments would have the chance to reach the needed economies of scale to have successful operations; and thus, survive (Williamson, 1985). For example, a fast food chain, which depends on its availability to store frozen supplies, can not operate if it does not have sufficient access to cooling systems and storing infrastructure. In the same 8.
(18) sense, security services chains and real estate franchises depend on computers and internet servers availability. This is called by Goldman (1981) as an “operational dependency”.. Moreover, Reinartz et al.. (2011) suggest that the absence of a. well-developed and functioning retailing distribution network,. marketing and. communication systems, transportation, and storage infrastructure is a major challenge faced by international retailers trying to expand.. Focusing on the. technology conditions of the host countries, the authors mention that expanding retailing brands face some challenges in all countries, i.e. mature, emerging and less developed countries. These challenges include the improvement of process efficiency with new technology, integrating technology in product offerings, and applying new information technologies for business intelligence and for cashless payment methods. When these challenges are successfully overcome due to the development of the country’s level of technology, retailers will have more innovation, better competition capacity and performance, which are key factors for their success (Ganesan et al., 2009; Verhoef et al., 2010). Therefore, when a host country does not satisfy the infrastructure and technology requirements of new chains, they reduce their operational efficiency, level of innovation and competitiveness, making them to incur in higher costs and reducing their probability of surviving. In this context, and on the technology side, if it is considered that a technologically well-established country would likely export their technologies, rather than importing them, it is hypothesized that: Hypothesis 3a (H3a). In countries characterized by high concentration towards technology exporting, franchisors are less likely to fail. Also, regarding the infrastructure levels of the host country, it is hypothesized that: Hypothesis 3b (H3b). In countries with high levels of infrastructure quality, franchisors are less likely to fail. Finally, franchising survival also depends on the institutional environment of its host country. Aliouche and Schlentrich (2011), who studied the effects of political and legal factors on the internationalization decision of franchisors, suggest that countries. 9.
(19) with large markets4 and strong political and legal systems are more attractive to U.S. franchisors that decide to internationalize. Such conditions could reduce their risk, give them new market opportunities, and therefore, enhance their survival chances. According to Aydin and Kacker (1990), adverse political and economic conditions can be seen as sources of risk for expanding franchises, because under such environments, the government decisions may affect business operations, reducing the profits and even generating losses. Restrictive laws, expropriation of assets, armed conflicts, social unrest, and other situations, born from a lack of institutionality, may lead to economic and political instability, which generate negative impacts on firms (Aliouche and Schlentrich, 2011). Indeed, political instability, also characterized by frequent switches of policies, collapse of governments, and in some occasions, mass violence and civil wars (Alesina and Perotti, 1996), will negatively affect firm innovativeness and performance because entrepreneurs and investors will have a higher degree of risk, and even, some of them will tend to relocate their capital in more stable countries (Alesina and Tabellini, 1989; Krammer, 2016). Furthermore, McMillan and Woodruff (2002) and Che et al. (2017) find that the presence of strong institutional quality,. characterized by the protection of property rights and. reinforcement of contracts, as well as the formal institutions support to avoid instability, specially for the case of developing countries, has a positive influence on the firm’s survival. In this context, it is hypothesized that: Hypothesis 4 (H4). In countries with strong institutionality, franchisors are less likely to fail.. 4 Understood. as markets with a large population and high purchasing power.. 10.
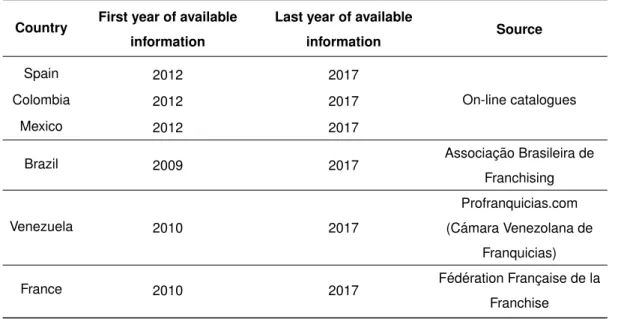
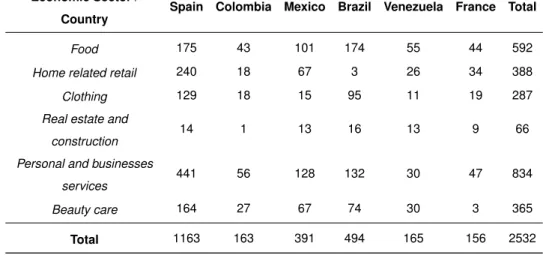
(20) 3.. Data and methodology. 3.1.. Sample. This study is performed using two main data sources regarding the information of six countries selected in basis of their data availability: Brazil, Colombia, France, Mexico, Spain and Venezuela. The first source regards the country-level variables and the other, the firm level characteristics. All the country-level variables were taken from the World Bank Data Bank, and the firm level characteristics were taken from the franchising associations and on-line catalogues listed in Table 1. Table 1: Sample sources First year of available. Last year of available. information. information. Spain. 2012. 2017. Colombia. 2012. 2017. Mexico. 2012. 2017. Brazil. 2009. 2017. Country. Source. On-line catalogues. Associação Brasileira de Franchising Profranquicias.com. Venezuela. 2010. 2017. (Cámara Venezolana de Franquicias). France. 2010. 2017. Fédération Française de la Franchise. Regarding these data, it is presented in Table 2 the number of brands whose data were collected, by country and by economic sector. Given that each association and on-line catalogue has its own classification, it was necessary to join those sectors that shared some similarities, resulting on a total of six homogenized economic sectors. These sectors are: food, home related retail, clothing, real estate and construction, personal and business services, and beauty care.. 11.
(21) Table 2: Sample composition Economic Sector /. Spain Colombia. Mexico Brazil Venezuela. France. Total. Country Food. 175. 43. 101. 174. 55. 44. 592. Home related retail. 240. 18. 67. 3. 26. 34. 388. Clothing. 129. 18. 15. 95. 11. 19. 287. 14. 1. 13. 16. 13. 9. 66. 441. 56. 128. 132. 30. 47. 834. Beauty care. 164. 27. 67. 74. 30. 3. 365. Total. 1163. 163. 391. 494. 165. 156. 2532. Real estate and construction Personal and businesses services. Finally, it is necessary to give some details about the construction of this database, which is outlined in the following subsection. 3.1.1. Construction of the dataset For the analysis, this study has a “multiple record per subject” survival data, because there was registered year-to-year data for each subject on the intervals described in Table 1. The collected data is called as survival data because it records the time until a certain event occurs, i.e. the time until a brand stops franchising or ceases to exist. Originally, this dataset was organized as what in survival analysis is called as snapshot data; meaning that there was a record of data for each point on time where a brand was observed. An illustrative example of two brands located in Spain, from the “beauty care” sector, is shown in Table 3, where, for each record, it is shown the name of the brand (Brand), the year of observation (Year), the survival status (Failed) and time (Survival time), and an example vector of variables X that includes the initial capital in U.S. dollars, and the number of years of business experience before franchising.. It can be noticed that in the year when a brand fails, there is not. information on the covariates vector. Given this, such a kind of arrangement cannot be analyzed directly with survival analysis econometric techniques, because this analysis can only be done with time-span data (Cleves et al., 2010). The latter type of dataset records an interval of time, rather than points in time. Therefore, the dataset was converted to a workable format, as shown in Table 4. 12.
(22) Table 3: Snapshot data example Brand. Failed. Year. Survival time. Initial capital. (Yes=1/No=0). Years of experience. (in USD). Infinit Fitness. 2013. 0. 0. 194919.70. 1. Infinit Fitness. 2014. 0. 1. 231116.70. 1. Infinit Fitness. 2015. 0. 2. 267313.70. 1. Infinit Fitness. 2016. 0. 3. 303510.60. 1. Happy Smoky 2013. 0. 0. 7568.05. 0. Happy Smoky 2014. 0. 1. 7627.51. 0. Happy Smoky 2015. 1. 2. .. .. Table 4: Time-span data example Brand. Yeart. Infinit Fitness. Yeart+1. Failed. Survival time. Initial capital. Years of experience. (in USD). (Yes=1/No=0). 2013. 0. 0. Infinit Fitness. 2013. 2014. 0. 1. 194919.70. 1. Infinit Fitness. 2014. 2015. 0. 2. 231116.70. 1. Infinit Fitness. 2015. 2016. 0. 3. 267313.70. 1. 2013. 0. 0. Happy Smoky Happy Smoky. 2013. 2014. 0. 1. 7568.05. 0. Happy Smoky. 2014. 2015. 1. 2. 7627.51. 0. With this transformation the data is expressed in intervals of time, formally noted as (Y eart , Y eart+1 ], where it is implicitly assumed that the covariates; namely, the initial capital and business experience, do not vary over such an interval. These covariates, because of their not varying nature, are called “enduring variables”. Also, the indicator variable of survival (event) has taken the value of 1 at the end of the interval where a brand died, rather than the beginning of the next interval; therefore, dropping the record with no data for a dead brand. This last kind of variable is known as an “instantaneous variable” (Cleves et al., 2010). Now that the data has the appropriate structure for survival analysis, it is necessary to discuss about some missing data issues.. 13.
(23) 3.1.2. Missing data Given the nature of the data sources, namely, franchising associations and on-line catalogues, there is missing data on the predictor variables, on an average of 40%. Due to this fact, a Little’s test for data missing completely at random or MCAR (i.e. data missingness does not depend on the observed or missing values of the set of used variables) was carried out to see whether imputation was possible or not. This is a global test that, using all the available information, proves with a chi-square statistic the null hypotheses of MCAR (Little, 1988). Such a test resulted in a p-value of 0 (chi-square = 793.93), suggesting that the data is not MCAR, and that imputation is possible. As explained by authors like Lafontaine and Shaw (1998), and Kosová and Lafontaine (2010), the situation of missing data in franchising research is usual and often with no possibility of retrieving complete data. To solve possible bias on the estimators, given that missing data reduce the sample size, a range of possible solutions is considered, now described. The most suggested solution is multiple imputation (Bacik, 1997; Allison, 2014). Allison (2014) argues that, on survival analysis, it is recommended the use of multiple imputation by the method of regression, using the survival times and states as explicative variables. Nonetheless, the used data can not be treated this way, since most variables’ have missing values. Hence, multiple imputation was discarded. Given that franchise contracts do not vary in a significant way over time in comparison to their initial conditions (Shane, 1996; Lafontaine and Shaw, 1998), for each brand, three cases of missing values were completed with interpolation, here explained: The brand existed on year t and had data on periods t + 1 and t + 2. The brand existed on year t and had data on periods t − 1 and t − 2. The brand existed on year t and had data on periods t − 1 and t + 1. Afterwards, the remaining missing data was completed using the mean by country, economic sector and year. Finally, for the macroeconomic data, there was missing data for 2017 on many indicators, which were imputed by making a linear regression. 14.
(24) 3.2.. Operationalization of variables. 3.2.1. Dependent variable The dependent variable in survival analysis is the waiting time until a certain event occurs. In this case, it is defined as can be seen below.. Survival time: Is the number of years that each franchisor has survived since it adopted the franchising organizational form.. 3.2.2. Interest variables The independent variables of interest are as follows:. Entry time (H1): Defined as the time difference in years between the establishment of the studied brand and the earliest entrant franchisor to the host country.. Entry time sector (H1): Defined as the time difference in years between the establishment of the studied brand and the earliest entrant franchisor on the sample to its economic sector, to the host country.. GDP growth (H2):. It is the annual percentage growth rate of the GDP, which is. calculated in constant 2010 U.S. dollars.. Technology exports (H3a): It represents the information and communication technology goods exports as percentage of the total goods exports, including computers and peripheral equipment,. communication equipment,. consumer. electronic equipment, electronic components, and other information and technology goods (miscellaneous) (World Bank, 2017).. Logistics. performance. (H3b):. It. represents. the. quality. of. trade. and. transport-related infrastructure where 1 is the lowest level and 5, the highest (World Bank, 2017). This index is published every two years and it was completed using a linear regression method.. 15.
(25) Political stability (H4):. This variable measures the people’s perception of the. likelihood of political instability and/or politically-motivated violence, including terrorism. As this indicator increases, the lower is the perception of the population towards the likelihood of instability (World Bank, 2017), denoting a stronger institutionality.. 3.2.3. Control variables Following the findings of Shane (1998), it is argued that franchise systems are more likely to survive if they economize on agency costs. Specifically, according to this author, agency theory suggests that the environment “select franchisors for survival” to those that use their contract terms to reduce the incentives for franchisors and franchisees to engage in adverse selection, moral hazard and hold-up problems. Nonetheless, Lafontaine and Shaw (1998) suggest in their research that the chain usually listed characteristics on directories, like the royalty rate, the advertising fee, the franchise fee, the amount of capital required, and the sector of operation have little capacity to explain survival. Due to this result, and to the availability of data, this section focus on three main contract characteristics as control variables: initial cash investment, royalty rates, and contract length.. Initial capital:. This variable measures the initial cash investment, listed by the. brand on the respective directory, in 2010 U.S. dollars. As it becomes larger, it is stated to reduce the franchisee moral hazard and adverse selection problems. On one hand, moral hazard is reduced because in the franchise arrangement, rather than the employer-employee relationship, franchisees have greater incentives to work harder than outlet operators (managers), because they make cash and time investments (Lafontaine and Kaufmann, 1994; Shane, 1998). On the other hand, the size of a franchisee’s cash investment serves as quality signal. Potential franchisees signal their ability through this mechanism because talented ones think that paying a higher initial cash investment is worthier than less talented ones do (Shane, 1998). Given these reasons, it is expected that the greater the initial cash investment, the lower the probability of franchisors to fail is.. 16.
(26) Contract duration: years.. This variable measures the contract duration of the franchise in. Shane (1998) suggests that the larger the contract length, the lower the. probability of franchisors to fail, given that a larger contract duration can reduce agency problems. This is explained with the fact that with more time, franchisors can obtain information about their franchisees behavior and the environmental factors that influence the performance of the outlets, even achieving a clearer separation between the two factors influence. Thus, they will give more incentives to the franchisee to have a proper behavior, because they have more to earn.. Royalties: This variable measures the royalty rate required by the franchisor. Shane (1998) suggests that royalties can control franchisee free riding and hold-up problems. Royalties compensate the investments made by the franchisors in terms of training, advertising and outlets auditing, helping to the solution of a possible hold-up problem on behalf of the franchisee (Brickley and Dark, 1987). Also, new possible franchisees see the royalties as “a measure of the franchisor’s incentive to develop and uphold system assets”, meaning to them that franchisors care on minimizing agency costs (Shane, 1998). Kosová and Lafontaine (2010) mention that high quality chains could establish higher royalty rates or require high levels of investment, at the time that they tend to last longer. In this context, it is expected that having higher royalty rates is related to a lower probability of failing.. Experience: This variable represents the franchisor’s experience in his business, before adopting the franchising distribution form. It is measured as the number of years between the year the firm was born and the one it began franchising. As it was mentioned earlier, Lafontaine and Shaw (1998) conclude from their study that the contract characteristics, usually listed on the franchise directories, have little predictive capacity on survival.. For them, the main factor explaining franchising. survival is the number of years that the franchisor has been in business before starting the franchising modality. These authors propose that the franchises that spend more time developing their prototype product and polishing their operating procedures and manuals, are more likely to survive in comparison to the ones who are not. In this context, from 1998 onwards, investigations on franchising survival. 17.
(27) listed the previous experience on business as a control variable, always obtaining the previously predicted effect (e.g. Bordonaba et al. 2009; Kosová and Lafontaine, 2010). Hence, it is expected a negative influence of experience on failure rates.. Finally, it is also needed to control for industry, country and other unobservable effects, through the following variables:. Economic sector:. Defined as the economic sector where the brand operates. Due. to the fact that all catalogues and associations manage different classifications, this variable was homogenized in the following six categories: food, home related retail, clothing, real estate and construction, personal and business services, and beauty care.. Country: Categorical variable that represents the country where the brand is studied.. Foreign: Dummy variable that takes the value of 1 if the franchisor is a foreigner regarding the reference country.. Multi-presence: Dummy variable that takes the value of 1 if the brand is present in more than one country of the sample.. 18.
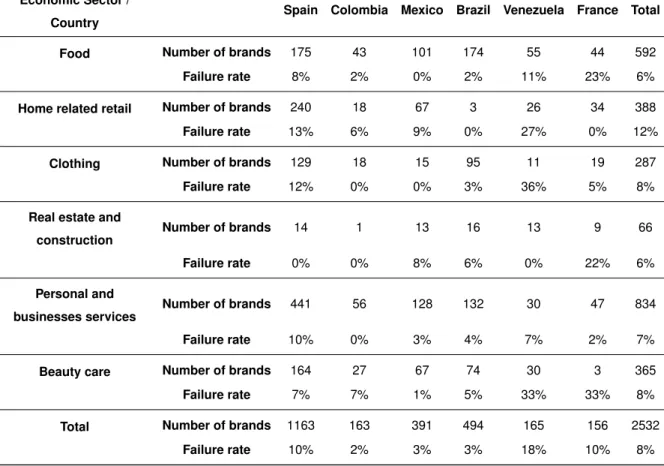
(28) 3.3.. Descriptive analysis. The failure rates of the brands included in the sample is detailed in Table 5, by country and economic sector. Table 5 shows that most of the franchisors operate on the food and personal and business services industries, which are the sectors with the lower failure rates. Likewise, the sector with the highest failure rate is the home related retail. However, these rates are not so different between each other. Table 5: Failure rates by country and economic sector Economic Sector /. Spain Colombia. Mexico Brazil Venezuela. France Total. Country Food. Home related retail. Clothing. Real estate and. Number of brands. 175. 43. 101. 174. 55. 44. 592. Failure rate. 8%. 2%. 0%. 2%. 11%. 23%. 6%. Number of brands. 240. 18. 67. 3. 26. 34. 388. Failure rate. 13%. 6%. 9%. 0%. 27%. 0%. 12%. Number of brands. 129. 18. 15. 95. 11. 19. 287. Failure rate. 12%. 0%. 0%. 3%. 36%. 5%. 8%. Number of brands. 14. 1. 13. 16. 13. 9. 66. Failure rate. 0%. 0%. 8%. 6%. 0%. 22%. 6%. Number of brands. 441. 56. 128. 132. 30. 47. 834. Failure rate. 10%. 0%. 3%. 4%. 7%. 2%. 7%. Number of brands. 164. 27. 67. 74. 30. 3. 365. Failure rate. 7%. 7%. 1%. 5%. 33%. 33%. 8%. Number of brands. 1163. 163. 391. 494. 165. 156. 2532. Failure rate. 10%. 2%. 3%. 3%. 18%. 10%. 8%. construction. Personal and businesses services. Beauty care. Total. Regarding to the firm-level variables, their descriptive statistics are presented in Table 6. These statistics show that almost all variables are of heterogeneous nature, given that their standard deviations are higher than the means, with the exception of the contract duration and the entry time. Due to this fact, the initial capital variable was transformed to its logarithmic form. Also, in the mentioned statistics one can see that on average, brands enter their host country market forty-five years later than the first franchise.. 19.
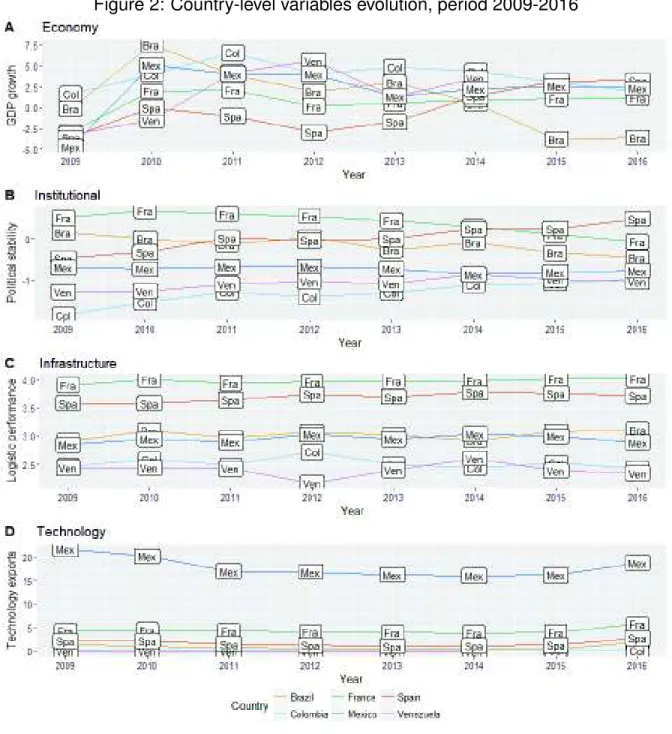
(29) Table 6: Descriptive statistics Variable Initial capital. 2009. 2010. 2011. 2012. 2013. 2014. 2015. 2016. (n=338). (n=638). (n=654). (n=1540). (n=1746). (n=2005). (n=2258). (n=2371). 94549.72. 186292.40. 187150.90. 126965.50. 113685.50. 108855.30. 86965.75. 85992.86. (428142.8). (420991.4). (106482.2) (258879.3) (339100.5) Royalty rates. Contract duration. Foreign. Experience. (516966.3) (483364.4) (466269.2). 0.07. 0.07. 0.07. 0.04. 0.05. 0.04. 0.04. 0.04. (0.08). (0.08). (0.08). (0.06). (0.07). (0.06). (0.06). (0.06). 5.08. 5.41. 5.64. 5.85. 5.86. 5.70. 5.66. 5.71. (1.56). (2.28). (4.36). (4.85). (4.82). (4.6). (3.84). (3.62). 0.09. 0.12. 0.13. 0.16. 0.15. 0.13. 0.12. 0.12. (0.29). (0.33). (0.33). (0.36). (0.35). (0.34). (0.33). (0.33). 11.69. 11.36. 11.53. 9.96. 9.73. 9.48. 9.23. 9.21. (15.18). (16.19). (16.14). (14.55). (14.47). (14.13). (13.91). (14.03). 44.82. Entry time. (15.84). The first row on each variable shows its mean. Standard deviations on parenthesis. “n” stands for the number of brands analyzed on each year.. Regarding to the contextual level variables, their evolution is shown in Figure 2. In graph A, it can be noticed that almost all the countries in the sample have similar growth trends, with Spain leading the rank in 2016. The exception to this behavior is Brazil, that suffered a fall in 2015 and 2016, and Venezuela, which data is not available for 2015 and 2016.. Graph B instead, shows the political stability of. countries. Here, Venezuela and Colombia have lower performance in comparison to the other four countries, while France and Spain always lead the ranking.. The. infrastructure environment of the host countries (graph C), it can be noticed that France and Spain always lead the ranking, being followed by Mexico and Brazil. In the last plot (graph D), Mexico shows higher technology good exports than the other countries on the sample, while France and Spain lead the rest of the countries, and Brazil, Colombia and Venezuela have export levels near to zero. These facts relate to the hypotheses given that, as Venezuela is almost always on the lower positions of the graphs, it also has the higher failure rates; while Brazil and Mexico, being in the middle of the rankings, have the lowest failure rates. Nonetheless, this has to be analyzed with multivariate techniques.. 20.
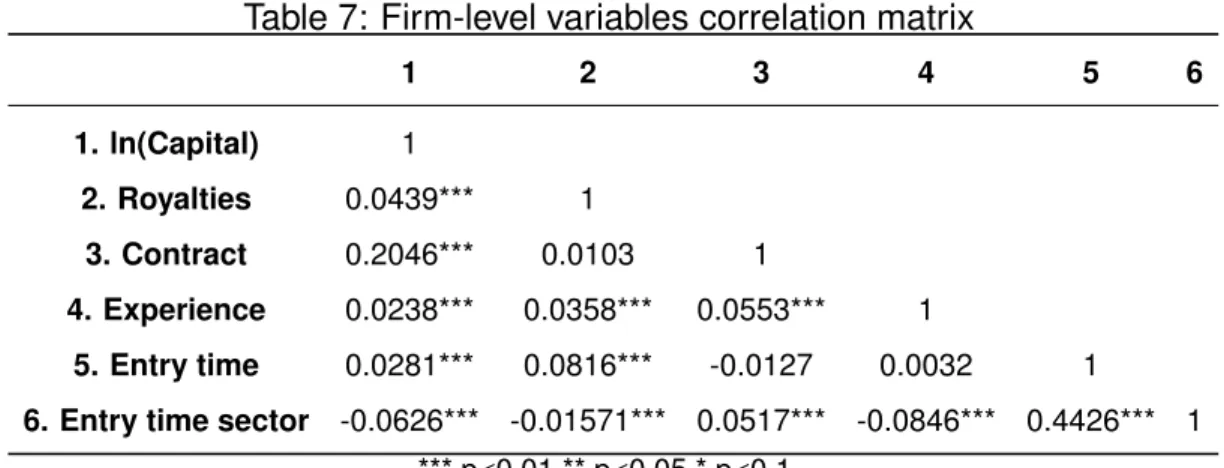
(30) Figure 2: Country-level variables evolution, period 2009-2016. Data source: World Bank (2017). Additionally, the correlation matrices of the firm and country-level variables are presented in Tables 7 and 8, because it will not make sense to analyze them together. In Table 7 it can be seen that both variables used to prove H1 are significantly correlated, with a high value, compared to other correlations here presented. They are not identical in their relationship with other variables, although they don’t have relatively high values. This situation has its roots on the fact that the “Entry time 21.
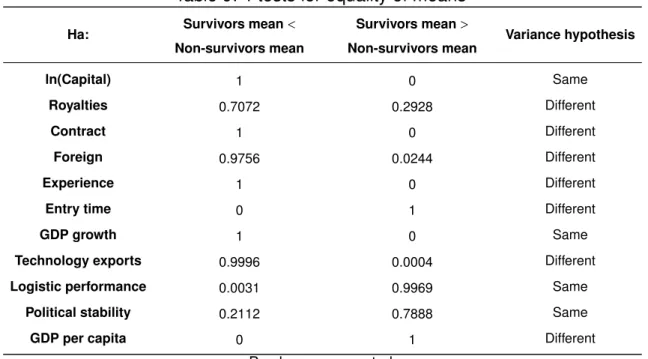
(31) sector” variable has limited information on its construction given that the first entry brand to a certain sector in the sample, is not necessarily the first-entrant franchise to the host country. It must be noticed from Table 8 that all the country-level variables have high degrees of correlation between them, which was taken into account at the time where the regressions were made. Table 7: Firm-level variables correlation matrix 1. 2. 3. 4. 1. ln(Capital). 1. 2. Royalties. 0.0439***. 1. 3. Contract. 0.2046***. 0.0103. 1. 4. Experience. 0.0238***. 0.0358***. 0.0553***. 1. 5. Entry time. 0.0281***. 0.0816***. -0.0127. 0.0032. 6. Entry time sector -0.0626*** -0.01571*** 0.0517***. 5. 6. 1. -0.0846*** 0.4426***. 1. *** p<0.01 ** p<0.05 * p<0.1. Table 8: Country-level variables correlation matrix 7. 8. 9. 7. GDP growth. 1. 8. Technology exports. -0.2733***. 1. 9. Logistic performance. 0.9632***. -0.2209***. 1. 10. Political stability. 0.7856***. -0.4609***. 0.8105***. 10. 1. *** p<0.01 ** p<0.05 * p<0.1. To close this first analysis, mean t-tests were carried out on all the covariates between survivors and non-survivors. The results of these tests are reported in Table 9. Evidently, to carry on these tests, it was proved first if the two groups had the same variance.. 22.
(32) Table 9: T-tests for equality of means Survivors mean <. Survivors mean >. Non-survivors mean. Non-survivors mean. ln(Capital). 1. 0. Same. Royalties. 0.7072. 0.2928. Different. Contract. 1. 0. Different. Foreign. 0.9756. 0.0244. Different. Experience. 1. 0. Different. Entry time. 0. 1. Different. GDP growth. 1. 0. Same. Technology exports. 0.9996. 0.0004. Different. Logistic performance. 0.0031. 0.9969. Same. Political stability. 0.2112. 0.7888. Same. GDP per capita. 0. 1. Different. Ha:. Variance hypothesis. P-values are reported The fourth column shows the variance assumption used for each test, based on an F-test for equality of variances. These tests suggest that the inclusion of almost all the predictor variables is justified, with the exception of the royalties and political stability variables, where it was not found a statistically significant difference between survivors and non-survivors. However, these variables would not be excluded to see their effects in the presence of other variables. The utility of this analysis has its roots on giving a glance at the predicted effects by the theory. In fact, the t-tests results show that the initial cash investment, the contract length and the experience before business is higher for survivors than for non-survivors. Moreover, the GDP growth, technology exports, and logistic performance are higher for survivors than for non-survivors.. 23.
(33) 3.4.. Methodology. To analyze the factors underlying franchising survival, this study relies on what is called as survival analysis. Survival analysis is used to analyze data that has as a dependent variable the waiting time until a certain event occurs. In this case, the time until a brand stops franchising or ceases to exist. This kind of analysis was selected because other used techniques, like the logit and probit regressions5 , are not completely fit for the task due to the fact that they do not take into account the problem of censoring, like the survival analysis techniques can (Allison, 2014). To have a better understanding, let us begin by denoting the survival time of a firm as T , which is a random variable. Based on this time, a franchise will have a hazard function, assessing its instantaneous risk of failure, as shown on equation 1. Pr [(t ≤ T < t + ∆t) | T ≥ t] ∆t ∆t→0. h(t) = lim. (1). Evidently, one may desire to explain this time of surviving with a vector of covariates.. Hence, a usual survival regression, that admits such a situation, is. specified as it can be seen on equation 2.. hi (t) = h0 (t) exp(β1 Xi1 + ... + βk Xik ). (2). Here, h(t), the dependent variable, is the hazard function of equation 1, h0 (t) is a baseline hazard, Xj stands for the covariates and βj stands for their respective effects. The estimation of this regression can be done with parametric and semi-parametric econometric techniques, whose difference lies on the baseline hazard function. The Cox proportional-hazards regression model, selected for this study and developed by Cox (1972), is a semi-parametric method of estimation because it does not make specific assumptions about the probability distribution of the failure times and errors (i.e. the baseline hazard function keeps unspecified as h0 (t)6 ), like the survival analysis parametric specifications and other econometrical techniques do (e.g. the tobit and the negative binomial regressions7 ). Furthermore, this kind of 5 For. examples see the works of Bates (1995), and Lafontaine and Shaw (1998). that h0 (t) is unspecified, the regression must be estimated through special procedures.. 6 Given. Specifically, it has to be estimated by the method of partial likelihood, equally developed by Cox (1972). 7 For examples see the works of Kalnins (2005), and Michael and Combs (2008).. 24.
(34) regression is the most used econometric technique in the franchising survival literature. Authors like Shane (2001), Bordonaba et al. (2009) and Kasová and Lafontaine (2010), have proven its ability to fit the characteristics of the data to explain franchising survival, both when using panel and cross-sectional databases. The only assumption of this methodology is that the hazards ratio, i.e. the ratio of the hazard rates corresponding to the conditions described by two levels of an explanatory variable, is independent of t. This means that a firm, given that it has the same value on an explanatory variable on two points on time, has the same probability of failure irrespective of the time that it has already survived. In this context, it is proposed the following general specification: hi (t) = h0 (t) exp(β1 Control variablesit + β2 Hypothesized variablesit ). (3). Where i stands for the brand and t for the year on the time intervals specified in Table 1. Equation 3 is estimated in 6 models. The first three including the entry time variables8,9 (H1), without any country-level factors, and the next ones, including a context variable (H2 to H4), one each, given the high correlation between such variables (Variance Inflationary Factor -VIF- value of 22.03). As was mentioned before, whatever it is the method of estimation, a “nearly universal feature” of survival data is censoring (Fox and Weisberg, 2011). The most common form of censoring in franchising survival is right-censoring, where at the end time of the study, some brands are still alive, and therefore the exact time of failure is not known. Additionally, Kosová and Lafontaine (2010) mention that there may also be firms that enter the sample with a certain survival time already served. They call this censorship as survivorship bias. With these considerations, there is the need to make some modifications to the likelihood function.. Specifically, the likelihood. function is conditioned on the age at which the chain enters to the sample to correct the survivorship bias, and on whether it is right censored or not (i.e. if it has failed until the end of the time-span of the study or not).. 8 The. second estimation does not include the “Experience” variable, and it was estimated as a. robustness check. 9 The variable “Entry time sector”, in the third regression, was included without the “Country” control due to computational estimation issues. Given this, it is considered as a robustness check for H1.. 25.
(35) Finally, there is one last issue to address, regarding the estimation method, and it is referred to the survival time ties treatment. Ideally, time is continuous and therefore, two firms may not have the exact same survival time. Nonetheless, data is usually registered in a form where time has to be considered as discrete, so ties are expected. The existence of such ties gives place for us to make the decision on how to treat those ties, given the iterative nature of the partial likelihood method. For example, if firms “i” and “j” died in the same year, the partial likelihood method must take one of them first to calculate the likelihood function, letting the others on the “risk pool”, i.e. a set of observations that has not failed yet. The order of these selections may affect the estimators. To this end, there are four possible methods of treatment: the Breslow, Efron, exact marginal likelihood and exact partial likelihood methods. The exact marginal and partial likelihood methods are the most computational expensive ones with large samples; given this, they were discarded. The Breslow method considers the pool for each tie as the complete pool (i.e. it does not drop the first tied survival time from the pool to calculate the likelihood function on the second tie), which, in the presence of a high quantity of ties, can lead to inaccurate estimations. In this context, it was selected the Efron method for handling tied values because it is a more accurate and less computational expensive approach (Cleves et al., 2010).. 26.
(36) 3.5.. Model specification and diagnostics. Fox and Weisberg (2011), and Allison (2014) recommend three diagnostics tests when working with Cox regression: influential atypical data analysis, the check of the proportional hazards assumption and a functional form test of the covariates. To carry on the influential data analysis, the LMAX criteria was used. This criterion measures the influence of an observation on the fit of the model. This work is made by calculating the eigenvector associated with the largest eigenvalue of the matrix S ′ Var(β)S, where S is the matrix of the score residuals. A summary of this analysis is presented in the Appendix C, where on the final regressions, those points that had the highest effects on the estimators were excluded. However, the number of data points excluded was not large. Afterwards, it was carried the proportional hazards assumption test. This test has a null hypothesis of a zero slope on the regression of the scaled Schoenfeld residuals (i.e. an estimate, for each individual on each variable, of the ith component of the first derivative of the logarithm of the partial likelihood function with respect to each β) over the survival time. If the null hypothesis is not rejected, it means that the model satisfies the proportional hazards assumption. On all the models, the necessary assumption was supported. For problems related to the functional form of the included variables, the link error test was computed. This test is carried out by making the regression of the dependent variable on its fitted values and the squared form of its fitted values. If the squared fitted values have no explanatory power (i.e. they are not statistically significant), then it can not be rejected that the explicative variables are correctly specified. For all the models, there was evidence for not rejecting the hypothesis that the independent variables were correctly specified. The results of these last two tests for each model are reported on the respective estimation tables. Additionally, there were carried on multicollinearity tests and sensitivity analysis. For the multicollinearity test, it was obtained a VIF of 1.01 for the firm-level variables, showing that there is not such a problem10 . However, as mentioned earlier, the 10 It. is generally accepted that there is no strong multicollinearity if the VIF is lower than 10 (Greene,. 2002).. 27.
(37) contextual variables presented such a problem, with a VIF of 22.03. Therefore, one regression was made for each of them.. For a sensitivity analysis, two types of. additional regressions were carried on (presented in the Appendix A). The first one was made using the original data to check whether the used imputation method changed the estimators, and it is shown in Table A.1. Such a situation was not evidenced. The other analysis was carried out by using a sub-sample excluding all the franchisors present in Venezuela. This is justified on the current situation of the country, which being suggested as a political and economical crisis by authors like Sánchez (2016) and McCarthy (2017), may lead to biased estimators. The results of these estimations are presented in Table A.2 and they lead to similar results as the ones from the main regressions, maintaining the predicted effects by the theory. Finally, as robustness checks, the same regressions of Table 10 were performed using a parametric specification of the baseline hazard function. Specifically, it was assumed a Weibull distribution, which is equivalent to make the proportional hazards assumption (Rodrı́guez, 2010). The results for this alternative regressions are shown in Table B.1, on the Appendix B.. 28.
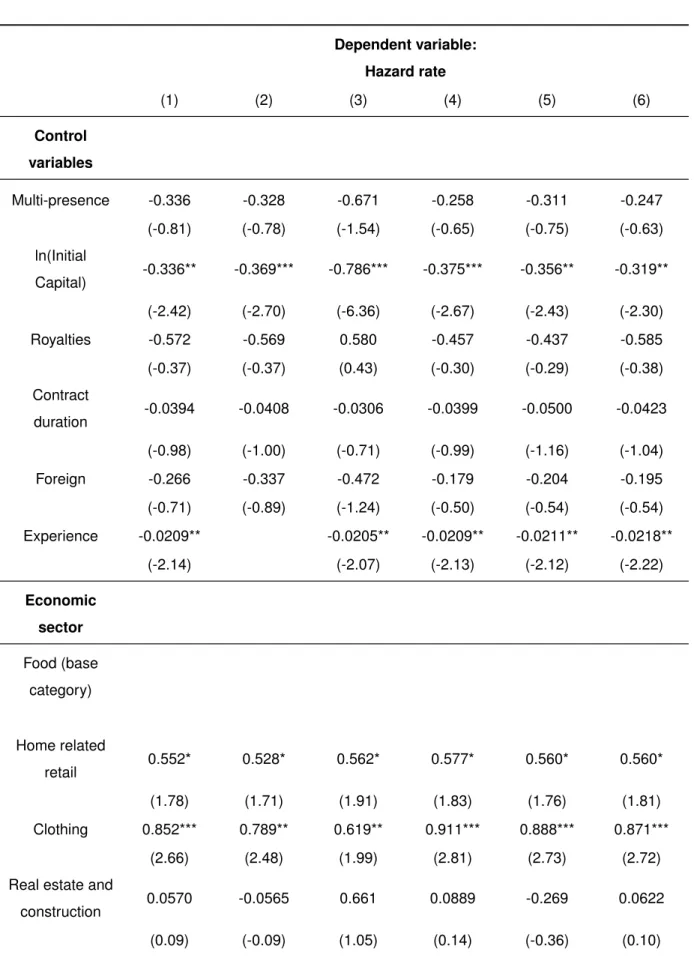
(38) 4.. Results Table 10 shows the estimation results with the influential atypical data excluded. All. the presented models have a p-value of joint significance lower than 1%, showing the overall significance of the explicative variables. Hypothesis 1 is supported by the results. Indeed, both the univariate and the multivariate analysis show that franchisors who enter many years after the first franchisor of the host country have higher hazard rates, at all signification levels. It can be also seen that with higher GDP growth rates, franchisors have a lower failure probability, maintaining everything else constant, which supports hypothesis 2. Additionally, in countries with higher technology exports and logistic performance, the hazard rates of franchisors fall. This evidence supports hypotheses 3a, and 3b. Regarding hypothesis 4, it is supported. On the main regressions and sensitivity analysis without imputation, an increase on the political stability generates a decrease on the hazard rates of the brands. Despite it, on the robustness checks and sensitivity analysis without Venezuela, the same variable does not have a significant effect (with p-values near 10%), but it has the expected sign, so the conclusion is maintained. The control variables also give relevant information.. If everything else keeps. constant, the number of years in business before franchising, as said by Lafontaine and Shaw (1998) is a relevant factor on franchising survival, i.e.. when a brand. dedicates more time to develop its business model, it would be less likely to fail. Additionally, with higher requirements of initial cash investments, franchisors have a lower probability of failure because they save on agency costs, as said by Shane (1998).. The royalty rate and the contract duration on their side, do not have a. significant effect on survival, supporting the findings of Lafontaine and Shaw (1998). Regarding the economic sector where each franchise operates, the results indicate that, ceteris paribus, those brands operating on the clothing and home related retail sectors, are more likely to fail than those that function on the food industry. The remaining sectors demonstrate no statistically significant difference with the base category in terms of survival. Finally, the results indicate that, in comparison to Brazil, in almost all countries, franchisors are more likely to fail, after taking into account the firm level and country level effects.. 29.
(39) Table 10:. Estimation results from the Cox regressions Dependent variable: Hazard rate. (1). (2). (3). (4). (5). (6). -0.336. -0.328. -0.671. -0.258. -0.311. -0.247. (-0.81). (-0.78). (-1.54). (-0.65). (-0.75). (-0.63). -0.336**. -0.369***. -0.786***. -0.375***. -0.356**. -0.319**. (-2.42). (-2.70). (-6.36). (-2.67). (-2.43). (-2.30). -0.572. -0.569. 0.580. -0.457. -0.437. -0.585. (-0.37). (-0.37). (0.43). (-0.30). (-0.29). (-0.38). -0.0394. -0.0408. -0.0306. -0.0399. -0.0500. -0.0423. (-0.98). (-1.00). (-0.71). (-0.99). (-1.16). (-1.04). -0.266. -0.337. -0.472. -0.179. -0.204. -0.195. (-0.71). (-0.89). (-1.24). (-0.50). (-0.54). (-0.54). -0.0209**. -0.0205**. -0.0209**. -0.0211**. -0.0218**. (-2.14). (-2.07). (-2.13). (-2.12). (-2.22). Control variables Multi-presence. ln(Initial Capital). Royalties. Contract duration. Foreign. Experience. Economic sector Food (base category). Home related retail. Clothing. Real estate and construction. 0.552*. 0.528*. 0.562*. 0.577*. 0.560*. 0.560*. (1.78). (1.71). (1.91). (1.83). (1.76). (1.81). 0.852***. 0.789**. 0.619**. 0.911***. 0.888***. 0.871***. (2.66). (2.48). (1.99). (2.81). (2.73). (2.72). 0.0570. -0.0565. 0.661. 0.0889. -0.269. 0.0622. (0.09). (-0.09). (1.05). (0.14). (-0.36). (0.10). 30.
(40) Table 10 – continued from previous page (1). (2). (3). (4). (5). (6). 0.133. 0.132. -0.735**. 0.137. 0.152. 0.128. (0.44). (0.44). (-2.38). (0.45). (0.49). (0.43). 0.497. 0.477. 0.408. 0.579*. 0.505. 0.546*. (1.59). (1.53). (1.31). (1.84). (1.57). (1.76). 1.510***. 1.547***. 2.252***. 4.144***. 2.284***. (4.68). (4.83). (4.76). (3.48). (4.27). 7.444***. 7.325***. 10.50***. 6.545***. 7.967***. (5.44). (5.40). (5.90). (3.48). (5.78). 9.407***. 9.260***. 12.40***. 17.69***. 10.14***. (6.53). (6.51). (6.22). (4.91). (6.46). 6.934***. 6.856***. 8.852***. 5.666***. 6.795***. (8.39). (8.41). (7.21). (4.21). (7.77). -7.842***. -7.655***. -9.220***. -5.226***. -8.323***. (-6.19). (-6.12). (-6.39). (-2.61). (-6.14). 0.333***. 0.327***. 0.410***. 0.405***. 0.376***. (7.52). (7.49). (7.20). (7.03). (7.29). Personal and business services. Beauty care. Country Brazil (base category). Spain. Colombia. Mexico. Venezuela. France. First-mover advantages Entry time. Entry time sector. 0.0309*** (6.06). Country-level variables GDP growth. -0.141*** (-2.76). Technology exports. -0.400***. 31.
(41) Table 10 – continued from previous page (1). (2). (3). (4). (5). (6). (-2.67) Logistic. -3.056**. performance. (-1.98) Political. -1.166**. Stability. (-2.01) Number of firm-year. 10342. 10378. 10341. 10342. 10338. 10343. 134. 135. 133. 134. 130. 135. 2291. 2307. 2291. 2291. 2288. 2292. 0.147. 0.143. 0.0804. 0.152. 0.158. 0.148. Chi-squared. 279.5. 273.4. 151.6. 289.0. 292.4. 283.3. P-value. 1.91e-49. 7.93e-49. 2.70e-26. 8.92e-51. 7.15e-51. 1.29e-49. Chi-squared. 16.13. 15.53. 11.81. 18.95. 15.87. 20.35. P-value. 0.5149. 0.4865. 0.4612. 0.3948. 0.6657. 0.3134. Z. -0.1. -0.01. -1.23. -0.01. -0.01. 0.53. P-value. 0.917. 0.991. 0.218. 0.992. 0.991. 0.599. observations Failing brands Number of brands Pseudo R-squared. Proportional hazards test. Link error test. t-statistics on parenthesis *** p<0.01 ** p<0.05 * p<0.1. 32.
(42) 5.. Conclusion and discussion This study contributes to the ongoing literature on how first-mover advantages,. contract characteristics and business experience before franchising, as well as the economic, institutional, infrastructural and technological situation of the host countries affect the survival of franchising brands, in six different economic sectors of two developed European and four developing Latin American countries. First of all, this study found evidence that first-entrant firms would be less likely to fail. In line with studies like the ones conducted by Lieberman and Montgomery (1988, 1998), Michael (2003) and Bordonaba et al. (2009), franchisors that enter earlier to the market are more likely to gain brand loyalty, scarce strategic resources, and advantages from the early registration of their brand than late entrants, which make them able to last longer. Indeed, franchisors might maintain their acquired first-mover leadership, either by taking the adequate strategies (e.g. innovating and investing on their organization) or because at the time they entered to the market, their initial stock of resources was large enough to be always ahead of late-entrant competitors. This result may suggest to potential franchisees, i.e. entrepreneurs that consider franchising as an investing option, to invest on brands that either have created an industry standard or tradition on the market, or to focus on brands that arrive to unattended market niches.. Following the suggestions of Aliouche and. Schlentrich (2011), and Reinartz et al. (2011), franchisors may desire to be heedful to the appearance of new market opportunities, either by expanding to countries where their brand could be considered as a first mover, or to economic sectors not fully explored. Furthermore, as predicted by the theory, it is suggested by the control variables that those franchises that save on agency costs are less likely to fail, especially when the franchisees have to make large investments. Indeed, the initial cash investments of brands serve both as a quality signal, and as an incentive to work of skilled franchisees who see the worth of their investment. However, as stated by Lafontaine and Shaw (1998) not all the contract characteristics usually listed on the franchising directories, like the royalty rate and the contract length, have significant predictive capacity on franchising survival when other factors are taken into account.. 33.
(43) Finally on the firm level factors, franchises that dedicate more time to perfect their business model, as predicted by Lafontaine and Shaw (1998), have a lower probability of failure. This obeys to the fact that, when the franchise product is fully standardized, the vision of Michael (2014) is achieved and the consumer, indeed, receives the “good old” product whether he or she is in one place or another. In this context, franchisors would like to perfect their products, and operating procedures and manuals, before franchising, to see their surviving supported, at the time that they attract potential franchisees. In relation to the host countries’ economic and institutional environments, the results support the evidence provided by authors like Buddelmeyer et al. (2006), Ejermo and Xiao (2014) and Che et al. (2017), extending them to franchising. Bad economic and political times, characterized by falls on the GDP, frequent switches of policies, collapse of governments, and low institutional performance, would have a negative influence on franchising survival. Certainly, countries like Venezuela, which are going through a political and economic crisis (Sánchez, 2016; McCarthy, 2017), are suggested to have a negative environment for franchising survival. In this kind of surroundings, franchisors could see a potential risk for their business and would either fail, or try to relocate their capital in more stable countries. On the other hand, growing countries like France, given their better situation on political and economic terms (World Bank Group, 2017), could be understood as good environments for the survival of franchising. Additionally, it is shown that countries with low levels of infrastructure and technology networks also create less adequate environments for franchisors to survive, extending the analysis performed by Goldman (1981, 2001) and Reinartz et al. (2011). Franchisors might be having problems to fully exploit their business model due to different constraints. For example, the complementary production technologies that they need to give a satisfying experience to the customer might be too expensive to buy or might not be produced at all. In the same sense, franchisors could be finding obstacles to transport or to trade their products due to a lack of infrastructure quality. These implications make a call for policy makers. On one hand, and specially for Latin American and Caribbean countries, Jaitman (2015) suggests that each. 34.
(44) country of the region has problems on the infrastructure side11 , making the recommendation of national programs, and even regional programs to have focused efforts on such topics. In this sense, this kind of policies would not only generate better environments for franchising, but they would also lead the path to better economic outputs, which is a seed for the better performance of franchises. On the other hand, technology policies are also needed. Studies like the ones of Reinartz et al. (2011) and Martı́nez-Garcı́a (2013) remark that the investments on technology, impacts positively not only on emerging countries’ productivity, but onto material well-being and retailers success. Regarding the economic sectors where franchising participates, the results suggest that, in comparison to the “Food” sector, those franchisors on the “Home related retail” and the “Clothing” sectors are more likely to fail. This may obey to the demand levels and elasticities of the products of such sectors. Related evidence on this statement lies on the work of Regmi et al. (2001), who mentions that around the world, the food demand continues, and will continue to increase on the incoming years; however, with different consumption patterns depending on the development level of each country. Hence, one could think that, with an increasing demand on food, this franchising sector would be sort of “protected” in comparison to other sectors. Nonetheless, the food sector in franchising is a potpourri of activities, which include supermarkets, fast-food chains, and luxury restaurants, among others. These sectors have different income and cross-demand elasticities, which would have a particular behavior under different circumstances, e.g. when the demand levels of goods and services fall on economic recession times (Parker, 2009). This is how, in order to impulse new research achievements, it is recommended that this behavior should be further analyzed, either by doing a different classification of economic sectors, or by disaggregating them. Furthermore, after taking into account the effects of contract characteristics, firstmover advantages, economic situation, political stability, technology and infrastructure factors, and the economic sector of activity, the country dummy variables show that in the considered countries, with the exception of France, franchisors are more to likely fail, in comparison to be located in Brazil. As it was noticed before, Brazil is 11 Especially. on the housing, services and transportation infrastructure.. 35.
(45) an emerging force in franchising, even when it is not the most developed country nor the one with the highest logistic performance or political stability on the sample, as Spain and France are. Therefore, there could be other factors affecting franchising survival. For example, one factor to take into account could be the education level of the population of the host countries, because franchising survival may depend on the availability of high levels of human capital to manage the outlet (Goldman 1981, 2001) as well as less-educated workforce to work on it and reduce labor costs (Acs and Armington, 2006). Likewise, other factors, not only at the country level, but at the firm level, like the proportion of company-owned outlets (also known as “franchising mix”), could be analyzed in similar schemes. Finally, it is worth to mention that this study has limitations, which provide additional directions for further research. The data used to analyze the proposed hypotheses comes from various sources, with different classification of activities, which makes the homogenization procedure a rather subjective and difficult one. In this sense, it is recommended that researchers and franchise associations develop data collection methods that can facilitate and improve new studies regarding franchising. Additionally, to extend the conclusions of this study, future investigations on franchising survival could take larger time spans in a multi-country context, considering both firm-level and country-level variables, extending the analysis here made, even considering more dimensions regarding the environments where franchising develops, and a wider range of firm characteristics than the studied one.. 36.
Figure


+7

Documento similar
- Toxicity and Antitoxicity: the safety and protective ability at individual level measuring the survival percentage of individuals with respect to their
The purpose of this study was to determine the influence of visual behaviour (visual fixation location, number and duration) on decision making in volleyball blocking.. The
Introduction: The aim of this study was to describe incidence, incidence trends and survival patterns of lymphoid neoplasms (LNs) and its subtypes in Spain in the period 2002-2013
Government policy varies between nations and this guidance sets out the need for balanced decision-making about ways of working, and the ongoing safety considerations
Compared to other trials, in this case, the survival of the pathogen could be favored by either (i) the high a w value (0.94), since the application of a similar pressure level
In order to explore the role of dual mycorrhization and urea fertilization on Fraxinus plants survival and growth in poor substrates, and also to contribute information on
The present study aimed to determine the effect of salinity on ω-3 PUFA requirements, larval growth survival and fatty acid composition of Galaxias maculatus larvae cultured at
Graft survival was significantly shortened by stromal injection of any of the cell types, compared with vehicle injection, and graft survival was similar among the
