TítuloDesign and development of a low cost automatic stringed instrumet tuner
7
0
0
Texto completo
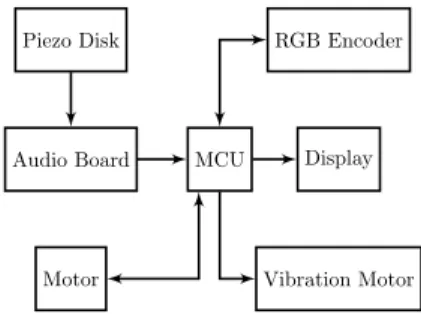
(2) XL Jornadas de Automática. an Arduino board. To this end, the team elaborates the MCU (Microcontroller Unit) software able to process signals from the audio output of the instrument, combined with actuation controlling of the string tension looking for the desired frequency. Finally, the device is able to tune the string within a time limit of 60 seconds, showing great functionality along with accuracy, despite the big size of the device. For the sake of this project, several specific goals have been defined. First of all, developing a low cost optimised prototype capable of the performing procedure, where the sound needs to be acquired by the vibration of the instrument tuning peg transmitted by the instrument body. Using the developed prototype, a string behaviour experimental modelling needs to be performed. Finally, taking advantage of both the prototype and the modelling, a closed loop control system has to be developed in order to control the tuning of the instrument. The rest of the document is structured as follows. Section 2, describes the system developed as well as the design of the prototype for fulfilling the mentioned goals. Section 3 describes the results obtained. Finally, section 4 gathers around the conclusions of the project.. 2. Materials and Methods. For the purpose of the project, a low cost prototype is developed taking advantage of commercial development modules, with the aim of saving up both developing and manufacturing times and, therefore, costs. The device combines sound acquisition and processing with direct actuation over the tuning pegs of the instrument using a DC (Direct Current) motor. 2.1. Hardware Design. For acquisition, a piezo-electric transducer is used with the aim of obtaining the vibration signal of the instrument headstock. The transducer signal is acquired and pre-processed using an audio board, as shown in figure 1. Using the acquired signal, fundamental frequency estimation is performed using a YIN algorithm [8]. This method is chosen based on its great performance and suitability for this environment, as proved in [9]. In order to normalise the value, the frequency is transformed into an equal tempered musical scale, where each octave is divided into 12 equal semitones, each semitone interval is also divided in cents, where 100 cents are defined as an equal tempered semitone. [10]. https://doi.org/10.17979/spudc.9788497497169.604. Modelado, Simulación y Optimización. Based on the obtained frequency, the musical diagnosis can be calculated using equations 1 and 2. oct =. ln(f ) − ln(fu ∗ (. 1. √ 12. 2. )9 ). ln(2) + 4. (1). Where oct is the absolute octave position, f is the measured frequency and fu is the universal tuning frequency reference. Using the integer part of the calculated octave position, the octave of the note is determined. Then, the relative position of the note inside the octave is estimated using equation 2. cents =. 1200 ∗ (oct − int(oct)). (2). Once obtained the musical octave and position in the scale, a decent musical tone diagnosis can be offered for further analysis. For actuation, a DC gearmotor is used combined with an integrated encoder for position feedback, as presented in figure 1. Using an PID (Proportional-Integral-Derivative) controller, the device is capable of driving the motor in terms of rotary position effectively. Additionally, the device owns a graphic user interface composed by a graphic display, a RGB (RedGreen-Blue) rotary encoder as well as a vibration motor, as shown in figure 1. Thanks to this setup all the information acquired and processed is presented to the user. Consequently, a database is also integrated using a Micro SD (Secure Digital) card. In terms of hardware, the prototype owns a custom PCB (Printed Circuit Board) which interconnects all the peripherals mentioned with the microcontroller unit. The physical housing of the prototype is manufactured using 3D (threeDimensional) printing with the purpose of reducing developing time and cost. Piezo Disk. Audio Board. Motor. RGB Encoder. MCU. Display. Vibration Motor. Figure 1: Prototype hardware system architecture. 605.
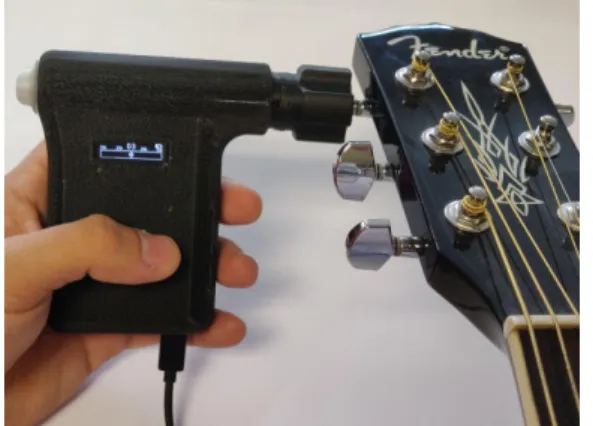
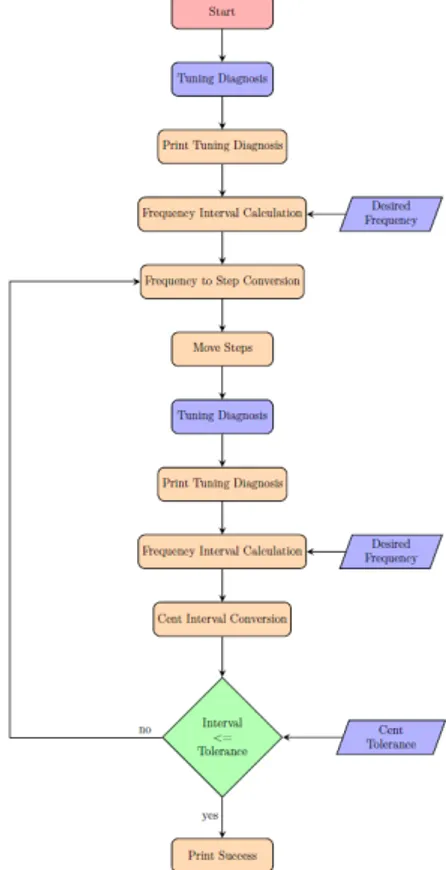
(3) XL Jornadas de Automática. 2.2. Guitar String Experimental Modelling. In order to interact with the string frequency directly, a previous modelling is needed to characterise its behaviour. The main goal was to experimentally model the response of the instrument strings against several controlled perturbations. The instrument selected for the study is an acoustic guitar (Fender T-Bucket 300CE ), based on the access to its use for the analysis. The guitar has a mahogany body and neck, combined with a Graph Tech Nubone string nut and compensated saddle. Additionally, it has a built-in preamplifier using a Fishman Isys pickup System. The strings are Fender Dura-tone 880L (.012-.052 Gauge). [11]. Modelado, Simulación y Optimización. For the sake of this study, an open-loop control is created. The analysis process starts with a manual tuning of the analysed string using the previously mentioned tuner. Once the tuner indicates the guitar is perfectly in tune, a first tuning diagnosis is performed. For the purpose of obtaining the first tuning diagnosis, 12 frequency estimations are acquired from the instrument. A trimmed mean using just the 8 centred values is performed in order to obtain the initial frequency estimation. The frequency is converted into cent scale notation then. Once converted, using the graphic display as well as serial communication, the tuning diagnosis is informed to the user. The device waits then for the user to push the encoder in order to start turning the motor a predefined number of steps. When the motor stops, a new acquisition is performed using the same technique as previously described. Once the second tuning diagnosis is obtained, it is then informed as well to the user.. Figure 2: Fender T-Bucket 300CE TBK. Additionally, in order to normalise the tuning of each string per analysis iteration, a commercial tuner is integrated. The tuner used for the study is a Boss TU-03 tuner. The tuner offers a tuning range of A0 (27.5 Hz (Hertz) )-C8 (4,186.0 Hz), with a parametric reference frequency among 430 Hz-450 Hz.. f2 f1. =. c. 2 1200. (3). Once obtained the diagnosis, the frequency interval is calculated as well as the cent interval, this last one is achieved using the equation 3. With the aim of facilitate the comprehension of the analysis, the following flow diagrams shown in figures 4 and 5 are created.. The tuning accuracy provided by the tuner is ± 1 cent. For using the device, the tuner needs to be clipped onto the guitar headstock. In figure 3, the previously stated guitar is shown with the commercial tuner mounted onto its headstock, as well as the the DC motor shaft inserted into the tuning peg and connected to the rest of the hardware.. Figure 3: Guitar string experimental modelling setup. https://doi.org/10.17979/spudc.9788497497169.604. Figure 4: Guitar String Experimental Modelling Flow Diagram. 606.
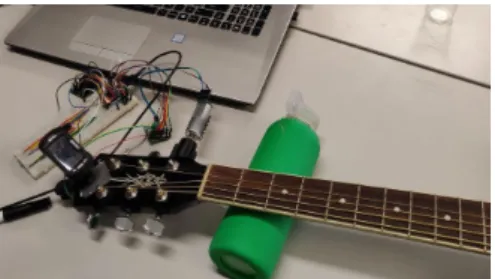
(4) XL Jornadas de Automática. Modelado, Simulación y Optimización. the prototype is also connected to a laptop using serial communication in order to extract all the data produced through the testing.. Figure 7: Automatic guitar string tuner setup. Figure 5: Tuning Diagnosis flow diagram 2.3. Automatic String Tuning. Following procedure is developed taking advantage of the experimental model described analysis. Once again, the instrument selected for the study is the acoustic guitar (Fender T-Bucket 300CE) previously described above. Also, for the purpose of validating the tuning diagnosis, the commercial guitar tuner utilised is a Boss TU-03 tuner. Additionally, serial communication is established, for extracting all the data obtained during the procedure.. On behalf of this study, a discrete closed-loop control based on events is created, where its controlled variable is the fundamental frequency of the string sound, and its manipulated variable is the rotary position of the guitar tuning peg. Additionally, the feedback signal is obtained with the frequency estimation performed through the vibration transducer. With the aim of clarifying the system the next block diagram is designed.. MICROCONTROLLER fref. E −. Controller. SYSTEM. Motor. Instrument. fm Pitch Detection. Acquisition. Figure 8: Automatic tuning block diagram First and foremost, the desired frequency is appointed to the system by the user, in this case, as mentioned above, the desired frequency for the study is 146.83 Hz. The analysis process starts with a first tuning diagnosis, for the purpose of obtaining a representative estimation, as described for the previous study, 12 frequency values are acquired from the instrument. Figure 6: Experimental prototype developed for the project In this case, the D3 string (146.83 Hz) is the string selected for the first several tests in order to unify the initial results.. A trimmed mean using just the 8 centred values is performed in order to obtain the initial frequency evaluation. The frequency is converted into cent scale notation then. Once converted, using the graphic display as well as serial communication, the tuning diagnosis is informed to the user.. In figure 7 the setup used for the study is presented, where both the prototype and the commercial tuner are positioned on the guitar, while. With the acquired frequency, an interval is obtained using the desired frequency stated by the user (146.83 Hz for this study). Taking advantage. https://doi.org/10.17979/spudc.9788497497169.604. 607.
(5) XL Jornadas de Automática. Once the motor has turned the obtained steps, a second tuning diagnosis following the same steps describe previously. Once the tuning diagnosis is achieved, the acquired frequency is compared with the desired one, if they are sufficiently equal, based on a declared tolerance, the prototype will end the process and inform the user about the accomplishment of the tuning procedure. In case the obtained frequency does not satisfies the declared tolerance, a new loop will be executed following the same steps described earlier until the procedure is achieved. With the aim of facilitate the comprehension of the process, a flow diagram is presented in figure 9.. With the purpose of analysing the results of the experiments, the data obtained is extracted from the serial communication and then tabulated. Using all the data acquired from all the tests, the several plots are achieved , shown in figure 10 and 11 . 1 2 3 4 5 6. 6 Frequency interval (Hz). of the results from the previous study, a motor rotary step value is obtained based on the string behaviour analysed before.. Modelado, Simulación y Optimización. 4. (329.6 Hz) (246.9 Hz) (196.0 Hz) (146.8 Hz) (110.0 Hz) (82.4 Hz). 2. 0 0. 200. 400. 600. 800. 1,000. Motor rotary steps. Figure 10: Guitar string experimental model for tension decrease for each string As shown in figure 10, the results demonstrate how the strings reveal a really similar behaviour for several frequency decrements. These results come really handy for trying to predict how the string will react in case the user wants to interact with it.. Frequency interval (Hz). It is really curious how the string with a distinct behaviour is the B3 string (246.9 Hz), coincidentally, it is the only string which presents a different musical interval from the rest. All the strings presents a 5th interval among the next one, while B3 strings represents a 4th with the next string.. Figure 9: Automatic Tuning Flow Diagram. 1 2 3 4 5 6. 6. 4. (329.6 Hz) (246.9 Hz) (196.0 Hz) (146.8 Hz) (110.0 Hz) (82.4 Hz). 2. 0 0. 200. 400. 600. 800. 1,000. Motor rotary steps. 3 3.1. Results Guitar String Experimental Modelling Results. Using the mechanism described in section 2.2, several tests were performed studying each string multiple times. Additionally, they were performed in both rotation directions in order to observe how friction and string tension can affect the results.. https://doi.org/10.17979/spudc.9788497497169.604. Figure 11: Guitar string experimental model for tension increase for each string Additionally, as shown in figure 11, while increasing the tension of the string, friction and perturbations become more tangible. The behaviour produced while still being quite linear, it gets distinguished depending of the string analysed.. 608.
(6) XL Jornadas de Automática. Modelado, Simulación y Optimización. These results were expected due to the different gauges applied in every string, affecting itsf performance against tension changes. 3.2. Automatic String Tuning Results. Using the procedure described in section 2.3, several tests were performed multiple times. With the purpose of analysing the results of the study, the data obtained is extracted from the serial communication and then tabulat ed. Using the data acquired from the tests, the plot shown in figure 12 is achieved.. Test 1 - 150.64 Hz Test 2 - 140.27 Hz Test 3 - 155.33 Hz Desired frequency - 146.83 Hz. Frequency (Hz). 155. 150. 145. 140 0. 1. 2 Iteration. 3. 4. Figure 12: Automatic guitar string tuner tests As presented in figure 12, the results are really satisfying, as the string is successfully tuned in just a few iterations. The whole procedure is performed in less than 10 seconds . In test 1, the string started at 150.64 Hz (D3 + 44.32 cents), with the first iteration, the string got tuned to 147.36 Hz (D3 + 6.21 cents). In the second iteration the string passed through the desired frequency down to 145.78 Hz (D3 - 12.45 cents). Finally, in third iteration, the string got tuned at 146.84 Hz (D3 + 0.09 cents). Moving on to the second test, the string started at 140.27 Hz (C#3 + 20.84 cents), after the first iteration, the string was tuned at 143.83 Hz (D3 35.77 cents). With the second iteration the string got tuned at 145.16 Hz (D3 - 19.83 cents). In the third iteration the string passed really close to the desired frequency with 147.22 Hz (D3 + 4.56 cents), even though this value is legitimate for a commercial tuner, a fourth iteration was performed, where the string got finally tuned to 146.86 Hz (D3 + 0.33 cents). Finally, in test 3 the string started at 155.33 Hz (D#3 - 2.60 cents), once performed the first iteration, the string got tuned to 148.61 Hz (D3 + 20.83 cents). After the second iteration the string was tuned at 146.43 Hz (D3 - 4.75 cents), as mentioned before, this value would be sufficient for a. https://doi.org/10.17979/spudc.9788497497169.604. commercial tuner, but with a third iteration the string got finally tuned to 146.81 Hz (D3 - 0.26 cents). A similar behaviour is observed in the study compared with the previous one, where the string behaves worse while increasing its tension. Test 2 was the only one which required a fourth iteration in order to reach the desired frequency, furthermore, it was the only test which initial frequency value required a tension increase.. 4. Conclusion. After performing tests described above, using the experimental prototype and once analysed the obtained results, the main goal is fulfilled. The development of the low cost optimised prototype has been crucial for the project development, showing a really high precision in musical tone diagnosis (± 0.01 cent), using mostly commercial products which are not specialised for this application. The optimisation of sound acquisition by using the vibration of the instrument shows really satisfying results where the acquired signal does not compromise the obtained precision in the diagnosis as shown. The mechanical design of the prototype offers both ergonomics and aesthetics combined with great functionality integrating all the hardware together . Even though the automatic tuning control was fairly simple, really good results were obtained as stated above. These results open new opportunities for further research where complex control mechanisms could be involved. With the purpose of improving the prototype, new musical scales could be integrated. Even though cent (equal temperament) scale is one of the most common methods of tuning for stringed instrument, there are several methods which should be taken into account, due to its usage in different instruments. Even though the whole project has been focused to stringed instruments from the beginning, it would be really interesting and useful to adapt the development to include also several non-stringed instruments. There are several instruments which are not considered as stringed ones which share similar tuning process, despite the fact that some of them are really so difficult to tune that main professionals do it. Pianos have a quite complex tuning method which implies several process in order to obtain a correct tuning. Thanks to the morphology of the instrument each key is tuned using a special tool which could easily be adapted to the prototype, combined with precise musical tone acquisition. Percussion instruments such as drums or drum kits involve tuning methods as well. The downside of these methods is that percussion in-. 609.
(7) XL Jornadas de Automática. struments do not present tone difference noticeable for human hearing. Precision sound acquisition combined with the already developed actuation process could assist any percussionist with the tuning process.. References [1]. [2]. [3]. [4]. [5]. [6]. [7]. [8]. [9]. J. W. Beauchamp, Analysis, Synthesis, and Perception of Musical Sounds. Springer, 2007, p. 325, isbn: 038732576X. doi: 10 . 1007/978-0-387-32576-7. A. M. Noll, “Cepstrum Pitch Determination,” The Journal of the Acoustical Society of America, vol. 41, no. 2, pp. 293–309, Feb. 1967, issn: 0001-4966. doi: 10.1121/1. 1910339. [Online]. Available: http://asa. scitation.org/doi/10.1121/1.1910339. A. V. Oppenheim and R. W. Schafer, “From frequency to quefrency: A history of the cepstrum,” IEEE Signal Processing Magazine, 2004, issn: 10535888. doi: 10 . 1109 / MSP . 2004.1328092. E. Singer, K. Larke, and D. Bianciardi, “LEMUR GuitarBot: MIDI Robotic String Instrument,” Tech. Rep. [Online]. Available: http://harvestworks.org. Guitar Tuning Project - Northwestern Mechatronics Wiki. [Online]. Available: http://hades.mech.northwestern.edu/ index.php/Guitar_Tuning_Project. A. Bocanegra, “Automatic Acoustic Guitar Tuner,” Massachusetts Institute of Technology, p. 27, 2005. M. Gylling and R. Svensson, “Robotic Electric Guitar Tuner Elgitarrstammande Robot,” Tech. Rep., 2017. [Online]. Available: http : / / www . diva - portal . org / smash/get/diva2:1200615/FULLTEXT01. pdf. A. de Cheveigne and H. Kawahara, “YIN, a fundamental frequency estimator for speech and music,” The Journal of the Acoustical Society of America, vol. 111, no. 4, pp. 1917– 1930, Apr. 2002, issn: 0001-4966. doi: 10. 1121/1.1458024. [Online]. Available: http: //asa.scitation.org/doi/10.1121/1. 1458024. A. v. d. Knesebeck and U. Zölzer, “Comparison of Pitch Trackers for Real-Time Guitar Effects,” . . . Int. Conf. on Digital Audio Effects ( . . ., pp. 1–4, 2010. [Online]. Available: http : / / dafx10 . iem . at / papers / VonDemKnesebeckZoelzer _ DAFx10 _ P102 . pdf % 20http : / / dafx10 . iem . at / proceedings / papers /. https://doi.org/10.17979/spudc.9788497497169.604. Modelado, Simulación y Optimización. VonDemKnesebeckZoelzer _ DAFx10 _ P102 . pdf. [10] M. F. Page, “Perfect harmony: A mathematical analysis of four historical tunings,” The Journal of the Acoustical Society of America, 2004, issn: 0001-4966. doi: 10.1121/1. 1788732. [11] T-Bucket 300CE — Acoustic Guitars. [Online]. Available: https : / / shop . fender . com/en-US/t-bucket-300ce/0968079021. html.. c 2019 by the authors. Submitted for possible open access publication under the terms and conditions of the Creative Commons Attribution CC BY-NC-SA 4.0 license (https://creativecommons.org/licenses/by-ncsa/4.0/deed.es).. 610.
(8)
Figure
+2

Documento similar