Departamento de Ciencias Físicas, Universidad Andrés Bello, Campus La Casona, Fernández Concha 700, Santiago, Chile e-mail:[email protected]
2 INAF – Istituto di Astrofisica Spaziale e Fisica Cosmica di Bologna, via Gobetti 101, 40129 Bologna, Italy 3 Millennium Institute of Astrophysics, Av. Vicuña Mackenna 4860, 782-0436 Macul, Santiago, Chile 4 Vatican Observatory, 00120 Vatican City State, Italy
5 Universidad Nacional Autónoma de México, Apartado Postal 70-264, 04510 México D.F., Mexico 6 Instituto Nacional de Astrofísica, Óptica y Electrónica, Apartado Postal 51-216, 72000 Puebla, Mexico 7 European Southern Observatory, Ave. Alonso de Cordoba 3107, Casilla 19001, Santiago, Chile
8 Department of Astronomy, Astrophysics, Cosmology and Gravity Centre, University of Cape Town, Private Bag X3, 7701 Rondebosch, South Africa
9 South African Astronomical Observatory, PO Box 9, 7935 Observatory, South Africa
10 INAF– Instituto di Astrofisica e Planetologia Spaziali, via Fosso del Cavaliere 100, 00133 Roma, Italy 11 School of Physics & Astronomy, University of Southampton, Southampton, SO17 1BJ, UK
12 Instituto de Astrofísica, Facultad de Física, Pontificia Universidad Católica de Chile, Casilla 306, Santiago 22, Chile 13 Dipartimento di Fisica ed Astronomia “G. Galilei”, Università di Padova, vicolo dell’Osservatorio 3, 35122 Padova, Italy 14 INAF-Osservatorio Astronomico di Padova, Vicolo dell’Osservatorio 5, 35122 Padova, Italy
15 Max-Planck-Institut für Radioastronomie, Auf dem Hügel 69, 53121 Bonn, Germany
Received 2 August 2016/Accepted 5 February 2017
ABSTRACT
We present the nature of 50 hard X-ray emitting objects unveiled through an optical spectroscopy campaign performed at seven telescopes in the northern and southern hemispheres. These objects were detected with the Burst Alert Telescope (BAT) instrument onboard theSwiftsatellite and listed as of unidentified nature in the 54-month Palermo BAT catalogue. In detail, 45 sources in our sample are identified as active galactic nuclei of which, 27 are classified as type 1 (with broad and narrow emission lines) and 18 are classified as type 2 (with only narrow emission lines). Among the broad-line emission objects, one is a type 1 high-redshift quasi-stellar object, and among the narrow-line emission objects, one is a starburst galaxy, one is a X-ray bright optically normal galaxy, and one is a low ionization nuclear emission line region. We report 30 new redshift measurements, 13 confirmations and 2 more accurate redshift values. The remaining five objects are galactic sources: three are Cataclismic Variables, one is a X-ray Binary probably with a low mass secondary star, and one is an active star.
Key words. galaxies: Seyfert – quasars: emission lines – X-rays: binaries – novae, cataclysmic variables – techniques: spectroscopic
1. Introduction
X-ray andγ-ray satellites have detected a large number of high energy sources, allowing us to explore and study in detail the hard X-ray band, above 15 keV. Specifically, the INTEGRAL (Winkler et al. 2003) and Swift (Gehrels et al. 2004) satellites are able to detect hard X-ray sources with positional accuracy better than 5 arcmin with their instruments IBIS (Ubertini et al. 2003) and BAT (Barthelmy 2004), respectively. There are more
?
Based on observations obtained from the following observatories: Cerro Tololo Interamerican Observatory (Chile); Astronomical Obser-vatory of Bologna in Loiano (Italy); Observatorio Astronómico Na-cional (San Pedro Mártir, Mexico); Radcliffe telescope of the South African Astronomical Observatory (Sutherland, South Africa); Sloan Digital Sky Survey; Observatorio del Roque de los Muchachos of the Instituto de Astrofísica de Canarias (Canary Islands, Spain) and New Technology Telescope (NTT) of La Silla Observatory, Chile.
than 1200 hard X-ray sources detected by these satellites, mostly active galactic nuclei (AGN,∼60%) followed by X-ray binaries (XRBs, ∼15%), cataclismic variables (CVs, ∼5%), and finally active stars (e.g.Baumgartner et al. 2013); but more than 20% of the whole set of detections has no precise classification or has no obvious counterpart at other wavelengths and therefore they cannot be associated with any known class of high-energy emit-ting objects.
Although the cross-correlation with catalogues of surveys at other wavelengths (soft X-ray, radio, or optical bands) is im-portant for improving the positional accuracy of detected ob-jects and pinpointing longer-wavelength candidate counterparts of these sources, only with the detection of emission spectral fea-tures especially in the optical can we confirm these associations and reveal the actual nature of these unclassified objects.
studies (Coleiro & Chaty 2013;Scaringi et al. 2010;Landi et al. 2009) and for population analysis of extragalactic objects (e.g. Ricci et al. 2015;Ajello et al. 2008). Moreover, one can find in-teresting classes of X-ray emitting objects, for example types of unusual AGN obscured by local absorption in their galaxies and Compton-thick AGNs with a line-of-sight hydrogen column NH>1024 cm−2 due to the torus of dust surrounding a super-massive black hole (Comastri et al. 2002; Malizia et al. 2009; Lutovinov et al. 2012;Balokovi´c et al. 2014;Koss et al. 2016a; Ricci et al. 2015). Also, new types of hard X-ray binaries have been reported; namely, the INTEGRAL discovered supergiant fast X-ray transients (SFXTs,Sguera et al. 2006) and theγ-ray binary inde Martino et al.(2013). Due to local or Galactic ab-sorption, many of these objects are optically faint, so one needs relatively large telescopes to identify their nature and get infor-mation about them, such as the study of stellar populations in their central regions (Morelli et al. 2013).
Many efforts have been made to characterise and analyse the properties of theSwift-BAT sample using optical spectroscopy (e.g. Landi et al. 2007; Winter et al. 2010; Berney et al. 2015; Halpern & Thorstensen 2015;Ueda et al. 2015), but the identifi-cation and precise classifiidentifi-cation of unassociated or poorly stud-ied objects remains incomplete. The work presented here ex-tends to fainter objects the work started in Parisi et al.(2009; 2012;2014; hereafter PI, PII and PIII), and focuses on the identi-fication and classiidenti-fication of unassociated hard X-ray sources de-tected by the BAT instrument onboardSwift, that are listed in the Second Palermo Swift-BAT Catalogue (2PBC,Cusumano et al. 2010).
The paper is structured as follows: in Sect. 2, we provide in-formation about the sample selection; in Sect. 3, we describe the optical observations, telescopes employed, and reduction method used; in Sect. 4, the results of the optical classification of different classes (AGNs, XRBs, CVs and active stars) are pre-sented and a statistical analysis of the sample is given; finally, in Sect. 5 we summarise the main conclusions of our work.
2. Sample selection
In this work we focus on the optical follow-up of objects with unknown classification and/or redshift that are reported in the Second Palermo Swift-BAT hard X-ray catalogue obtained by analysing data acquired in the first 54 months of theSwift mis-sion (Cusumano et al. 2010).
This survey covers 90% of the sky down to a flux limit of 1.1×10⁻¹¹erg cm−2s−1and 50% of the sky down to a flux limit of 0.9 ×10⁻¹¹ erg cm−2 s−1 in the 15−150 keV band. It lists 1256 sources, of which 57% are extragalactic, 19% are galactic, and 24% are of unknown type.
From this BAT survey, we selected a sample of unknown type objects and used the available soft X-ray data (<10 keV) to reduce the source positional uncertainty from arcmin to arc-sec sized radii, using the ROSAT (Voges et al. 1999),Swift/XRT (0.3−10 keV, Evans et al. 2014), XMM-Newton (0.2−12 keV, Watson et al. 2009) catalogues or the Chandra1 (0.3−10 keV, Aldcroft et al. 2000) and XRT2 databases. This approach was proven byStephen et al. (2006) to be very effective in associ-ating hard X-ray sources with a strong, softer X-ray counter-part within the high-energy error circle with a high degree of probability, which in turn drastically reduces the positional error
1 http://cxc.harvard.edu
2 Agenzia spaziale italiana Science Data Center (ASDC): http://
asdc.asi.it
Table 1.Observational information of finding charts of the soft X-ray counterpart identifications to the present sample of 2PBC sources.
Object Obs date Start time Exposure
(UT) time (s)
2PBC J0057.2+6401 Aug. 29, 2010 00:19:00 9807
2PBC J0116.5−1235 May 19, 2011 00:45:00 7372
2PBC J0128.5+1628 Jun. 04, 2009 01:33:00 10 643
2PBC J0154.1−5034 Nov. 14, 2012 00:29:00 2379
2PBC J0217.0−7250 Nov. 29, 2014 23:59:00 1743
2PBC J0252.3+4309 Mar. 28, 2011 10:54:00 4189
2PBC J0356.6−6252 Aug. 05, 2008 01:32:00 5659
2PBC J0440.6−6507 Nov. 18, 2012 16:38:00 4375
2PBC J0505.4−6734 Oct. 21, 2013 13:00:00 2071
2PBC J0550.7−2304 Nov. 27, 2012 07:23:00 3520
2PBC J0608.0+5749 Dec. 04, 2014 03:28:00 1093
2PBC J0620.8−2932 Jul. 03, 2013 00:14:00 4689
2PBC J0653.1−1227 Nov. 21, 2012 12:14:00 3139
2PBC J0709.5−3538 Jul. 23, 2013 16:58:02 2590
2PBC J0714.6−2521 Nov. 22, 2012 18:46:00 2724
2PBC J0751.6+6450 Feb. 28, 2013 05:04:00 1114
2PBC J0757.9+0113 Jun. 05, 2014 20:01:29 804
2PBC J0819.2−2508 Jul. 11, 2013 02:02:00 3814
2PBC J0838.7+2612 Dec. 22, 2013 11:25:41 2377
2PBC J1020.5−0235 Jul. 07, 2010 18:18:00 3144
2PBC J1042.2+0043 Jun. 25, 2010 09:12:50 7537
2PBC J1228.1−0925 Nov. 19, 2013 09:29:04 4173
2PBC J1332.1−7751 Feb. 26, 2009 08:49:00 9264
2PBC J1419.2+6804∗
Jun. 11, 2005 17:27:54 9851
2PBC J1520.2−0433 Jan. 21, 2011 02:55:00 3344
2PBC J1548.5−3208 Feb. 01, 2009 00:23:06 2849
2PBC J1555.0−6225 Jul. 04, 2011 05:44:00 2430
2PBC J1649.3−1739 Sep. 07, 2010 00:19:21 2720
2PBC J1809.7−6555 Jul. 09, 2011 01.39:52 2979
2PBC J1832.8+3124 Jan. 27, 2014 06:06:00 3494
2PBC J1911.4+1412 Nov. 28, 2012 06:48:23 1239
2PBC J2029.4−6146 Jun. 20, 2010 00:03:21 6246
2PBC J2030.7−7530 Jul. 02, 2010 17:23:32 6547
2PBC J2045.9+8321 Jun. 18, 2010 01:11:42 5584
2PBC J2136.3+2003 Jun. 20, 2013 13:55:34 1573
2PBC J2155.1+6205 Jun. 23, 2013 02:25:26 4240
2PBC J2238.9+4050 Dec. 23, 2012 11:24:04 1556
2PBC J2322.6+2903 Nov. 11, 2012 01:45:09 4373
2PBC J2348.9+4153 Nov. 12, 2013 00:13:14 2275
Notes.Soft X-ray observations were obtained from ASI Science XRT database (http://www.asdc.asi.it/). (∗) Soft X-ray observation from HEASARC database (http://heasarc.gsfc.nasa.gov).
circles to a few arcsec in radius, thus shrinking the search area by a factor of∼104.
More specifically, for the present sample, we analysed the soft X-ray (<10 keV) images with longest available exposure of the field of each BAT object in Table1to search for sources detected (at confidence level>3σ) within the 90%Swift-BAT er-ror circles. This choice also allowed us to investigate the source hardness in case of multiple objects within the hard X-ray error box, which permitted us to pinpoint the hardest sources, hence the most likely counterparts to the BAT objects.
Nearly all soft X-ray images were extracted from the ASDC XRT database (see footnote 2); that of 2PBC J1419.2+6804 was instead obtained from anXMM-Newtonobservation down-loaded from the HEASARC database3. The information about these images can be found in Table 1 and the coordinates of the most likely counterparts are reported in Table2(second and
tional criteria as we detail below.
When no soft X-ray counterpart was found inside the BAT error circle at 90% position confidence level, we expanded the search area by considering the 99% BAT error circle assum-ing a gaussian uncertainty distribution for the error radius. In our sample, the putative counterparts of three objects were se-lected considering the 99% BAT error circle: those of 2PBC J0550.7−2304, 2PBC J0620.8−2932, and 2PBC J1832.8+3124. Since no other object is detected inside the 99% positional uncertainty, we assumed these associations to be correct (see Fig. A.2). We remark here that the soft X-ray counterpart in-dicated with the black arrow for the object 2PBC J0550.7−2304 corresponds to the ROSAT object proposed as a soft X-ray coun-terpart in theCusumano et al.(2010) catalogue and lies at the edge of the 99% BAT error circle.
In one single case, we included in our sample an object re-ported by PIII and for which no soft X-ray counterpart was found within its 99% BAT error circle. Actually, PIII found two nearby soft X-ray sources as possible associations of the object PBC J1020.5-0235, which are the same sources la-belled as Swift J1020.5−0237A and Swift J1020.5−0237B in the 70-month BAT Catalogue of Baumgartner et al.(2013). In PIII the object with higher 3−10 keV flux was considered for optical spectroscopy (object B) and identified as Sy 1 galaxy at z = 0.060. We thus decided to complete the information about this field by analysing the optical spectrum of the object Swift J1020.5−0237A (see Fig.A.3).
Finally for two cases, 2PBC J0819.2−2508 and 2PBC J1520.2−0433, the soft X-ray counterparts proposed in this work do not coincide with those reported in theCusumano et al. (2010) and/or Baumgartner et al. (2013) catalogues (see Fig.A.4).
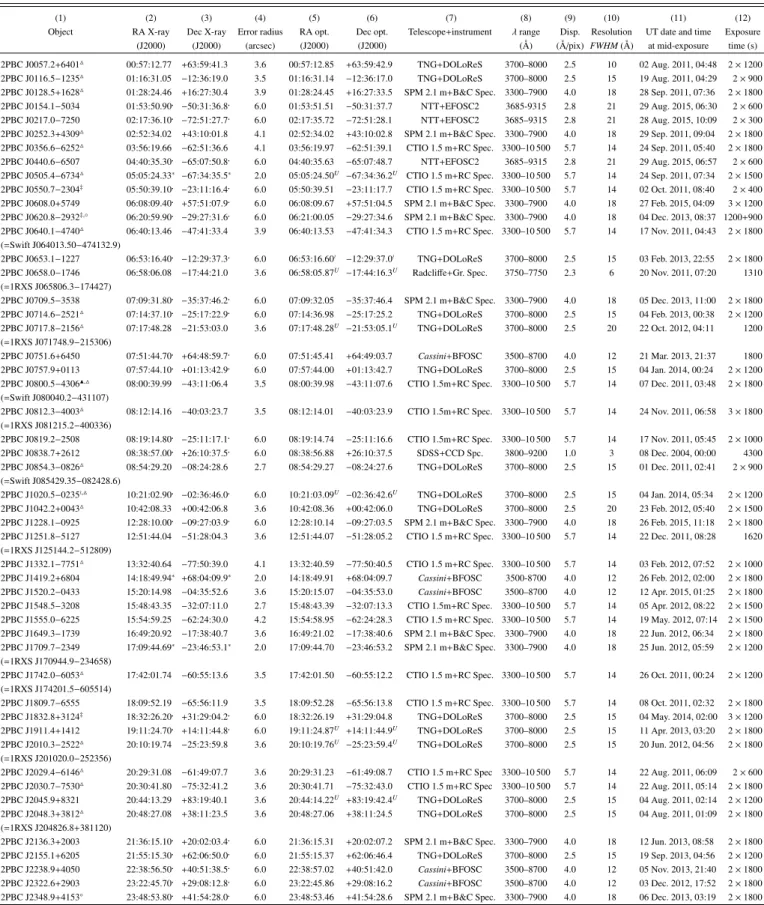
Then, within the soft X-ray error boxes of each source of our sample, we identified the putative optical counterpart(s) to the BAT object and performed optical spectroscopic follow-up work with long-slit spectroscopy. Following the method applied by Masetti et al.(2004,2006a,b,c,d,2008,2009,2010,2012,2013, hereafter MI to MX respectively) and by PI, PII, and PIII, we determined the nature of 50 selected objects, estimating also red-shifts, distances, Galactic and local extinction, and central black hole masses for type 1 AGNs. The observational information of the 50 objects are listed in Table2.
3. Optical observations
The data presented in this work involved the use of the following telescopes:
– the 1.5 m at the Cerro Tololo Interamerican Observatory (CTIO), Chile;
of the observed 2PBC sources. In Cols. 2 and 3, we list the soft X-ray coordinates of the proposed counterpart (with their respective positional uncertainties in Col. 4) extracted from the XMM-Newton(with an uncertainty better than 200,Watson et al. 2009) and the XRT catalogues (with an uncertainty of ∼600
for the PC interactive mode according toEvans et al. 2014). In Cols. 5 and 6, we list the equatorial coordinates of the proposed counterpart, mostly extracted from the 2MASS (with an uncer-tainty of 000.1:Skrutskie et al. 2006) or USNO-A2.0 catalogues
(with an uncertainty of 000.2,Deutsch 1999;Assafin et al. 2001).
The telescope and instrument used for the observations are reported in Col. 7, while the main characteristics of each spectro-scopic setup are presented in Cols. 8–10. Column 11 reports the observation date and the UT time at mid-exposure, and Col. 12 provides the exposure times and the number of observations for each source.
The instrumental resolutions (in Å) for the different setups of the optical spectra presented here are listed in Tables2and3. The spectroscopic data acquired have been extracted (Horne 1986) and reduced following standard procedures using IRAF4.
Calibration frames (flat fields and bias) were taken on the day preceding or following the observing night. The wavelength cal-ibration was performed using lamp data acquired soon after each on-target spectroscopic acquisition; the uncertainty in this cal-ibration was ∼0.5 Å in all cases according to our checks that used the positions of background night sky lines. Flux cali-bration was obtained using catalogued spectrophotometric stan-dards. Finally, the data of a given object were stacked together to increase the signal-to-noise ratio when multiple spectra were acquired. The Sloan Digital Sky Survey (SDSS) spectrum of 2PBC J0838.7+2612 was acquired from the corresponding on-line archive5, already reduced and calibrated.
4. Results
The spectra of 50 objects were analysed according to the above steps. Of these, 45 were classified as extragalactic objects and the remaining five objects presented features in their spectra consis-tent with those of galactic sources.
The main criteria used for the classification of the extragalac-tic sources spectra are reported hereafter. We assume a cosmol-ogy withH0 =70 km s−1Mpc−1,ΩΛ=0.7, andΩm =0.3; the luminosity distances of the extragalactic objects presented in this
4 IRAF is the Image Reduction and Analysis Facility made avail-able to the astronomical community by the National Optical Astron-omy Observatories, which are operated by AURA, Inc., under con-tract with the US National Science Foundation. It is available athttp: //iraf.noao.edu/
Table 2.Log of the spectroscopic observations presented in this paper (see text for details).
(1) (2) (3) (4) (5) (6) (7) (8) (9) (10) (11) (12)
Object RA X-ray Dec X-ray Error radius RA opt. Dec opt. Telescope+instrument λrange Disp. Resolution UT date and time Exposure
(J2000) (J2000) (arcsec) (J2000) (J2000) (Å) (Å/pix) FWHM(Å) at mid-exposure time (s)
2PBC J0057.2+6401M 00:57:12.77 +63:59:41.3 3.6 00:57:12.85 +63:59:42.9 TNG+DOLoReS 3700–8000 2.5 10 02 Aug. 2011, 04:48 2×1200 2PBC J0116.5−1235M 01:16:31.05 −12:36:19.0 3.5 01:16:31.14 −12:36:17.0 TNG+DOLoReS 3700–8000 2.5 15 19 Aug. 2011, 04:29 2×900 2PBC J0128.5+1628M 01:28:24.46 +16:27:30.4 3.9 01:28:24.45 +16:27:33.5 SPM 2.1 m+B&C Spec. 3300–7900 4.0 18 28 Sep. 2011, 07:36 2×1800 2PBC J0154.1−5034 01:53:50.90 −50:31:36.8 6.0 01:53:51.51 −50:31:37.7 NTT+EFOSC2 3685-9315 2.8 21 29 Aug. 2015, 06:30 2×600 2PBC J0217.0−7250 02:17:36.10 −72:51:27.7 6.0 02:17:35.72 −72:51:28.1 NTT+EFOSC2 3685–9315 2.8 21 28 Aug. 2015, 10:09 2×300 2PBC J0252.3+4309M 02:52:34.02 +43:10:01.8 4.1 02:52:34.02 +43:10:02.8 SPM 2.1 m+B&C Spec. 3300–7900 4.0 18 29 Sep. 2011, 09:04 2×1800 2PBC J0356.6−6252M 03:56:19.66 −62:51:36.6 4.1 03:56:19.97 −62:51:39.1 CTIO 1.5 m+RC Spec. 3300–10 500 5.7 14 24 Sep. 2011, 05:40 2×1800 2PBC J0440.6−6507 04:40:35.30 −65:07:50.8 6.0 04:40:35.63 −65:07:48.7 NTT+EFOSC2 3685–9315 2.8 21 29 Aug. 2015, 06:57 2×600 2PBC J0505.4−6734M 05:05:24.33∗ −67:34:35.5∗ 2.0 05:05:24.50U −67:34:36.2U CTIO 1.5 m+RC Spec. 3300–10 500 5.7 14 24 Sep. 2011, 07:34 2×1500
2PBC J0550.7−2304‡ 05:50:39.10 −23:11:16.4 6.0 05:50:39.51 −23:11:17.7 CTIO 1.5 m+RC Spec. 3300–10 500 5.7 14 02 Oct. 2011, 08:40 2×400 2PBC J0608.0+5749 06:08:09.40 +57:51:07.9 6.0 06:08:09.67 +57:51:04.5 SPM 2.1 m+B&C Spec. 3300–7900 4.0 18 27 Feb. 2015, 04:09 3×1200 2PBC J0620.8−2932‡,◦ 06:20:59.90 −29:27:31.6 6.0 06:21:00.05 −29:27:34.6 SPM 2.1 m+B&C Spec. 3300–7900 4.0 18 04 Dec. 2013, 08:37 1200+900 2PBC J0640.1−4740M 06:40:13.46 −47:41:33.4 3.9 06:40:13.53 −47:41:34.3 CTIO 1.5 m+RC Spec. 3300–10 500 5.7 14 17 Nov. 2011, 04:43 2×1800 (=Swift J064013.50−474132.9)
2PBC J0653.1−1227 06:53:16.40 −12:29:37.3 6.0 06:53:16.60o −12:29:37.0o TNG+DOLoReS 3700–8000 2.5 15 03 Feb. 2013, 22:55 2×1800
2PBC J0658.0−1746 06:58:06.08 −17:44:21.0 3.6 06:58:05.87U −17:44:16.3U Radcliffe+Gr. Spec. 3750–7750 2.3 6 20 Nov. 2011, 07:20 1310
(=1RXS J065806.3−174427)
2PBC J0709.5−3538 07:09:31.80 −35:37:46.2 6.0 07:09:32.05 −35:37:46.4 SPM 2.1 m+B&C Spec. 3300–7900 4.0 18 05 Dec. 2013, 11:00 2×1800 2PBC J0714.6−2521M 07:14:37.10 −25:17:22.9 6.0 07:14:36.98 −25:17:25.2 TNG+DOLoReS 3700–8000 2.5 15 04 Feb. 2013, 00:38 2×1200 2PBC J0717.8−2156M 07:17:48.28 −21:53:03.0 3.6 07:17:48.28U −21:53:05.1U TNG+DOLoReS 3700–8000 2.5 20 22 Oct. 2012, 04:11 1200
(=1RXS J071748.9−215306)
2PBC J0751.6+6450 07:51:44.70 +64:48:59.7 6.0 07:51:45.41 +64:49:03.7 Cassini+BFOSC 3500–8700 4.0 12 21 Mar. 2013, 21:37 1800 2PBC J0757.9+0113 07:57:44.10 +01:13:42.9 6.0 07:57:44.00 +01:13:42.7 TNG+DOLoReS 3700–8000 2.5 15 04 Jan. 2014, 00:24 2×1200 2PBC J0800.5−4306N,M 08:00:39.99 −43:11:06.4 3.5 08:00:39.98 −43:11:07.6 CTIO 1.5m+RC Spec. 3300–10 500 5.7 14 07 Dec. 2011, 03:48 2×1800 (=Swift J080040.2−431107)
2PBC J0812.3−4003M 08:12:14.16 −40:03:23.7 3.5 08:12:14.01 −40:03:23.9 CTIO 1.5m+RC Spec. 3300–10 500 5.7 14 24 Nov. 2011, 06:58 3×1800 (=1RXS J081215.2−400336)
2PBC J0819.2−2508 08:19:14.80 −25:11:17.1 6.0 08:19:14.74 −25:11:16.6 CTIO 1.5m+RC Spec. 3300–10 500 5.7 14 17 Nov. 2011, 05:45 2×1000 2PBC J0838.7+2612 08:38:57.00 +26:10:37.5 6.0 08:38:56.88 +26:10:37.5 SDSS+CCD Spc. 3800–9200 1.0 3 08 Dec. 2004, 00:00 4300 2PBC J0854.3−0826M 08:54:29.20 −08:24:28.6 2.7 08:54:29.27 −08:24:27.6 TNG+DOLoReS 3700–8000 2.5 15 01 Dec. 2011, 02:41 2×900 (=Swift J085429.35−082428.6)
2PBC J1020.5−0235o,M 10:21:02.90 −02:36:46.0 6.0 10:21:03.09U −02:36:42.6U TNG+DOLoReS 3700–8000 2.5 15 04 Jan. 2014, 05:34 2×1200
2PBC J1042.2+0043M 10:42:08.33 +00:42:06.8 3.6 10:42:08.36 +00:42:06.0 TNG+DOLoReS 3700–8000 2.5 20 23 Feb. 2012, 05:40 2×1500 2PBC J1228.1−0925 12:28:10.00 −09:27:03.9 6.0 12:28:10.14 −09:27:03.5 SPM 2.1 m+B&C Spec. 3300–7900 4.0 18 26 Feb. 2015, 11:18 2×1800 2PBC J1251.8−5127 12:51:44.04 −51:28:04.3 3.6 12:51:44.07 −51:28:05.2 CTIO 1.5 m+RC Spec. 3300–10 500 5.7 14 22 Dec. 2011, 08:28 1620 (=1RXS J125144.2−512809)
2PBC J1332.1−7751M 13:32:40.64 −77:50:39.0 4.1 13:32:40.59 −77:50:40.5 CTIO 1.5 m+RC Spec. 3300–10 500 5.7 14 03 Feb. 2012, 07:52 2×1000 2PBC J1419.2+6804 14:18:49.94∗ +68:04:09.9∗ 2.0 14:18:49.91 +68:04:09.7 Cassini+BFOSC 3500-8700 4.0 12 26 Feb. 2012, 02:00 2×1800
2PBC J1520.2−0433 15:20:14.98 −04:35:52.6 3.6 15:20:15.07 −04:35:53.0 Cassini+BFOSC 3500–8700 4.0 12 12 Apr. 2015, 01:25 2×1800 2PBC J1548.5−3208 15:48:43.35 −32:07:11.0 2.7 15:48:43.39 −32:07:13.3 CTIO 1.5m+RC Spec. 3300–10 500 5.7 14 05 Apr. 2012, 08:22 2×1500 2PBC J1555.0−6225 15:54:59.25 −62:24:30.0 4.2 15:54:58.95 −62:24:28.3 CTIO 1.5 m+RC Spec. 3300–10 500 5.7 14 19 May. 2012, 07:14 2×1500 2PBC J1649.3−1739 16:49:20.92 −17:38:40.7 3.6 16:49:21.02 −17:38:40.6 SPM 2.1 m+B&C Spec. 3300–7900 4.0 18 22 Jun. 2012, 06:34 2×1800 2PBC J1709.7−2349 17:09:44.69∗ −23:46:53.1∗ 2.0 17:09:44.70 −23:46:53.2 SPM 2.1 m+B&C Spec. 3300–7900 4.0 18 25 Jun. 2012, 05:59 2×1200
(=1RXS J170944.9−234658)
2PBC J1742.0−6053M 17:42:01.74 −60:55:13.6 3.5 17:42:01.50 −60:55:12.2 CTIO 1.5 m+RC Spec. 3300–10 500 5.7 14 26 Oct. 2011, 00:24 2×1200 (=1RXS J174201.5−605514)
2PBC J1809.7−6555 18:09:52.19 −65:56:11.9 3.5 18:09:52.28 −65:56:13.8 CTIO 1.5 m+RC Spec. 3300–10 500 5.7 14 08 Oct. 2011, 02:32 2×1800 2PBC J1832.8+3124‡ 18:32:26.20 +31:29:04.2 6.0 18:32:26.19 +31:29:04.8 TNG+DOLoReS 3700–8000 2.5 15 04 May. 2014, 02:00 3×1200 2PBC J1911.4+1412 19:11:24.70 +14:11:44.8 6.0 19:11:24.87U +14:11:44.9U TNG+DOLoReS 3700–8000 2.5 15 11 Apr. 2013, 03:20 2×1800
2PBC J2010.3−2522M 20:10:19.74 −25:23:59.8 3.6 20:10:19.76U −25:23:59.4U TNG+DOLoReS 3700–8000 2.5 15 20 Jun. 2012, 04:56 2×1800
(=1RXS J201020.0−252356)
2PBC J2029.4−6146M 20:29:31.08 −61:49:07.7 3.6 20:29:31.23 −61:49:08.7 CTIO 1.5 m+RC Spec 3300–10 500 5.7 14 22 Aug. 2011, 06:09 2×600 2PBC J2030.7−7530M 20:30:41.80 −75:32:41.2 3.6 20:30:41.71 −75:32:43.0 CTIO 1.5 m+RC Spec 3300–10 500 5.7 14 22 Aug. 2011, 05:14 2×1800 2PBC J2045.9+8321 20:44:13.29 +83:19:40.1 3.6 20:44:14.22U +83:19:42.4U TNG+DOLoReS 3700–8000 2.5 15 04 Aug. 2011, 02:14 2×1200
2PBC J2048.3+3812M 20:48:27.08 +38:11:23.5 3.6 20:48:27.06 +38:11:24.5 TNG+DOLoReS 3700–8000 2.5 15 04 Aug. 2011, 01:09 2×1800 (=1RXS J204826.8+381120)
2PBC J2136.3+2003 21:36:15.10 +20:02:03.4 6.0 21:36:15.31 +20:02:07.2 SPM 2.1 m+B&C Spec. 3300–7900 4.0 18 12 Jun. 2013, 08:58 2×1800 2PBC J2155.1+6205 21:55:15.30 +62:06:50.0 6.0 21:55:15.37 +62:06:46.4 TNG+DOLoReS 3700–8000 2.5 15 19 Sep. 2013, 04:56 2×1200 2PBC J2238.9+4050 22:38:56.50 +40:51:38.5 6.0 22:38:57.02 +40:51:42.0 Cassini+BFOSC 3500–8700 4.0 12 05 Nov. 2013, 21:40 2×1800 2PBC J2322.6+2903 23:22:45.70 +29:08:12.8 6.0 23:22:45.86 +29:08:16.2 Cassini+BFOSC 3500–8700 4.0 12 03 Dec. 2012, 17:52 2×1800 2PBC J2348.9+4153◦ 23:48:53.80 +41:54:28.0 6.0 23:48:53.46 +41:54:28.6 SPM 2.1 m+B&C Spec. 3300–7900 4.0 18 06 Dec. 2013, 03:19 2×1800 Notes.If not indicated otherwise, soft X-ray source coordinates were extracted from XRT (http://www.swift.ac.uk/1SXPS/or interactive mode () inhttp://www.asdc.asi.it/mmia/index.php?mission=swiftmastr, with an accuracy∼600
) or fromXMM-Newtonobservations (∗
) with an accuracy better than 200
paper were determined for these parametres using the cosmology calculator ofWright(2006).
In order to distinguish between type 1 and type 2 emission-line AGN, we used the criteria of Veilleux & Osterbrock (1987) and we used the line ratio diagnostics of Ho et al. (1993,1997) andKauffmann et al.(2003) to distinguish among the Seyfert 2, low-ionization nuclear emission-line regions (LINERs; Heckman 1980), HII regions, and transition ob-jects (LINERs whose integrated spectra are diluted or con-taminated by neighbouring HII regions, Ho et al. 1997). For the subclass assignation to Seyfert 1 galaxies, we used the Hβ/[OIII]λ5007 line flux ratio criterion ofWinkler(1992).
To estimate theE(B−V) local optical absorption in our type 2 AGN sample, when possible, we first dereddened the spectrum by applying a correction for the Galactic absorption along the line of sight to the source. This was done using the galactic colour excess E(B−V)Gal given by Schlegel et al.(1998) and the Galactic extinction law obtained byCardelli et al.(1989). We then estimated the colour excessE(B−V)AGNlocal to the AGN host galaxy by using the resulting FHα
FHβ line ratio and corrected
that assuming a Milky Way reddening using the Balmer decre-ment flux relation ofOsterbrock(1989) that for normal density and temperature conditions implies
For most of our type 1 AGN sample we also estimated the mass of the central black hole. We generally used the Hβ emission line flux, corrected for the Galactic colour ex-cess (Schlegel et al. 1998) and its full width half maximmum (FWHM) to measure the broad-line region (BLR) gas veloc-ity (vFW H M). Using Eq. (2) ofWu et al.(2004), we estimated the BLR size, which is used withvFW H M in Eq. (5) ofKaspi et al. (2000) to calculate the AGNs black hole mass. For the single quasi-stellar object (QSO) of our sample, we apply the formu-lae fromMcLure & Jarvis(2002), which use the information af-forded by the Mg
ii
broad emission. As already remarked in our previous papers, the main sources of error in these mass esti-mates generally come from the determination of the flux of the employed emission lines, which is∼15% in the sample, and from the scatter in the scaling relation between the size of the BLR and the diagnostic line luminosity (Vestergaard 2004). Therefore, we expect the typical error to be around 50% of the black hole mass value.The results of the black hole (BH) masses determination are reported in Sect. 4.4 where we also list the Eddington luminosi-ties which were computed using the observed X-ray fluxes or upper limits in the 15−150 keV band and the median bolomet-ric correction according to Ho (2009). For that, we first con-verted the observed X-ray luminosity measured in theSwift-BAT
X-ray binary (van Paradijs & McClintock 1995). Although these approaches basically provide an approximate value for the dis-tance of Galactic sources, our past experience (MI-X and PI-III) tells us that these estimates can be considered correct to within 50% of the refined value subsequently determined with more precise approaches. The values for the absorption in the optical Vband along the line of sight of the galactic objects for the deter-mination of distances were again estimated from the Hα/Hβflux
ratio followingOsterbrock(1989).
The X-ray luminosities reported in Tables 4 to 7, D.1 and D.2 are associated with a letter indicating the satellite and/or the instrument, namely the Swift-BAT (C) from Cusumano et al. (2010), Swift-BAT (B) from Baumgartner et al. (2013), and INTEGRAL/IBIS (I) fromBaumgartner et al.(2016) catalogues, and from the Swift/XRT (X) and XMM-Newton (N) databases, with which the measurement of the corresponding X-ray flux was obtained. For the cases in which the soft X-ray informa-tion was obtained from the ASDC6 archive, we derived the 0.3−10 keV flux by assuming a power law model with photon indexΓ = 1.8 and NHvalue formulated by Predehl & Schmitt (1995) according toSchlegel et al.(1998) using the webpimms tool7in order to obtain their soft X-ray luminosities.
For galactic objects with a soft X-ray counterpart from the ASDC archive, we assumed different spectral models according to their nature in order to obtain their soft X-ray fluxes. Specif-ically, for the probable X-ray binary 2PBC J1911.4+1412 we considered a power law model withΓ =2.1, that is, a Crab-like spectrum, and for the active star 2PBC J0620.8−2932 we as-sumed a black body model with a typical value for these objects ofkT =1 keV (Pandey et al. 2005).
In the following, we present the object identifications by di-viding them into four broad classes (X-ray binaries, CVs, active stars, and AGNs).
4.1. 2PBC J1911.4+1412: an X-ray binary?
Among the objects in our sample, 2PBC J1911.4+1412 displays optical features of an X-ray binary (see Fig.1).
In the optical spectrum of this source, we detected emissions of Balmer lines up to Hδand emission of He I at a redshift consis-tent with 0 superimposed on a reddened continuum. Moreover, the spectrum displays an emission of He IIλ4686, typical of accre-tion disks. Table4lists the relevant optical spectral information along with the main parameters determined from available X-ray and optical data. The value for the absorption in the optical along the line of sight reported in that Table for the object is lower than
6 http://www.asdc.asi.it/
7 https://heasarc.gsfc.nasa.gov/cgi-bin/Tools/
Table 4.Main results for the probably X-ray binary identified in the present sample of 2PBC sources.
Object Hα Hβ R AV d Spectral LX
EW Flux EW Flux mag (mag) (kpc) type
2PBC J1911.4+1412 12.3±0.6 1.5±0.1 6.3±1.5 0.4±0.1 17.5 ∼0.85 ∼21 late spectral type 7.4 (15–150)C
1.4 (0.3–10)X
Notes.Equivalent widths (EWs) are expressed in Å, line fluxes are in units of 10−15erg cm−2 s−1 and distance was calculated assumingM
V ∼
0 mag. X-ray luminosities are in units of 1035erg s−1, and the reference band (between round brackets) is expressed in keV. In the last column, the upper case letter indicates the satellite and/or the instrument with which the corresponding X-ray flux measurement was obtained (see text). (C)FromCusumano et al.(2010).(X)FromSwift/XRT.
Fig. 1.Spectrum (not corrected for the intervening Galactic absorption) of the optical counterpart of the probably X-ray binary belonging to the sample of BAT sources presented in this paper, 2PBC J1911.4+1412. For this spectrum, the main spectral features are labeled and⊕indicates telluric absorptions.
the Galactic one along their direction according toSchlegel et al. (1998) (AV∼5.4 mag), indicating that the object is indeed within the Galaxy.
A detailed study of the photometric optical/near-infrared (NIR) information is needed to constrain the nature of the sec-ondary star in this binary system but, due to the faintness of the optical counterpart along with the optical spectral shape and the NIR non-detection in the 2MASS catalogue (Skrutskie et al. 2006), the presence of an early type companion can be ruled out and, consequently, a classification as a high mass X-ray binary (HMXB) is excluded.
A CV nature can also be excluded on the following basis: considering an MV = +9, we obtain a distance ofd ∼340 pc, which is too close to justify the optical absorption displayed on the source spectrum. We thus suggest that this object is proba-bly a low mass X-ray binary (LMXB) with a secondary star of late spectral type at a distance of∼21 kpc (see Table4). This distance is quite large but is not unprecedented (see GS 1354-64, Casares et al. 2004, 2009; Cyg X-2 and XTE J1710-281, Jonker & Nelemans 2004). However we note that theAV value determined from the spectrum, and compared with the galac-tic AV, is too low for that distance of 21 kpc because this dis-tance would imply that the object is located on the far side of the Galaxy and thus the AV should be close to the value in Schlegel et al.(1998) and not just a minor fraction. One possi-bility is that the USNO magnitude is underestimated: if the ob-ject were actually brighter than its tabulated optical magnitude, it would lie closer. Indeed, the USNO photometry can sometimes
be offset by up to 0.3−0.4 mag (e.g.Masetti et al. 2003). Alterna-tively, the absolute magnitudes that we assumed for the LMXB and CV cases are not correct: the object may either be a low optical luminosity LMXB or a bright CV. This, again, would al-ter the real distance of the object. In conclusion, we cannot give a precise identification for this object, although we deem more probable that it may be a distant LMXB.
On the other hand, in order to get clues on the measured distance to 2PBC J1911.4+1412, we noted that the object is tabulated in the proper motion catalogue ofRoeser et al.(2010) (PPMXL). Unfortunately, the error in the measured proper mo-tion is larger than the proper momo-tion value (pmRA = 2.0 ±
6.3 mas/yr, pmDec=−5.0±6.3 mas/yr), therefore only an upper limit to the velocity (<130 km s−1in case of a distance of 21 kpc) can be given. We note that this value is typical of LMXBs.
4.2. CVs
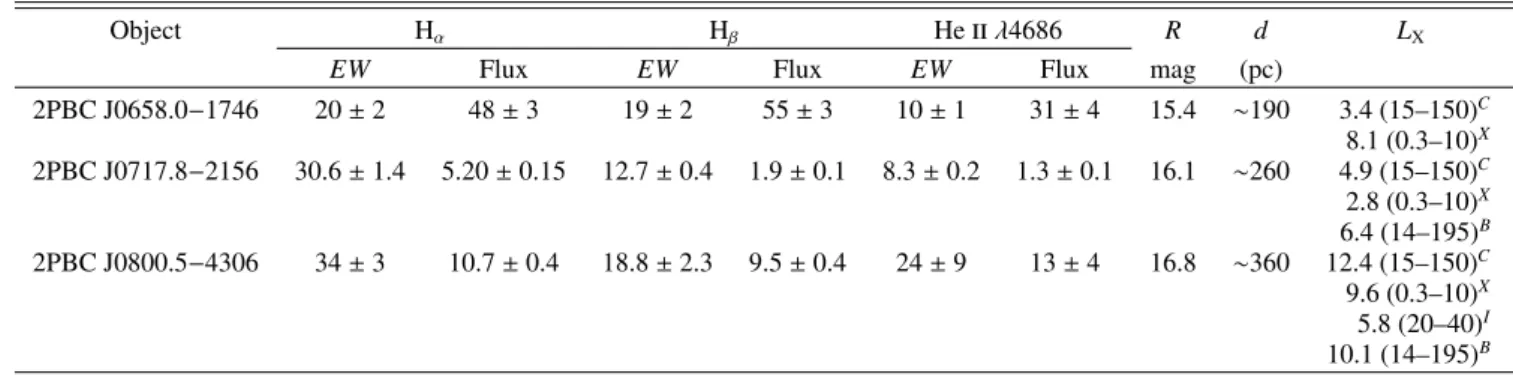
Three sources in our 2PBC sample display emission lines of the Balmer complex, as well as He I and He II, consistent withz=0, indicating that these objects lie within our Galaxy (see Fig.2). The analysis of their optical features indicates that all of them are CVs (Table5). TheAV of these objects are consistent with
∼0 according to their HHαβ flux ratios and, when compared with the Galactic one along their direction according toSchlegel et al. (1998) (AV ∼1.9,∼4.1 and∼1.3 mag for 2PBC J0658.0-1746, 2PBC J0717.8-2156 and 2PBC J0800.5-4306, respectively), this confirms their galactic nature and their proximity to Earth.
Through the equivalent widths (EW) of the Hβand He IIλ4686 lines we investigated their magnetic nature, that is, the possibil-ity that they are harbouring a magnetised white dwarf (WD) and thus that they may be polar or intermediate polar (IP) CVs. The three objects classified as CVs have EWs of both He IIλ4686and Hβ larger than 10 Å, and for 2PBC J0658.0−1746 and 2PBC
J0717.8−2156 the He IIλ4686/HβEW ratio is higher than 0.5, im-plying that both objects are magnetic CVs likely belonging to the IP subclass, whereas 2PBC J0800.5−4306 is likely a polar CV because its He IIλ4686/HβEW ratio is higher than one (seeWarner
1995). Optical-NIR time-resolved spectrophotometric followup is thus mandatory to confirm the magnetic nature of all of these CVs.
We note that the object 2PBC J0717.8−2156 was analysed byHalpern & Thorstensen(2015) who indicated a CV nature for it; however, the optical spectrum of this source published in that paper was not flux calibrated. Here we complete the information on this object by presenting a flux-calibrated spectrum and by confirming a (possibly magnetic) CV nature for it.
Fig. 2.Spectra (not corrected for the intervening Galactic absorption) of the optical counterparts of the three CVs belonging to the sample of BAT sources presented in this paper. For each spectrum, the main spectral features are labelled and⊕indicates telluric absorptions.
Table 5.Synoptic table containing the main results concerning the three CVs identified in the present sample of 2PBC sources.
Object Hα Hβ He
ii
λ4686 R d LX band (between round brackets) is expressed in keV. In the last column, the upper case letter indicates the satellite and/or the instrument with which the corresponding X-ray flux measurement was obtained (see text).(C)FromSwift-BAT catalogue (Cusumano et al. 2010),(X)fromSwift/XRT, (B)fromSwift-BAT (Baumgartner et al. 2013) and(I)from INTEGRAL/IBIS catalogue (Baumgartner et al. 2016).4.3. Active stars
The object 2PBC J0620.8−2932 shows the optical features of an active star in its spectrum (Fig.3). We recall that this object is within the BAT error box at 99% confidence level and does not display X-ray emission at above 3 keV in the XRT observations; nevertheless, we suggest that this source can be classified as a chromospherically active star, with a star-like continuum typical of late-G/early-K type stars, a faint emission of Hα, and absorp-tion bands such as G, NaD, and Mg b atz=0, and we think that the flux above 3 keV from this source is possibly transient and could be due to flares (Sguera et al. 2016;Krivonos et al. 2007; MVI; MIX; MX). This conclusion is supported by the compari-son between hard and soft fluxes of the source in Table6, which isF15−150 keV/F0.3−10 keV≈16, indicating that the star could have been undetected by BAT during a flare.
An estimate for the distance to this object can be evaluated, as suggested inRodriguez et al.(2010), assuming similarity with the active star II Peg (which has magnitudeR∼6.9 and distance 40 pc; Monet et al. 2003; van Leeuwen 2007). We considered that 2PBC J0620.8−2932 has a USNO-A2.0 magnitudeR∼14.7 and we consequently obtained the distance reported in Table6, which is actually an upper limit since we consideredAV ∼0 mag because we cannot determine the reddening along the source line of sight with the presently available information.
4.4. AGNs
The results for the extragalactic sources are reported in Tables7, D.1, andD.2, where for each source we list fluxes, the classifi-cation, the estimated redshift, the luminosity distance (in Mpc), the Galactic colour excess, and the colour excess local to the AGN host.
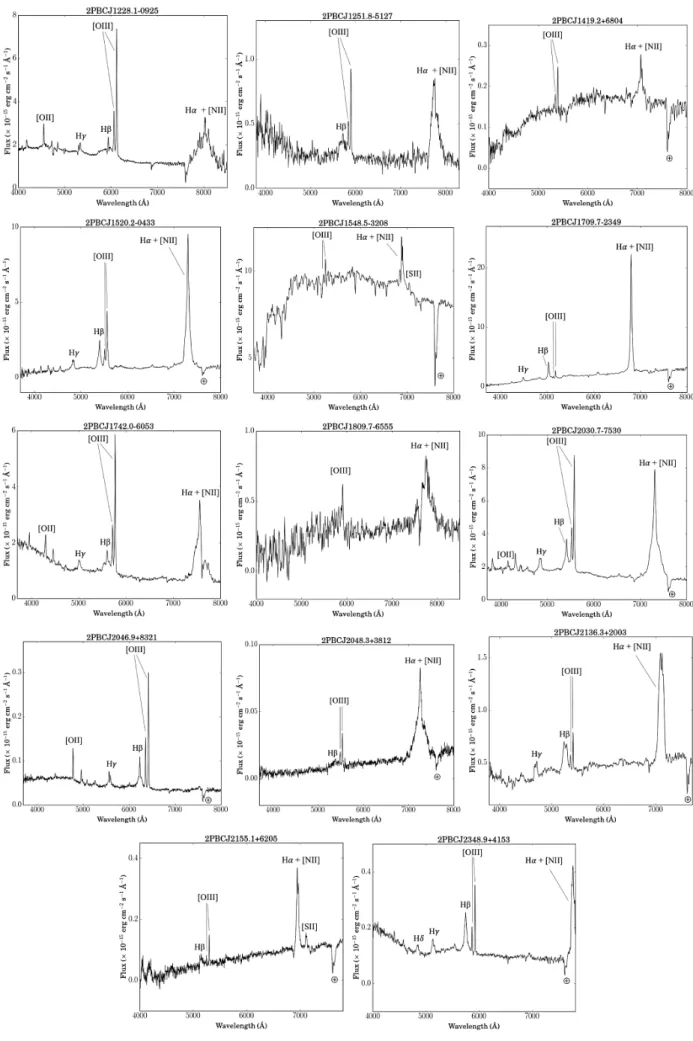
We found that among 45 extragalactic objects, 27 have strong redshifted broad and narrow emission lines that are typical of type 1 AGNs (Figs.4 and5) and 18 have only strong and red-shifted narrow emission lines that are typical of a type 2 AGN nature (see Figs.6–9).
In our sample, we report the redshift value for most AGNs for the first time and most of them are in the range 0.004–0.294, that is, the AGNs of our sample are located in the local Uni-verse (z<0.3) except 2PBC J2010.3−2522, the QSO reported in Table5which is at redshift 0.828.
Table 6.Main observational results for the active star as identified in the present sample of 2PBC sources. (between round brackets) is expressed in keV. In the last column, the upper case letter indicates the satellite and/or the instrument with which the corresponding X-ray flux measurement was obtained (see text).(C)FromCusumano et al.(2010).
Table 7.Synoptic table containing the main results for the QSO identified in the present sample of 2PBC sources.
Object F[OII] FMgII z DL(Mpc) E(B−V)Gal LX
2PBC J2010.3−2522 0.3±0.1 1.3±0.1 0.828 5234.4 0.164 42.6 (15–150)C
[0.6±0.2] [1.8±0.3] 4.03 (0.3–10)X
47.7 (14-195)B
Notes. Emission-line fluxes are reported both as observed and (between square brackets) corrected for the intervening Galactic absorption
E(B−V)Galalong the object line of sight (fromSchlegel et al. 1998). Line fluxes are in units of 10−15erg cm−2 s−1, X-ray luminosities are in units of 1045erg s−1, and the reference band (between round brackets) is expressed in keV. In the last column, the upper case letter indicates the satellite and/or the instrument with which the corresponding X-ray flux measurement was obtained.(C)FromCusumano et al.(2010) and(X)from
Swift/XRT.(B)FromBaumgartner et al.(2013). The typical error of the redshift measurement is±0.001.
Fig. 3.Spectra (not corrected for the intervening Galactic absorption) of the optical spectra acquired for 2PBC J0620.8−2932, the optical coun-terpart of the active star belonging to the sample of BAT sources pre-sented in this paper. For the spectrum, the main spectral features are labelled and⊕indicates telluric absorptions.
For type 1 AGNs, BH masses and Eddington luminosities are reported in TableD.3, where we corrected the measurement of the observed FWHM of Hβ for the instrumental resolution cor-responding to the relevant telescope setup (see Tables2and3) in order to determine the BH masses. We only report the Hα emis-sion for narrow line sources (Table D.2) as the Hα emission
required more complex fits and sometimes had issues with the blending of [NII] emission lines and atmospheric lines.
For three Sy 2 objects, 2PBC J0356.6−6252, 2PBC J0608.0+5749, and 2PBC J2029.4−6146,
F 2.86, which implies that they could be type 2 AGN without local absorption (these are called “naked” Sy 2;Hawkins 2004). But, in particular, the object 2PBC J0356.6−6252 has strong IR emis-sion due to dust according toYamada et al.(2013), and the anal-ysis of its X-ray spectra according toRicci et al.(2015) indicates
Fig. 4. Spectrum (not corrected for the intervening Galactic absorp-tion) of the optical counterpart of the QSO belonging to the sample of BAT sources presented in this paper, 2PBC J2010.3-2522. For this spectrum, the main spectral features are labelled and⊕indicates telluric absorptions.
a probably Compton thick nature, thus a more detailed study is needed to confirm the nature of this source.
As can be seen in Fig.5, the spectrum of 2PBC J1548.5−
3208 displays a composition of an AGN type Sy 1.9 at red-shift 0.048 and a foreground star due to the inability of our setup to disentangle the pair of sources.
Fig. 5.Optical spectra of type 1 AGNs presented in this work (not corrected for the intervening galactic absorption). For each spectrum, the main spectral features are labelled and⊕indicates telluric absorptions.
This second source has coordinates (J2000) RA =08:19:16.2, Dec =−25:07:06.9 with error radius of 600 and is positionally
associated with aR≈19 optical source. We think that the pro-posed ROSAT soft X-ray counterpart inCusumano et al.(2010) could actually not be the real soft X-ray counterpart of 2PBC J0819.2−2508 and instead this other source could be; at the very least, both could be contributing to the detected hard X-ray
emission. The nature of this object and, in turn, an optical spec-trum of this other source is required in order to confirm if this is a possible soft X-ray counterpart to 2PBC J0819.2−2508.
Fig. 7.Spectrum (not corrected for the intervening Galactic absorption) of the optical counterpart of the starburst galaxy belonging to the sample of BAT sources presented in this paper, 2PBC J1555.0-6225. For this spectrum, the main spectral features are labelled and⊕indicates telluric absorptions.
Fig. 8.Spectrum (not corrected for the intervening Galactic absorption) of the optical counterpart of the LINER belonging to the sample of BAT sources presented in this paper, 2PBC J2238.9+4050. For this spec-trum, the main spectral features are labelled and ⊕indicates telluric absorptions.
field that this ROSAT source has no X-ray emission inside its error circle. Rather, there is another source inside the 90% BAT error circle of 2PBC J1520.2−0433, indicated with a black arrow in that figure, with emission above 3 keV. Thus, we considered this latter source as the actual soft X-ray counterpart for the op-tical follow-up.
As mentioned in Sect. 2, the object 2PBC J1020.5−0235 has two hard X-ray emitting sources just outside the 99% BAT er-ror circle (see Fig. A.3), listed as Swift J1020.5−0237A and Swift J1020.5−0237B in the 70-monthSwift-BAT catalogue of Baumgartner et al.(2013); in this work, we analysed the object A and we identified it as a Sy 2 atz=0.294 (see TableD.2and Fig.6).
For the object 2PBC J2010.3−2522, that we classified as type 1 QSO atz∼0.8, we found in the literature that this object could be associated with a Fermi transient J2007−2518 that
Fig. 9.Spectrum (not corrected for the intervening Galactic absorption) of the optical counterpart of the XBONG belonging to the sample of BAT sources presented in this paper, 2PBC J1332.1-7751. For this spec-trum, the main spectral features are labelled and ⊕indicates telluric absorptions.
is also spatially coincident with a radio source (Kocevski et al. 2014).Strader et al.(2014) acquired an optical spectrum of this same source and obtained results equivalent to ours. We thus confirm the QSO nature of this object and its possible associ-ation to the Fermi transient J2007−2518.
We found that the object classified as a starburst galaxy in our sample, 2PBC J1555.0−6225, has WISE magnitudes and colours that indicate an AGN nature according to the criteria of Secrest et al.(2015): (W1−W2)=0.56, (W2−W3) =2.34>2. This could be an elusive AGN as inSmith et al.(2014) and we are probably only seeing the starburst contribution in its opti-cal spectrum, with the X-ray emission detected from the hidden nuclear activity.
For the object 2PBC J1332.1−7751, classified as XBONG, Davies et al. (2015) reported a column density in X-ray of Log(NH)=23.8 cm−2, that is almost at the limit to be a Compton Thick object (with Log(NH)>∼24 cm−2) and they classified it as a Seyfert galaxy, but no optical classification is considered for this object in that work. Thus, 2PBC J1332.1−7751 is a pecu-liar object that is absorbed in X-ray and optically obscured. Our classification as XBONG is then supported by the information fromDavies et al.(2015): the AGN optical appearence is likely hidden due to dust obscuration revealed in X-ray spectrum.
We note that in the field of the object 2PBC J0838.7+2612, there is another object with emission above 3 keV inside the 99% BAT error circle, indicated with tick marks (see Fig.A.1). For the sake of completeness, in Appendix B we thus report the main op-tical spectroscopic information we gathered about this source (a galaxy pair). Furthermore, the soft X-ray source that we associ-ated with the object 2PBC J2030.7−7530 is the hardest source with emission above 3 keV within the BAT error circle (its count rate is at least 20 times larger than the other sources within the BAT error box). In the same way, the object 2PBC J1419.2+6804 has a count rate two orders of magnitude stronger than the other objects inside the 90% BAT error circle (see Appendix A).
Fig. 10.Histogram, subdivided into source types, showing how the ini-tial percentage of objects in the 54 months PalermoSwift-BAT cata-logue (in green) has changed by means of the identifications performed by other authors (in grey) and by our group in PI-PIII and in this work (R16) (in yellow).
It was found that all objects show aT parameter>1 (from 2.5 to 430), so all of them apparently lie in the Compton thin regime, with NH < 1024 cm−2. We, however, stress that the T values should be considered as upper limits because the soft X-ray fluxes that we considered refer to bands which are wider (0.3−10 keV) than the one for which this method should be ap-plied (2−10 keV).
Moreover, we support this result by applying the criterion of Malizia et al. (2007): we found that all our type 2 AGNs lie in the Compton thin regime with softness ratio Fxsoft/Fxhard from 0.02 to 0.41. Although we use a different soft and hard X-ray ranges (0.3−10 keV and 15−150 keV instead of 2−10 keV and 20−100 keV), the approach can be considered equivalent and the results comparable.
4.5. Statistics
We here give an update of the statistics concerning the identifica-tions of new hard X-raySwift-BAT sources including the results of our group in this work and those in PI, PII, and PIII.
Considering all works, we identified 171Swift-BAT objects through optical spectroscopy and their separation into the main classes is the following: 157 (92%) are AGNs, two are star-burst galaxies (1%), one (0.6%) is probably an X-ray binary, ten (5.8%) are CVs, and one case (0.6%) is likely identified as an active star. We were able to drastically decrease the percentage of unidentified objects in the BAT survey, as shown in Fig.10, where the unknown source type percentage decreased from more than 20% to∼10% thanks to our systematic work (yellow bars). The green bars in Fig. 10 represent the initial 54-month Palermo Swift-BAT catalogue and the grey bars represent the classification of 20 AGNs and 18 galactic objects performed by other authors and available in the literature, as well as by our group using information already existing in the Simbad database (see Appendix C for the relevant information concern-ing these sources). We would like to stress that those other works have been able to reduce by∼3% the percentage of unclassified sources in the catalogue ofCusumano et al.(2010), whereas our
Fig. 11.Histograms showing the redshift distribution ofSwift-BAT ob-jects analysed and classified as AGNs in this sample (above) and those in the previous works of PI-III (below).
enduring classification work has allowed us to decrease by∼10% the percentage of these objects.
All AGNs (Seyfert 1, Seyfert 2, starburst galaxy, and LINERs) and XBONG in our sample and PI-PIII samples are at low redshifts (z <0.5) while only two QSOs are located at z>0.5.
We can see that the high-redshift QSOs found in our identifi-cation programme are of type 1. This is reasonably explained by the evidence that soft X-rays, needed for a precise localisation of the source, are not easily detected from type 2 QSOs due to local absorption in these sources, which adds to the faintness tied to their distance.
Figure11shows the redshift distribution of AGNs analysed in this work and the previous works of PI, PII, and PIII, repre-sented by a histogram and binned according to the rules ofKnuth (2006), which are based on the optimisation of a Bayesian fitness function across fixed-width bins.
The redshift distributions for the present sample and that of the PI-III merged sample were studied through a two sample Kolmogorov-Smirnov (KS) test. When we compare our redshift sample of Sy 1 with that of PI-III, we find that the KS test gives a p-value∼0.001, whereas the comparison between the Sy 2 samples gives a p-value ∼0.178. This suggests that our Sy 1 sample is drawn from a different redshift distribution compared with the Sy 1 sample of PI-III. There is no univocal explana-tion for this: the difference could be due, for instance, to the fact that we on average used larger telescopes than those used in the PI-III works, thus we were able to observe fainter (and likely more distant) objects. On the other hand, when we compare the distributions of Sy 2 galaxies in the two samples, we see that they are consistent with belonging to the same parent popula-tion; therefore the above interpretation cannot be applied to this class of AGNs.
Fig. 12.Distribution of the [OIII]λ5007 to 0.3−10 keV ratio for the AGNs of our sample and corresponding best-fit correlations (see text for details). Red continuous line represents the locus for which the parameterTis equal to 1 and the dotted pink line indicates theBerney et al.(2015) relation for the ratio between the soft X-ray flux and the [OIII]λ5007 unabsorbed flux.
(which means they are difficult to observe with medium-sized telescopes).
Considering this work and PI-III, we found 12 Galactic ob-jects: ten of these are CVs (i.e. 84% of the galactic identifica-tions) and most of them are of magnetic type, whereas one object is an X-ray Binary, most probably a LXRB (8%) and the remain-ing one is an active star (8%). We can confirm that theSwift satel-lite is efficient in detecting magnetic CVs because these objects are hard X-ray emitting sources due to their magnetic nature, and because the BAT surveys allow the study of objects outside the Galactic plane and, among them, hard X-ray emitting CVs.
We additionally tested the distribution of our AGNs by com-paring the [OIII]λ5007 unabsorbed flux with the soft X-ray flux following Berney et al. (2015). Specifically, we constructed a plot of the relative strength of the unabsorbed [OIII]λ5007 emis-sion line and the soft X-ray flux. It is important to stress that the soft X-ray fluxes considered refer to a wider band (0.3−10 keV) than that in Berney et al. (2015; 2−10 keV). So, these fluxes should conservatively be considered as upper limits. We found that when we compare the soft X-ray flux with that of the [OIII]λ5007 emission line in our type 2 AGN sample, the re-lation between them shows a Pearson correre-lation coefficient of RPear =0.39 and p-value=0.13, with a standard deviation of
∼0.50 dex. The plot of the relation is shown in Fig.12left panel, with the best fit model (slope 0.49±0.09, orange dashed line) and the locus for which the parameterT is equal to 1 (red con-tinuous line). In this panel, we also show the best fit model for our type 1 AGNs, as a dash-dot line (with slope of 0.60±0.09, in green). We found that for this sample the Pearson correlation coefficient isRPear=0.37 with a p-value=0.06 and a standard deviation of∼0.55 dex. The dotted line (in pink) in both panels indicates theBerney et al.(2015) relation for the ratio between the soft X-ray flux and the [OIII]λ5007 unabsorbed flux. Finally, in the right panel we compare the soft X-ray flux with that of the [OIII]λ5007 emission line in our entire AGN sample (type 1 and type 2), with the best fit as a dashed line (with slope 0.52±0.03, in grey), finding a Pearson correlation coefficient ofRPear=0.41 with a p-value=0.007 and a standard deviation of∼0.53 dex. We can see that the Berney et al.(2015) relation has a steeper slope than our fits. This is possibly due to the range of the soft
X-ray band we considered. Nevertheless, the results agree with those ofBerney et al.(2015), suggesting to us that any correla-tion between these quantities, if present, is marginal at best.
5. Conclusions
In the present work, we identified and characterised 50 X-ray emitting objects with unknown or poorly explored natures, and which are listed in the 2PBC Swift survey. This was accom-plished with the use of seven telescopes of different apertures, from 1.5 to 3.58 m, and of archival data from one spectroscopic survey.
Our main results are as follows.
– The majority of identifications are made up of extragalactic objects. Most of them are AGNs (26 are Seyferts of type 1, 15 cases are Seyferts of type 2, one is a LINER, one is a XBONG and one is a QSO of type 1) and one is a starburst galaxy. This confirms the trend of our previous findings that optical spectroscopy eminently enables the identification of hard X-ray emitting AGNs.
– In this work, we reported 30 new redshifts, 13 confirmations and two more accurate redshift values. All AGNs lie at red-shiftz<∼0.3 except one of them, 2PBC J2010.3−2522, which is a QSO atz∼0.8. For most type 1 AGNs we estimated the BLR size, velocity, and the central BH mass as well as their Eddington ratio, and for type 2 AGNs we studied the local absorption.
– Our sample is thus dominated by extragalactic objects; among them we highlighted some peculiar objects, such as one galaxy displaying LINER features, one starburst galaxy, one XBONG, and two “naked” Seyfert 2 AGNs in the Comp-ton thin regime.
– Five objects in our sample are galactic sources: one is prob-ably a distant LXRB, three are CVs of magnetic nature, and one is an active star.
blended sources such as the case of the object 2PBC J1548.5-3208 in our sample. Furthermore, thanks to its high energy reso-lution,NuSTARcan allow us to identify the different hard X-ray contributions of two sources in the same field, for example in the case of 2PBC J0819.2−2508, as demostrated byKoss et al. (2016b) with Swift J2028.5+2543.
Acknowledgements. We thank Silvia Galleti for Service Mode observations at
the Loiano telescope, and Roberto Gualandi, Ivan Bruni, and Antonio De Blasi for night assistance; Aldo Fiorenzano, Vania Lorenzi, and Walter Boschin for Service Mode observations at the TNG; Manuel Hernández, Rodrigo Hernández, and Jacqueline Seron for Service Mode observations at the CTIO telescope and Fred Walter for coordinating them. We thank the anonymous referee for useful comments and suggestions. We also acknowledge the use of public data from the
Swiftdata archive. This work made use of data supplied by the UKSwiftScience
Data Centre at the University of Leicester, the ASI Science Data Center Multi-mission Archive, of the NASA Astrophysics Data System Abstract Service, the NASA/IPAC Extragalactic Database (NED), of the NASA/IPAC Infrared Sci-ence Archive, which are operated by the Jet Propulsion Laboratory, California Institute of Technology, under contract with the National Aeronautics and Space Administration, and of data obtained from the High Energy Astrophysics Sci-ence Archive Research Center (HEASARC), provided by NASA’s GSFC. This publication made use of data products from the Two Micron All Sky Survey (2MASS), which is a joint project of the University of Massachusetts and the In-frared Processing and Analysis Center/California Institute of Technology, funded by the National Aeronautics and Space Administration and the National Science Foundation. This research has also made use of data extracted from the Sloan Digitized Sky Survey archive; the SIMBAD database operated at CDS, Stras-bourg, France, and of the HyperLeda catalogue operated at the Observatoire de Lyon, France. Alejandra Rojas acknowledges financial support from Universi-dad Andrés Bello. Lorenzo Morelli acknowledges financial support from Padova University grant CPS0204. The IASF and IAPS co-authors acknowledge sup-port from ASI/INAF agreement 2013.025.R0. Gaspar Galaz acknowledges the support of Basal center for Astrophysics and Technologies (CATA), PFB-06.
References
Agudo, I., Bach, U., Krichbaum, T. P., et al. 2007,A&A, 476, L17
Ajello, M., Rau, A., Greiner, J., et al. 2008,ApJ, 673, 96
Aldcroft, T. L., Karovska, M., Cresitello-Dittmar, M. L., et al. 2000, in X-ray Optics, Instruments, and Missions III, eds. J. E. Truemper, & B. Aschenbach,
Proc. SPIE, 4012, 650
Altamirano, D., Linares, M., Patruno, A., et al. 2010,MNRAS, 401, 223
Assafin, M., Andrei, A. H., Vieira Martins, R., et al. 2001,ApJ, 552, 380
Balokovi´c, M., Comastri, A., Harrison, F. A., et al. 2014,ApJ, 794, 111
Barthelmy, S. D. 2004,Proc. SPIE, 5165, 175
Bassani, L., Dadina, M., Maiolino, R., et al. 1999,ApJS, 121, 473
Baumgartner, W. H., Tueller, J., Markwardt, C. B., et al. 2013,ApJS, 207, 19
Berney, S., Koss, M., Trakhtenbrot, B., et al. 2015,MNRAS, 454, 3622
Bird, A. J., Bazzano, A., Malizia, A., et al. 2016,ApJS, 223, 15
Bikmaev, I. F., Burenin, R. A., Revnivtsev, M. G., et al. 2008,Astron. Lett., 34, 653
Buchanan, C. L., McGregor, P. J., Bicknell, G. V., & Dopita, M. A. 2006,AJ, 132, 27
Butler, S. C., Tomsick, J. A., Chaty, S., et al. 2009,ApJ, 698, 502
Burenin, R. A., Mescheryakov, A. V., Revnivtsev, M. G., et al. 2008,Astron. Lett., 34, 367
Burenin, R. A., Bikmaev, I. F., Revnivtsev, M. G., et al. 2009,Astron. Lett., 35, 71
Ho, L. C. 2009,ApJ, 699, 626
Ho, L. C., Filippenko, A. V., & Sargent, W. L. W. 1993,ApJ, 417, 63
Ho, L. C., Filippenko, A. V., & Sargent, W. L. W. 1997,ApJS, 112, 315
Horan, D., & Weekes, T. C. 2004,New Astron. Rev., 48, 527
Horne, K. 1986,PASP, 98, 609
Jonker, P. G., & Nelemans, G. 2004,MNRAS, 354, 355
Kahabka, P., & Hilker, M. 2005,A&A, 435, 9
Kaspi, S., Smith, P. S., Netzer, H., et al. 2000,ApJ, 533, 631
Kauffmann, G., Heckman, T. M., Tremonti, C., et al. 2003,MNRAS, 346, 1055
Klus, H., Bartlett, E. S., Bird, A. J., et al. 2013,MNRAS, 428, 3607
Knuth, K. H. 2006, ArXiv e-prints [arXiv:physics/0605197] Kocevski, D., Ajello, M., Buehler, R., et al. 2014,ATel, 6553
Koss, M. J., Assef, R., Balokovi´c, M., et al. 2016a,ApJ, 825, 85
Koss, M. J., Glidden, A., Balokovi´c, M., et al. 2016b,ApJ, 824, L1
Krivonos, R., Revnivtsev, M., Lutovinov, A., et al. 2007,A&A, 475, 775
Landi, R., Masetti, N., Morelli, L., et al. 2007,ApJ, 669, 109
Landi, R., Bassani, L., Dean, A.J., et al. 2009,MNRAS, 392, 630
Landt, He., Cheung, C. C., & Healey, S. E. 2010,MNRAS, 408, 1103
Lutovinov, A. A., Burenin, R. A., Revnivtsev, M. G., et al. 2012,Astron. Lett., 38, 281
Malizia, A., Landi, R., Bassani, L., et al. 2007,ApJ, 668, 81
Malizia, A., Stephen, J.B., Bassani, L., et al. 2009,MNRAS, 399, 944
Marconi, A., Risaliti, G., Gilli, R., et al. 2004,MNRAS, 351, 169
Markwardt, C. b., Strohmayer, T. E., & Swank, J. H. 2008,ATel, 1443
Masetti, N., Palazzi, E., Pian, E., et al. 2003,A&A, 404, 465
Masetti, N., Palazzi, E., Bassani, L., et al. 2004,A&A, 426, L41 (MI)
Masetti, N., Mason, E., Bassani, L., et al. 2006a,A&A, 448, 547 (MII)
Masetti, N., Pretorius, M. L., Palazzi, E., et al. 2006b,A&A, 449, 1139 (MIII)
Masetti, N., Bassani, L., Bazzano, A., et al. 2006c,A&A, 455, 11 (MIV)
Masetti, N., Morelli, L., Palazzi, E., et al. 2006d,A&A, 459, 21 (MV)
Masetti, N., Mason, E., Morelli, L., et al. 2008,A&A, 482, 113 (MVI)
Masetti, N., Parisi, P., Palazzi, E., et al. 2009,A&A, 495, 121 (MVII)
Masetti, N., Parisi, P., Palazzi, E., et al. 2010,A&A, 519, A96 (MVIII)
Masetti, N., Parisi, P., Jiménez-Bailón, E., et al. 2012,A&A, 538, A123 (MIX)
Masetti, N., Parisi, P., Palazzi, E., et al. 2013,A&A, 556, A120 (MX)
Masetti, N., Saito, R. K., Rojas, A., & Minniti, D. 2016,ATel, 8733
Minniti, D., Lucas, P. W., Emerson, J. P., et al. 2010,New Astron., 15, 433
McLure, R. J., & Jarvis, M. J. 2002,MNRAS, 337, 109
Monet, D. G., Levine, S. E., Canzian, B., et al. 2003,AJ, 125, 984
Morelli, L., Calvi, V., Masetti, N., et al. 2013,A&A, 556, A135
Osterbrock, D. E. 1989, Astrophysics of Gaseous Nebulae and Active Galactic Nuclei (Mill Valley: Univ. Science Books)
Pandey, J. C., Singh, K. P., Drake, S. A., & Sagar, R. 2005,ApJ, 130, 1231
Parisi, P., Masetti, N., Jiménez-Bailón, E., et al. 2009,A&A, 507, 1345 (PI)
Parisi, P., Masetti, N., Jiménez-Bailón, E., et al. 2012,A&A, 545, A101 (PII)
Parisi, P., Masetti, N., Rojas, A. F., et al. 2014,A&A, 561, A67 (PIII)
Predehl, P., & Schmitt, J. H. M. M. 1995,A&A, 293, 889
Renaud, M., Marandon, V., Gotthelf, E. V., et al. 2010,ApJ, 716, 663
Riaz, B., Gizis, J. E., & Harvin, J. 2006,AJ, 132, 866
Ricci, C., Ueda, Y., Koss, M. J., et al. 2015,ApJ, 815, L13
Rigby, J. R., Diamond-Stanic, A. M., & Aniano, G. 2009,ApJ, 700, 1878
Rodriguez, J., Tomsick, J. A., Bodaghee, A., et al. 2009,A&A, 508, 889
Rodriguez, J., Tomsick, J. A., & Bodaghee, A. 2010,A&A, 517, A14
Roeser, S., Demleitner, M., & Schilbach, E. 2010,AJ, 139, 2440
Rojas, A., Masetti, N. & Minniti, D. 2012a,ATel, 4006
Rojas, A., Masetti, N. & Minniti, D. 2012b,ATel, 4342
Rojas, A., Masetti, N. & Minniti, D. 2013,ATel, 4802
Saito, R. K., Hempel, M., Minniti, D., et al. 2012,A&A, 537, A107
Saito, R. K., da Dilva, M. V., Melo, I. S., et al. 2016,ATel, 8456
Scaringi, S., Bird, A. J., Norton, A. J., et al. 2010,MNRAS, 401, 2207
Secrest, N. J., Dudik, R. P., Dorland, B. N., et al. 2015,ApJS, 221, 12
Sguera, V., Bazzano, A., Bird, A. J., et al. 2006,ApJ, 646, 452
Sguera, V., Bazzano, A., Fiocchi, M., et al, 2016,ATel, 9255
Skrutskie, M. F., Cutri, R. M., Stiening, R., et al. 2006,AJ, 131, 1163
Smith, K. L., Koss, M., & Mushotzky, R. F. 2014,ApJ, 794, 112
Stephen, J. B., Bassani, L., Malizia, A., et al. 2006,A&A, 445, 869
Strader, J., Chomiuk, L., Landoni, M., et al. 2014,ATel, 6555
Thorstensen, J. R., & Halpern, J. 2013,AJ, 146, 107
Ubertini, P., Lebrun, F., Di Cocco, G., et al. 2003,A&A, 411, L131
Ueda, Y., Hashimoto, Y., Ichikawa, K., et al. 2015,ApJ, 815, 1
van Leeuwen, F. 2007,A&A, 474, 653
van Paradijs, J., & McClintock, J. E. 1995, Optical and ultraviolet observations of X-ray binaries, in X-ray Binaries, eds. W. H. G. Lewin, J. van Paradijs, & E. P. J. van den Heuvel (Cambridge: Cambridge Univ. Press), 58
Veilleux, S., & Osterbrock, D. E. 1987,ApJS, 63, 295
Vestergaard, M. 2004, Black-Hole Mass Measurements, in AGN Physics with the Sloan Digital Sky Survey, eds. G. T. Richards, & P. B. Hall (San Francisco: ASP),ASP Conf. Ser., 311, 69
Voges, W., Aschenbach, B., Boller, T., et al. 1999,A&A, 349, 389
Warner, B. 1995, Cataclysmic variable stars (Cambridge: Cambridge University Press)
Watson, M. G., Schröder, A. C., Fyfe, D., et al. 2009,A&A, 493, 339
Winkler, C., Courvoisier, T. J.-L., Di Cocco, G., et al. 2003,A&A, 411, L1
Winkler, H. 1992,MNRAS, 257, 677
Winter, L., Lewis, K. T., Koss, M., et al. 2010,ApJ, 710, 503
Wright, E. L. 2006,PASP, 118, 1711
Wu, X.-B., Wang, R., Kong, M. Z., et al. 2004,A&A, 424, 793
Yamada, R., Oyabu, S., Kaneda, H., et al. 2013,PASJ, 65, 103
Fig. A.1.Soft X-ray images (0.3–10 keV) of the fields of 2PBC hard X-ray sources selected in this paper for optical spectroscopic follow-up. The object name is indicated in each panel. The BAT error circle is shown in blue and the new soft X-ray counterpart identifications for which the optical spectra were acquired are indicated with black arrows. In all cases, the objects selected as soft X-ray counterparts are the only ones with emission above 3 keV or with emission at 3σconsidering the entire band of 0.3−10 keV. Field sizes are 200×
200
Fig. A.2.XRT soft X-ray images (0.3–10 keV) of the fields of2PBCsources for which the corresponding soft X-ray counterpart is outside the 90% error BAT circle (continuous circle, in blue) and inside or at the edge of the 99% BAT error circle, indicated with dashed blue line. The counterpart identifications for which the optical spectra were acquired are indicated with arrows. Field sizes are 200×
200
. In all cases, north is up and east to the left.
Fig. A.3.XRT soft X-ray observation of the field of 2PBC J1020.5−0235. The 90% BAT error circle is shown as a continuous blue line while the 99% error circle is indicated with a dashed blue line. The object for which optical spectroscopy was acquired is indicated with an arrow. Information on object B is presented in PIII. Field size is 200×
200
. North is up and east to the left.
Fig. A.4.Soft X-ray observations (0.3–10 keV) of the field of two2PBCsources for which the positions of the soft X-ray counterparts proposed in this work do not coincide with those reported in theCusumano et al.(2010) and/orBaumgartner et al.(2013) catalogues (see text). The 90% BAT error circle is shown in blue and our proposed soft X-ray counterpart identifications, for which the optical spectra were acquired, are indicated with arrows. Field sizes are 200×
200
Optical coordinates FHα FHβ F[OIII] Class z DL E(B−V) LX
(J2000) (Mpc) Gal. AGN
RA=08:38:59.29 20.4±3 1.43±0.15 2.91±0.12 LINER 0.048 229.7 0.047 1.68 1.74 (0.3−10)X
Dec= +26:08:13.1 [22.5±4] [1.65±0.12] [3.52±0.3]
Notes.Optical coordinates were extracted from 2MASS catalogue, with an accuracy better than∼000.1. Emission-line fluxes are reported both as observed and (between square brackets) corrected for the intervening Galactic absorption E(B−V)Galalong the object line of sight (from
Schlegel et al. 1998). Line fluxes are in units of 10−15erg cm−2s−1, X-ray luminosities are in units of 1043erg s−1, and the reference band (between round brackets) is expressed in keV. In the last column,(X)indicates that the luminosity was calculated using the corresponding X-ray flux measured fromSwift/XRT counts rate assuming a power law model with photon index ofΓ =1.8. The typical error of the redshift measurement is±0.001.