Central East European Countries’ accession into the European Union: role of extensive margin for trade in intermediate and final goods
36
0
0
Texto completo
(2) I.. Introduction Geographical proximity as well as historical evidence suggests that Western. Europe and Central-East Europe are natural trading partners. Despite this, trade between the eastern and western parts of the European continent was suppressed by two restraints before 1989. The first were explicit government policies of import licensing, state monopolies on foreign trade, foreign exchange restrictions and central planning. The second, less direct, were the growth inhibiting aspects of central planning which impacted negatively income levels in Central-East Europe. The Europe Agreements established bilateral free trade between the European Union (EU) and each individual Central Eastern European country (CEEC) in most industrial products by the end of 1994, and in 2004 and 2007 eight and two CEECs respectively have gained full accession into the EU. According to Kaminski and Ng (2001), before the CEECs became part of the EU, trade between East and West Europe mainly consisted of final products. Following accession however, the CEECs are expected to be more integrated into regional (mainly EU based) production networks and increase their exchange of intermediate products with former EU members. Indeed, recent years witnessed two interrelated developments that have transformed the nature of international trade. On the one hand there has been significant growth of world trade and on the other hand there has been growth of vertical specialization due to production fragmentation and the resulting production sharing. Since the splitting of the production process leads to products crossing borders several times, production fragmentation across borders could account for rapid growth in trade. In addition, the global gains from free trade may be enlarged due to the international. 2.
(3) production sharing allowing stages of production processes to be allocated across countries more efficiently and with comparative advantage as in Yi (2003). The main research issues examined in this paper are the following. First, we examine how the full accession of the CEECs into the EU in 2004 and 2007 affects the trade in intermediate and final goods between the CEECs and the OECD countries. Second, we assess whether the increase in exported final goods from the CEECs to the OECD countries can be explained in part by the increase in new intermediate products imported from the EU. By distinguishing between final and intermediate goods trade, this research is an extension of the work done by Antimiani and Constantini (2010) and Hornok (2010) who are the only authors that estimate the effects of the 2004 EUenlargement on trade. The former paper finds that the effect of the enlargement is much more evident for high-tech than for low-tech sectors, and the second finds that the impact of the enlargement on exports of final goods is positive and greater for the new EU members than for the old EU members. In addition to estimating the effect of the CEECs accession on trade in intermediate and final products separately and the contribution of production networks to trade in final goods, we also analyze the relative impact of the full accession on both margins of trade, extensive and intensive. According to the so-called new-new trade theories based on firm heterogeneity in productivity and fixed cost of exporting as in Melitz (2003), a reduction in trade costs will lead to an increase in trade in two margins: the number of traded varieties (extensive margin) and the average volume of trade (intensive margin). But not all new varieties traded are expected to be consumer goods; new intermediate inputs would be exported to countries producing the final good. Due to 3.
(4) ‘just in time’ production processes, intermediates are more likely to be traded over short distances. The recently developed model by Baldwin and Venables (2010) shows how reductions in trade costs beyond a threshold can result in discontinuous changes in location, with a relocation of a wide range of production stages. The authors highlight that there have been important empirical studies charting the rise of trade in parts and components and that formal measurement has been problematic since trade data do not make clear which goods are inputs into the production of other goods. To analyze the trade flows, we employ a theoretically justified gravity model based on Anderson and Van Wincoop (2003). We define the extensive margin at the country-industry level and measure it as the sum of the number of different items (at the 5-digit digit Standard International Trade Classification (SITC) level) traded between each origin/destination within each industry per year. We estimate two models, one for the CEECs imports of parts and components from the OECD countries, and the other for exports of final goods from the CEECs to the OECD countries over the period 1999 to 2009. We specifically link parts and components with their corresponding final goods by using trade data disaggregated at the 5 digit SITC level to estimate the effect that an increase in imports of intermediates has on exports of the corresponding final products in each 3-digits SITC industry. To our knowledge this has not been done previously. In addition, we estimate the model for trade in final goods for each trade margin (extensive and intensive) to assess the relative importance of trade cost for each margin. Our results indicate that the CEECs accession into the EU has increased trade volumes in both parts and components and final goods between the two parts of the European continent, but only trade varieties in intermediate goods. Once we account for 4.
(5) imports of intermediate goods in the regression model where the dependent variable is exports of final goods, the estimated effect of the CEECs’ accession into the EU on final goods’ trade is considerably reduced. This indicates that part of this effect is in fact due to production networks that may have emerged as a consequence of the decline in transport costs. The remainder of the paper is organized as follows. Section 2 provides a brief discussion of the related literature. Section 3 presents the model specification and discusses several estimation issues. Section 4 describes the data and presents the main results. The conclusions and policy implications are discussed in Section 5.. II. Theoretical Background and Literature Review Jones and Kierzkowski (1990) were the first to propose a theory of international production fragmentation that incorporates differences in comparative advantage in different locations. This new theory is based on the classical (Ricardian) and the neoclassical (Hecksher-Ohlin) trade theories. First, in line with the Ricardian theory, differences in labor skills among labor intensive countries imply that labor skills of one country may be more suitable for one stage of production process while labor skills of another country may be more suitable for another stage of production process. Second, based on the Hecksher-Ohlin theory of international trade, more labor intensive stages of production will locate in labor abundant, lower wage countries, while more capital intensive stages of production will take place in capital abundant countries. This means that a country does not have to have a comparative advantage in every stage of. 5.
(6) production, and a firm can take advantage of country-specific differences in resource endowments and productivities through vertical specialization. Fragmentation and outsourcing can occur within a domestic economy as well and are not necessarily an international phenomenon. Grossman and Helpman (2003, 2004), Antras (2003) and Antras and Helpman (2004, 2008) develop theoretical frameworks that focus on a firm’s organizational choice. Firms can choose to be vertically integrated or to buy customized components from an arms-length supplier located domestically or abroad. The authors emphasize the importance of firm heterogeneity and sector characteristics (headquarter service, capital intensity) for the dominance of one form of vertical specialization over another. The predictions of their models are that domestic fragmentation and outsourcing will occur first with better knowledge of cost-reducing opportunities, lower costs of service links and a better protection of the local legal system. However, trade liberalization in services, integration of international legal systems and better awareness of production capabilities around the globe will lead to international fragmentation and outsourcing. Feenstra (1998) draws attention to the main factors responsible for the growth of trade such as trade liberalization, falling transportation costs, falling tariffs and similarities in the size of the economies engaged in trade relations. He places a particular emphasis on the importance of the disintegration of production as a significant source of increased trade, since intermediate inputs tend to cross borders several times during the manufacturing process. According to Feenstra (1998), the disintegration of the production process, where the manufacturing or the service activities performed abroad are combined with those occurring at home, is the result of the increased integration process. 6.
(7) of the world markets. As a consequence of this increased integration, there has been a breakdown in the vertically-integrated mode of production, with companies outsourcing large amounts of production processes either domestically or abroad. This process of “delocalization” (Leamer, 1996), or “slicing the value chain” (Krugman, 1996) while creating a “kaleidoscope comparative advantage” (Bhagwati and Dehejia, 1994) as well as “intra-mediate trade” (Antweiller and Trefler, 1997) is closely linked to the idea that production occurs internationally as firms tend to shift location rather quickly. Following the same line, Antras and Staiger (2012) also point that international trade in intermediate inputs is nowadays an important characteristic of the world economy. A number of authors have recently used information provided by input-output tables to quantify the increase over time of the relative importance of international production-sharing. In particular, Feenstra and Hanson (1996), using U.S. input-output tables, show that in the period from 1972 to 1990 the share of imported intermediates increased from 5.3 to 11.6 percent of total U.S. intermediate purchases. Also using. input-output tables but for 10 OECD and four emerging market economies, Hummels, Ishii, and Yi (2001), , find that vertical specialization accounts for 21% of these countries’ exports, and grew almost 30% between 1970 and 1990. Yeats (2001) confirms that international trade has grown faster in components than in final goods. Extending the number of countries to 87, Johnson and Noguera (2012) also use input-output and bilateral trade data, and show that in 2001, imports of intermediate goods consisted of two-thirds of total merchandise imports for a significant number of OECD countries. Further evidence is presented in Schott (2004) who shows that international trade in intermediate goods holds a large share in total trade. Moreover, according to Antras and. 7.
(8) Staiger (2012) the share of differentiated inputs in total world trade grew more than 100% between 1962 and 2000, whereas over the same period the share of homogeneous goods fell to half. Using trade statistics instead of input-output tables, Navaretti, Haaland and Venables (2002) assessed the extent of the EU involvement into global production networks. They found that the shares of parts and components in total EU manufacturing (both imports and exports) have grown for trade with all geographic areas over the period 1990-1997. The highest shares were for trade within the EU and with North America. In particular within the EU, there has been significant growth of networking with the CEECs following their gradual economic integration with Western Europe since 1989. According to the study, the shares of parts and components in total EU manufacturing by the Eastern European countries increased from 4.5% to 15.3% for exports and from 5.8% to 12.3% for imports between 1990 and 1997. The authors concluded that although the high-income countries display a higher share of trade in parts and components with the EU than the low-income countries, some of the less developed areas that are geographically close and integrated into the EU, have been gradually increasing their involvement in global production networks. A number of recent studies done by Athukorala and Yamashita (2006), Kimura et al. (2007), Bergstrand and Egger (2008), Baldwin and Taglioni (2011) and Hayakawa and Yamashita (2011) used the standard gravity trade model to examine the main factors responsible for the growth of fragmentation of trade. Based on large datasets with highly disaggregate trade data where the dependent variables are bilateral trade flows of final and intermediate goods as well as FDI flows, these studies find that the coefficients on. 8.
(9) the standard gravity variables such as economic size and distance all have the expected signs. However, Athukorala and Yamashita (2006) obtain a negative coefficient on the difference in per capita income which is a proxy for factor endowment differences. They attribute this to the fact that most global trade in both final goods trade and parts and components is dominated by advanced economies with lower differences in comparative advantage. Kimura et al. (2007) capture differences in location advantages by the income gap between trading countries and find a positive coefficient for East Asia and a negative coefficient for Europe. They conclude that the trade in parts and components in Asia is the result of the existence of shared production networks which attempt to exploit the comparative advantage of each location, while in Europe the trade is dominated by horizontally differentiated goods which are not driven by per capita income differences between countries. Bergstrand and Egger (2008) developed a theoretical rational for estimating simultaneous gravity equations for bilateral trade in final goods, intermediate goods and FDI flows. In their empirical estimation, they find that the growth in trade in intermediates explains roughly one-fifth of the increase in FDI relative to final goods trade. Baldwin and Taglioni (2011) mainly focus on the role played by the income variables in the gravity equation for intermediate goods trade and find that GDP as a measure of economic mass works less well for bilateral trade flows characterized by relatively high shares of intermediates trade but this is only a problem in studies that do not include fixed effects. More closely related to our work, using gravity equations, Hayakawa and Yamashita (2011) examine the effects of Free Trade Agreements (FTAs) on trade in final goods and, separately, in trade in intermediate goods. Interestingly, their results indicate. 9.
(10) that FTAs have a positive and significant effect on trade in final goods in both, the short and the long run, that materialize in higher trade in the first six years following the agreement. In contrast, the FTAs effect on trade in intermediate goods is only positive and significant in the long run, and higher bilateral trade associated with the FTAs is first observed six years after the implementation of the agreements. The usual approach in gravity studies is to focus only on country pairs with strictly positive trade flows. According to the gravity theory, trade is the result of mass attraction and resistance from geographical distance. However, in some cases the attraction may not be strong enough to facilitate trade and ignoring such cases will underestimate the impact of the distance barrier on trade. According to the so-called newnew trade theories based on firm heterogeneity in productivity and fixed cost of exporting as in Melitz (2003), a reduction in trade costs will lead to an increase in trade in two margins: the number of traded varieties (extensive margin) and the average volume of trade (intensive margin). Thus, the standard gravity models do not properly account for the effect of trade costs arising from geographic distance and transport on bilateral trade. To avoid the bias, we estimate separate gravity models for the extensive and the intensive margins of trade. A number of studies have explored the relative impact of the extensive and the intensive margins of trade on export growth. Felbermayr and Kohler (2006) and Helpman et al. (2008) find the majority of the growth of trade between 1970 and the mid-1990s was due to the intensive margin of trade. Similarly Eaton et al. (2008) examine trade by Colombian firms and find that while up to one half of the exporting firms in any given year are new, most export growth is due to changes in sales volume by existing firms. 10.
(11) (intensive margin). Besedes and Prusa (2011) confirm that most of the export growth is due to the intensive margin and that export survival is a significant factor in explaining the differences in the long run export performance of countries. The results by Hummels and Klenow (2005) however, come in stark contrast with the previously reported findings. The authors used data on exports for a large number of product categories with broad geographic coverage and find that the extensive margin accounts for 60% of the greater exports of larger economies. They confirm the same pattern for the U.S. data with more detailed product coverage. Similarly, Evenett and Venables (2002) examine the growth of exports of 23 developing and middle income economies and find that the expansion along the extensive margin played a significant role for the growth of exports of developing countries between 1970 and 1997. Our work builds on the abovementioned studies and uses the gravity model to estimate the effects of the EU enlargement on trade in parts and components and final goods between the CEECs and the OECD countries. Similar to more recent studies done by Athukorala (2006), Kimura et al. (2007) and Hayakawa and Yamashita (2011), we use not only the product description of final products and components from the SITC 7 and 8 categories (Revision 3) to classify products into parts and components and final products but also the correspondence between the Broad Economic Classification (BEC) and the SITC classification. The latest SITC revision (Revision 3) has made the separation of final products and components more accurate than before.. III. Empirical Analysis A. Model Specification and Main Hypothesis 11.
(12) The theoretical foundations of fragmentation, discussed above, suggest that this phenomenon can be justified by well-established trade theories. Therefore, in line with earlier contributions by Anderson (1979) and Bergstrand (1985) and more recent ones by Anderson and van Wincoop (2003), Helpman et al. (2008), Bergstrand and Egger (2008) and Baldwin and Taglioni (2011) we opted for using a gravity model of trade, which is nowadays the most commonly accepted framework for modeling bilateral trade flows. According to the underlying theory, trade between two countries is explained by nominal incomes and the incomes per capita of the trading partners, by the distance between the economic centers of the exporter and the importer, and by a number of trade impeding and trade facilitating factors depending on whether the trading partners belong to the same regional integration agreements and whether they share a common language or a common border. Consistent with this approach, and in order to investigate the effect of production networks, we augment the traditional model of a country’s exports of final goods with a measure of imports of intermediate goods. Adding the time dimension, the gravity models of trade, one for the volume of imports of intermediate goods, MIntijkt , and other for the volume of exports of final goods X ijkt of product k from country i (reporter) to country j (partner) in period t in current Euros are given as . . MIntijkt 0 Yit1 Y jt 2 YH it3 YH jt4 DISTij 5 Fijt 7 uijkt . . X ijkt 0 Yit1 Y jt 2 YH it3 YH jt4 DISTij 5 MInt jk6, t 1 Fijt7 uijkt. (1) (2). where Yit (Yjt) indicate the GDPs of the reporter (partner) in period t, YHit (YHjt) are reporter (partner) GDPs per capita in period t and DISTij is the geographical distance between the capitals (or economic centers) of countries i and j. In the empirical. 12.
(13) application we use CEECs imports of parts and components from the OECD+CEECs and CEECs exports of final goods to the OECD+CEECs.. denotes the total volume. of imports of intermediate goods in the previous period1 from all sources in a given industry k,. denotes other factors that impede or facilitate trade (common language, a. colonial relationship, tariffs, FTAs, or a common border). Finally, uijkt is an idiosyncratic error term that is assumed to be well behaved. Usually the model is estimated in log-linear form2. Taking logarithms and adding time and sectoral dummies, we specify the augmented versions of models (1) and (2), as LMIntijkt 0 t k 1 LYit 2 LY jt 3 LYH it 4 LYH jt 5 LDIST ij 6 EU ijt 7 CONTIG ij 8 LANDi 9 LAND j 10CEEC ij 11 ln(1 Tariff ijkt ) ijkt LX ijkt 0 t k 1 LYit 2 LY jt 3 LYH it 4 LYH jt 5 LDIST ij 6 LMInt. ijk , t 1. (3) . 7 EU ijt 8 CONTIG ij 9 LANDi 10 LAND j 11CEEC ij 12 ln(1 Tariff ijkt ) ijkt. (4). where L denotes variables in natural logarithms, CONTIG and LAND are dummy variables that take the value of 1 if the partner countries share a border or are landlocked respectively, and the other explanatory variables are described above. EU takes the value of one when both trading partners are EU members, zero otherwise and CEEC takes the value of one when the trading partners are Eastern European accession countries and zero otherwise. Tariff denotes the weighted-average ad-valorem equivalent tariff for each industry k.. 1. Imports enter with one lag to account for the fact that parts and components imported in period t-1 can be used to produce final goods in period t. We take the total value of imported parts in a given industry k for two reasons. First, parts could be used in the production of final goods in industry k independently of the country of origin, and second, endogeneity issues that could arise when using bilateral imports are avoided by aggregating imports by destination. 2 We also estimate the model in its original multiplicative form and the main results remain unchanged.. 13.
(14) t denote specific time effects that control for omitted variables common to all trade flows but which vary over time. k and k are industry fixed effects. Finally, ijkt and. ijkt are idiosyncratic error terms that are assumed to be well behaved. Next, trading-partner effects ij and ij could also be specified as fixed effects. According to Baier and Bergstrand (2007) trading-partner unobservable effects are used to control for the potential endogeneity of the formation of free trade agreements. In this case, the influence of the variables that are time invariant cannot be directly estimated. This is the case for distance and contiguity; therefore, their effects are subsumed into the country dummies. With respect to the specification of the multilateral resistance terms, as theoretically suggested by Anderson and van Wincoop (2003), we consider a modification to the previous specification that includes country-and-time effects to account for time-variant, multilateral price terms, as proposed by Baldwin and Taglioni (2006) and Baier and Bergstrand (2007). As stated by Baldwin and Taglioni (2006), the inclusion of time-varying country dummies should completely eliminate the bias stemming from the ‘gold-medal error’ (the incorrect specification or omission of the terms that Anderson and van Wincoop (2003) called multilateral trade resistance). The specification which accounts for the potential endogeneity of the EU dummy and for the multilateral price terms in a panel data framework is given by the following equations: NT. NT. 1. 1. LMIntijkt 0 ij k 1 EU ijt 2 ln(1 Tariff ijkt ) Pit1 Pjt1 ijkt. 14. (5).
(15) NT. NT. 1. 1. LX ijkt 0 ij k 1 EU ijt 2 LMInt jk ,t 1 3 ln(1 Tariff ijkt ) Pit1 Pjt1 ijkt (6) where Pit1 and Pjt1 are time-variant, multilateral (price) resistant terms that are proxied with country-and-time dummies, and ijkt and ijkt denote the error terms that are assumed to be independent and identically distributed. The other variables are defined as in equations (3) and (4), above. Income and income-per-capita variables cannot be estimated because they are collinear with the exporter-and-time and importer-and-time dummy variables. A remaining issue related to the estimation of gravity models of trade is the omission of the extensive margin of trade. We propose to run separate regressions for the extensive margin of trade in which the dependent variables are the number of varieties that are imported (exported) within each industry k. The specification of the estimated models is the same as in equations (1) to (6) with the only difference that the intensive margin of trade (average value traded) is replaced by the extensive margin (number of varieties traded within industries).. B. Data Description and Stylized Facts Our sample consists of 32 countries (30 OECD members and Bulgaria and Romania) for which complete data were available over the period 1999 to 2009 and the variables used in our study draw upon several data sources. The bilateral flows on external trade are from the European Commission’s EUROSTAT database. Based on the SITC Revision 3, and using a detailed level of disaggregation (5 digit SITC), we identified the parts and components and their corresponding final products within the. 15.
(16) machinery and transport equipment group (SITC 7) and miscellaneous manufacture articles group (SITC 8). Based on the literature on production networks, we identified 12 product categories at the two digit SITC level. The final list of parts and components includes 276 items, while the list of final goods consists of 514 items3. Our identification of parts and components follows the work of Athukorala (2006), Kimura et al. (2007) and Hayakawa and Yamashita (2011). GDP data measured at current prices and expressed in millions of Euros are from the EUROSTAT’s national accounts database, while data on population are from the OECD National Accounts Statistics. Information on country-pair specific variables such as distance between countries i and j, whether they have the same colonial origin, share a common border or share a common language are from the CEPII4. Additional covariates include controls for regional trading arrangement5. Tariff data are from the World Bank World Integrated Trade Solution (WITS) database6. Summary statistics of all the variables are shown in Table 1. Table 1. Summary statistics We analyzed the evolution of the extensive margin of trade in both intermediate and final goods between the CEECs and the EU+CEECs in our sample. The extensive margin is calculated as the sum of the number of different items (SITC 5-digits) traded with each origin/destination per year. Hence, an increase in the number of items over time is observed when a new item (with no bilateral trade in the previous year) is 3. The list of countries and product categories are provided in the Appendix in Tables A1 and A2, respectively. 4 CEPII stands for Centre d'Etudes Prospectives et d'Informations Internationales. It is a French leading institute for research on the international economy. 5 The description of all variables is given in Table A3 in the online Appendix at http://works.bepress.com/inma_martinez_zarzoso/20/. 6 https://wits.worldbank.org/. 16.
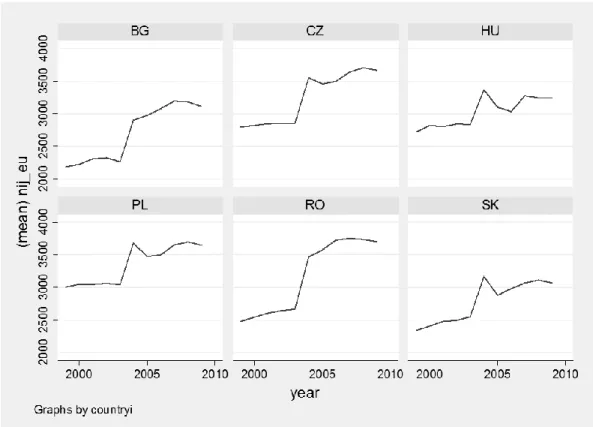
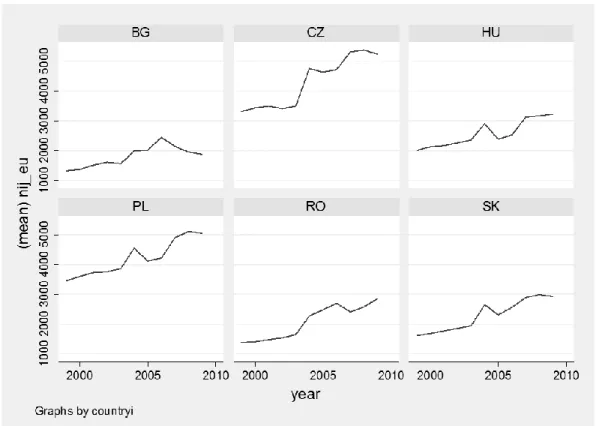
(17) recorded for a given bilateral trade relationship7. With regards to the number of new intermediate products imported from the EU+CEECs, the figures increased steadily over the years, especially after 2003. This suggests that the entry of the CEECs into the EU may have stimulated imports of new varieties of parts and components that were not imported before. Next, we examined the evolution of exported varieties of final goods by each CEEC to EU+CEECs. The figures indicate a similar increasing trend in exports of new final goods for all CEECs between 1999-2003 with a particularly sharp increase in trade between 2003 and 2004. This should not be surprising since all of the CEECs in our sample were preparing for accession into the EU in 2004. After a slight decrease in exports from the CEECs to the EU+CEECs between 2004 and 2005, the exports of final goods for most CEECs followed an increasing trend at least until the onset of the Great Recession in 2007. We also analyzed the evolution of the volume of imports and exports and observed similar trends over time. After accession, the volume of bilateral trade increased between CEECs and the EU members. Finally, in terms of shares of trade in intermediate goods with respect to total trade in SITC categories 7 and 8, the importance of imports of intermediate goods has also grown for most CEECs trade with EU destination and decreased for non-EU destinations, but remains low (between 6 and 15%) in comparison to Asian countries (Athukorala, 2006; Athukorala and Yamashita, 2006).. C. Estimation Results 7. Figures 1and 2 in the Appendix show the evolution over time of the extensive margins of intermediate and final goods trade between the CEECs and the EU+CEEC countries.. 17.
(18) We estimate the above specified models for data on 6 CEECs’ exports to 32 destinations (6 CEECs+ the OECD countries) during the period 1999 to 2009. Table 2 reports the baseline estimation results for disaggregated exports and imports at 3-digit SITC level. The models in columns 1 and 2 show the results for the imports of intermediate goods and exports of final goods respectively using the pooled OLS with time and industry dummy variables (standard gravity models as specified in eqs. (3) and (4)). All models are estimated using robust standard errors clustered across panels (exporter-importer-sector). The interest in this specification is that we are able to estimate separately the effects of accession on intra-Eastern European trade (CEECj variable) from those on trade between CEECs and Western EU countries. Our findings are in line with previous studies in that we find a positive and significant effect for both types of trade, and similar to Hornok (2010) a stronger effect on intra CEECs trade for final goods. The estimated coefficients for other gravity variables show some important differences between trade in intermediate goods and trade in final goods. As expected, the coefficients on the total GDP of the exporting and the importing countries are positive and significant and close to unity but higher in magnitude for imports of intermediate goods than for exports of final goods. Income per capita has a positive and significant effect on CEEC exports of final goods and a negative and significant effect on OECD imports of final goods, whereas per capita income of the exporters (OECD) is statistically significant and has a negative sign for imported parts only. The negative effect of income per capita could indicate that CEECs export goods that are labor intensive. It is worthy to note that the coefficient on the distance variable is significantly higher in the model that. 18.
(19) estimates the trade in the intermediates than in the model that estimates the trade in final goods, while the effect of sharing a common border shows a significantly larger coefficient in the final goods model than in the intermediate goods model. This could indicate that distance is a stronger deterrent factor for trade in intermediate goods than for trade in final goods, but keeping distance constant, contiguity fosters more trade in final goods than trade in intermediates. Tariff barriers have the expected negative effect on trade, showing a higher elasticity for exports of final goods than for imports of part and components, according to results in columns (1) and (2).. Table 2. Determinants of Imports of Intermediate goods and Exports of Final Goods by the CEECs – Intensive Margin Columns 3 and 4 in Table 2 show the results for models that include country-pair fixed effects and time-varying country dummies (Equations 5 and 6). We use the twoway fixed effect within-estimator with robust standard errors 8. The coefficient on the EU dummy variable in column 3 indicates that imports of intermediates by CEECs following their accession into the EU have increased by about 90 percent {exp[0.643]-1)*100} with the member countries. In addition, the coefficient on the EU in the model where the dependent variable is exports of final goods (column 4) is positive and statistically significant indicating that a sizeable increase in exports is due to accession (exports of final goods are 41 percent higher than before accession). The last columns of Table 2 show the results of the gravity equations estimated for final goods augmented with imports of intermediate goods in the previous period. Column 5 shows the result for. 8. A Hausman test indicates that the dyadic unobservable effects are correlated with the error term, hence the random effects approach, ignoring this correlation, leads to inconsistent estimators. The problem can be handled by using the fixed effects approach, which essentially eliminates the dyadic unobservable effects.. 19.
(20) equation (4) and column 6 for equation (6). The effect of imports of intermediate goods on exports of final goods is positive and statistically significant and indicates that a 10 percent increase in imports of intermediate goods by the CEECs from the OECD countries increases exports of final goods of CEECs by 4.6 percent (column 6) while the coefficient on the EU dummy decreases from 0.34 to 0.181 (column 4versus column 6). Summarizing, controlling for multilateral resistance in the most recently recommended way indicates that there is a considerably larger EU effect for imports of intermediates than for exports of final products and that the effect of production networks is sizable. Table 3 presents the results from estimating Equations (3) through (6) where the dependent variable is the extensive margin of trade. In each case we estimate a Poisson model, first with only time and sectoral fixed effects and traditional gravity variables (columns 1 and 2) and then with bilateral, country-and-time and sectoral fixed effects (Columns 3 and 4). Finally, columns 5 and 6 augment the traditional and the fixed effects gravity models with the extensive margin of imports in intermediate goods from all OECD countries. The results from the traditional gravity model, in columns 1 and 2 indicate that in general the semi-elasticities obtained for the income variables and for most of the trade-cost proxies hold the expected sings with a few exceptions. The coefficient on contiguity is negative and significant indicating that countries that share a border import less intermediate products. The coefficient on tariffs is positive but is statistically significant only at the 10 percent level. The coefficients of income per capita in column (1) are both negative and statistically significant indicating that richer countries tend to trade less varieties of. 20.
(21) intermediate goods. The effect of income per capita is positive and significant for the exporters of final goods (column 2) and negative for the importers. The EU accession has a positive and significant effect on the number of varieties imported and exported among Eastern European countries and also for imports of intermediate goods into the CEECs (columns 1 through 4). However, the effect of the accession on the extensive margin of final goods exported from CEECs to the old EU members is negative and significant indicating a decrease in number of varieties exported after accession (column 5). This result is also confirmed using specifications (5) and (6) of the gravity model, that is, controlling for unobserved heterogeneity and for multilateral resistance (column 6). In particular, the EU effect is negative and significant for exports of final goods indicating that after accession the number of varieties exported from Eastern Europe to the EU has decreased. It is important to note that tariffs seem to play a minor role in explaining the extensive margin of trade, since the coefficients are not statistically significant or even show an unexpected positive sign in the traditional specification of the gravity model. This is to be expected if we think that tariffs represent a variable cost of exporting.. Table 3. Determinants of Imports of Intermediate goods and Exports of Final Goods by the CEECs – Extensive Margin Finally, we have re-estimated equations (5) and (6) accounting for lagged effects of the accession into the EU by including lags of the EU dummy. The main results are shown in Table 4. The first column indicates that there are no anticipation effects for the EU accession effect on imports of intermediate goods since the coefficients on 2003 and 2004 EU dummies are not statistically significant, whereas the coefficients on the 2006 21.
(22) and 2007 EU dummies are positive and statistically significant. On the other hand, results in column 2 indicate that there is an EU anticipation effect on exports of final goods, since the coefficient of the 2003 EU dummy is positive and significant Based on the coefficients on the EU variables in column 2, the imports of final goods increased by about 17 percent in year 2003 and by 21 percent in year 2007.. Table 4. Determinants of Imports of Intermediates and Exports of Final Goods with lagged effects of EU accession. As a first robustness check, we estimated the model in its multiplicative form using the method proposed by Santos and Tenreyro (2006) (pseudo Poisson Maximum Likelihood) for the intensive margin which controls for zero trade flows and heteroskedasticity9. The main conclusions remain since the estimated coefficients are similar in magnitude and statistical significant. As a second robustness check we estimated the same models with 5 digit SITC dummies. The results show in general higher integration effects for final goods (coefficient on EU effect is 0.661) and similar effects for intermediate goods (coefficient on EU effect is 0.384)10. It is also worth noting that we found similar EU-effects compared to Hornok (2010). This discrepancy is probably due to the fact that we used more disaggregated data (5 digits versus 2 digits) and two additional years (2008-2009).. IV. Conclusions 9. Results are available upon request. Results are available on request from the authors.. 10. 22.
(23) This paper presents evidence of the significant dynamism of the CEECs trade flows in the last decade. It shows that these economies have been very active and involved in production sharing networks, especially with EU countries. The CEECs have been able to increase their extensive and intensive margins of trade in parts and components and their intensive margin in final goods. These countries appear to be an important destination for the EU exports of parts and components and have also improved their position as exporters of final goods. Our results indicate that the accession of the CEECs into the EU has been a clear driving force behind this development. There are several possible explanations for this. First, as predicted by trade theories, a reduction in the trade cost (associated with the integration process) has favored the segmentation of production processes and led to a better exploitation of comparative advantages and location. Second, integration into the EU has stimulated not only the exploitation of comparative advantages but also the production of new goods, especially intermediate goods, which were previously not produced. Third, due to just in time production process, geographic proximity and sea access are also important determinants of trade in intermediate goods and their absence deters trade to a higher extent than in the case of final goods. For further research it would be desirable to incorporate into the model elements such as infrastructure and communication networks that facilitate trade by allowing the continuity of the value chain.. 23.
(24) References Antimiani, Alessandro and Valeria Costantini,(2010) “Trade performances and technology in the enlarged European Union”, Departmental Working Papers of Economics - University 'Roma Tre' 0111, Department of Economics. Anderson, James E. and Eric Van Wincoop, (2003) “Gravity with gravitas: a solution to the border puzzle”, American Economic Review 93: 170-92. Anderson, James E., (1979) “A theoretical foundation for the gravity equation”, American Economic Review 69:106-16. Antras, Pol, (2003) “Firms, Contracts, and Trade Structure”, The Quarterly Journal of Economics, 118: 1375-1418. Antras, Pol and Elhanan Helpman, (2004) “Global Sourcing”, Journal of Political Economy, 112: 552-580. Antras, Pol and Elhanan Helpman, (2008) “Contractual Frictions and Global Sourcing,” in The Organization of Firms in a Global Economy, ed. by E. Helpman, and T. Verdier. Cambridge: Harvard University Press. Antras, Pol, and Robert W. Staiger, (2012) “Offshoring and the Role of Trade Agreements”, American Economic Review 102(7): 3140-3183. Antweiler, Werner and Daniel Trefler, (1997) “Increasing Returns and All That: A View from Trade”, University of British Columbia and University of Toronto. Athukorala, Prema-chandra and Nobuaki Yamashita, (2006) “Production fragmentation and trade integration: East Asia in a global context”, North American Journal of Economics and Finance 17: 233–56. Athukorala, Prema-chandra, (2006) “Product fragmentation and trade patterns in East Asia”, Asian Economic Papers 4(3): 1-27. Baier, Scott L. and Jeffrey H. Bergstrand, (2007) “Do free trade agreements actually increase members’ international trade”, Journal of International Economics 71: 72-95. Baldwin, Richard and Anthony J. Venables, (2010) “Relocating the value chain: offshoring and agglomeration in the global economy’, Working Paper, London: CEPR. Baldwin, Richard and Daria Taglioni, (2006) “Gravity for dummies and dummies for gravity equations”, National Bureau of Economic Research Working Paper 12516, Cambridge. Baldwin, Richard and Daria Taglioni, (2011) “Gravity chains: Estimating bilateral trade flows when parts and components trade is important”, National Bureau of Economic Research Working Paper 16672. Bergstrand, Jeffrey H., (1985) “The gravity equation in international trade: some microeconomic foundations and empirical evidence”, The Review of Economics and Statistics 67: 474-81. Bergstrand, Jeffrey H. and Peter H. Egger, (2008) “The growth of FDI relative to trade:Measurement, determinants and consequences of international trade flows in intermediates”, University of Notre Dame, mimeo. Besedes, Tibor and Thomas J. Prusa, (2011) “The role of extensive and intensive margins and export growth”, Journal of Development Economics 96: 371-79. Bhagwati, Jagdish, and Vivek H. Dehejia, (1994) “Freer Trade and Wages of the Unskilled-Is Marx Striking Again?” In Jagdish Bhagwati and Marvin H. Kosters, eds., Trade and Wages: Leveling Wages Down? The American Enterprise Institute Press: Washington D.C. pp. 36-75. 24.
(25) Eaton, Jonathan, Marcela Eslava, Maurice Kugler and James R. Tybout, (2008) “The margins of entry into export markets: evidence from Colombia”, In: Helpman, Elhanan, Marin, Dalia, Verdier, Thiery (Eds.), The Organization of Firms in a Global Economy. Harvard University Press, Cambridge, MA, pp. 231–72. Evenett, Simon J. and Anthony J.Venables, (2002) “Export Growth in Developing Countries: Market Entry and Bilateral Trade Flows”, University of Bern Working Paper, mimeo. Feenstra, Robert C. , (1998) “Integration of Trade and Disintegration of Production in the Global Economy”, Journal of Economic Perspectives 12(4): 31-50. Felbermayr, Gabriel J. and Wilhelm Kohler,“ Exploring the intensive and (2006) margins of world trade”, Review of World Economics 142 (4): 642–74. Grossman, Gene M. and Elhanan Helpman, (2003) “Outsourcing vs FDI in industry equilibrium”’ Journal of the European Economic Association, 1: 317-327. Grossman, Gene M. and Elhanan Helpman, (2004) “Managerial Incentives and the international organization of production”, Journal of International Economics, 63: 237262. Hayakawa, Kazunobu and Nobuaki Yamashita, (2011) “The role of Preferential Trade Agreements (PTAs) in facilitating global production networks”, IED Discussion Paper 280. Helpman, Elhanan, Marc Melitz, and Yona Rubinstein, (2008) “Estimating trade flows: trading partners and trading volumes”, The Quarterly Journal of Economics 123(2): 441-87. Hornok, Cecilia, (2010) “Trade-enhancing EU enlargement and the resurgence of East-East trade” Focus on European Economic Integration ZDB-ID 21714939 (3):7994. Hummels, David, Jun Ishii and Kei-Mu Yi, (2001) “The nature and growth of vertical specialization in world trade”, Journal of International Economics 54(1): 75-96. Hummels, David and Peter J. Klenow, (2005) “The variety and quality of a nation's exports”, American Economic Review 95 (3): 704–23. Johnson, Robert C. and Guillermo Noguera, (2012) “Accounting for Intermediates: Production Sharing and Trade in Value Added”, Journal of International Economics 86(2): 224-236. Jones, Ronald and Henryk Kierzkowski, (1990) “The role of services in production and international trade: a theoretical framework” in Ronald W. Jones and Anne O. Krueger, eds., The Political Economy of International Trade: Essays in Honor of Robert E. Baldwin, Oxford: Basil Blackwell, (1990): 31-48.The political economy of international trade: Essays in honor of Robert E. Baldwin (Oxford: Basil Blackwell), pp. 31-48. Kaminski, Bartlomiej and Francis Ng, (2005) “Production disintegration and integration of Central Europe into global markets”, International Review of Economics and Finance 14(3): 377-90. Kaminski, Bartlomiej and Francis Ng, (2001) “Trade and production fragmentation: Central European economies in European Union networks of production and marketing”, The World Bank Policy Research Working Paper Series, WPS 1/2611. 25.
(26) Kimura, Fukunari, Yuya Takahashi and Kazunobu Hayakawa, (2007) “Fragmentation and parts and components trade: comparison between East Asia and Europe”, North American Journal of Economics and Finance 18: 23–40. Krugman, Paul, (1996) “Does Third World Growth Hurt First World Prosperity?”, Harvard Business Review 72: 113-21. Leamer, Edward E., (1996) “In Search of Stolper-Samuelson Effects on U.S. Wages”, NBER Working Paper no. 5427, January. Melitz, Marc J. (2003) “The impact of trade on intra-industry reallocations and aggregate industry productivity”, Econometrica 71(6): 1695-1925. Navaretti, Giorgio B., Jan I. Haaland, and Anthony J. Venables, (2002) “Multinational corporations and global production networks: the implications for trade policy”, Report prepared for the European Commission Directorate General for Trade, London: CEPR. Ng, Francis and Alexander J. Yeats, (2001) “Production sharing in East Asia: who does what for whom, and why?” in L K Cheng, and Henryk Kierzkowski, eds., Global production and trade in East Asia, Boston: Kluwer Academic Publishers, pp. 63-109. Ng, Francis and Alexander J. Yeats, (2003) “Major trade trends in East Asia: what are their implications for regional cooperation and growth?”, Policy Research Working Paper 3084, Washington DC: World Bank. Santos Sylva, Jõao M. C. and Silvana Tenreyro, (2006) “The log of gravity”, The Review of Economics and Statistics 88(4): 641-58. Schott, Peter, (2004) “Across Product versus Within-Product Specialization in International Trade”, Quarterly Journal of Economics, 119(2): 647-678. Sturgeon, Timothy J. (2001) “How do we define value chains and production networks?’, IDS Bulletin 32(3): 9-18. Yeats, Alexander J. (2001) “How big is global production sharing?”, in Sven W. Arndt and Henryk Kierzkowski, eds., Fragmentation: new production patterns in the world economy,Oxford, Oxford University Press. Yi, Kei-Mu (2003) “Can Vertical Specialization Explain the Growth of World Trade?” Journal of Political Economy, 111(1), (2003). Zeddies, Götz (2011) “Determinants of international fragmentation of production in European Union”, Empirica, Springer, 38(4): 511-37.. 26.
(27) FIGURES Figure 1. Evolution of the extensive margin of intermediate goods imported by CEECs from the EU, 1999-2009. Source: authors’ calculations based on EUROSTAT data. The figures show the number of 5-digits codes imported yearly by each country (BG:Bulgary; CZ: Checz Republic; HU: Hungary; PL: Poland; RO:Romania; SK: Slovakia) from EU+CEECs countries. The maximum number per destination is 276 (5digit) codes classified as parts and components.. 27.
(28) Figure 2. Evolution of the extensive margin of final goods exported by the CEECs to the EU countries, 1999 – 2009. Source: authors’ calculations based on EUROSTAT data. The figures show the number of 5-digits codes exported yearly by each country (BG:Bulgary; CZ: Checz Republic; HU: Hungary; PL: Poland; RO:Romania; SK: Slovakia) to EU+CEECs countries. The maximum number per destination is 514 (5digit) codes classified as final products.. 28.
(29) TABLES Table 1. Summary statistics Variable Exports of final goods. Observations 112530. Mean 5127050. Std. Dev 4.20E+07. Min 0. Max 2.40E+09. Imports of intermediate goods. 94116. 5364679. 4.21E+07. 0. 2.32E+09. Log of exports of final goods. 63997. 12.094. 3.338. 0. 21.599. Log of imports of final goods. 75707. 12.029. 3.290. 0. 21.566. Log of GDPi. 112530. 11.094. 0.840. 9.406. 12.801. Log of GDPj. 111210. 12.625. 1.540. 9.011. 16.257. Log of GDP per capitai. 112530. 1.666. 0.578. 0.391. 2.652. Log of GDP per capitaj. 111210. 2.992. 0.786. 0.391. 4.389. EUij. 112530. 0.267. 0.442. 0. 1. CEECsj. 112530. 0.161. 0.368. 0. 1. Log of distance. 112530. 7.481. 1.119. 4.088. 9.821. Landj. 112530. 0.177. 0.382. 0. 1. Landi. 112530. 0.500. 0.500. 0. 1. Common borderij. 112530 64079. 0.102 2.353. 0.303 4.050. 0 0. 1 42. Tariff rates. 64079 0.023 0.038 0 0.351 Log of tariff rates Note: Landi, Landj and Common borderij are dummies that equal to 1 when countries i or j are landlocked or share a border, respectively. EUij is dummy variable equal to 1 if both countries i and j are members of the EU, and CEECsj is a dummy variable equal to 1 if country j belongs to CEECs. Log of tariff rates denotes the ln (1+tariff) and tariff denotes the weighted-average ad-valorem tariff rate from TRAINS.. 29.
(30) Table 2. Determinants of Imports of Intermediate goods and Exports of Final Goods by the CEECs – Linear Models- Intensive margin. VARIABLES Lyi Lyj Lyhi Lyhj Ld Landi Landj Contig EU CEECs Lntariffw. (1) M_Parts lm. (2) X_Final lxf. (3) M_Parts lm. (4) X_Final lxf. 0.883*** (0.0601) 1.397*** (0.0184) 0.0512 (0.152) -0.0749** (0.0371) -1.386*** (0.0285) -0.198* (0.118) 1.051*** (0.0617) 0.294*** (0.0685) 0.741*** (0.0563) 0.268*** (0.0623) -2.483*** (0.574). 0.716*** (0.0769) 0.816*** (0.0217) 1.112*** (0.194) -0.208*** (0.0384) -1.325*** (0.0330) 0.108 (0.149) -0.127* (0.0673) 0.400*** (0.0755) 0.297*** (0.0637) 0.395*** (0.0687) -3.673*** (0.603). 0.643*** (0.0472). 0.347*** (0.0660). -1.911*** (0.554). -2.102*** (0.624). -7.811*** (0.645). -0.763 (0.772). 9.184*** (0.251). 7.324*** (0.322). 45,286 0.569. 38,797 0.494. 45,750 0.641. 39,184 0.538. Lmptotlag Constant. Observations R-squared. (5) X_Final lxf. (6) X_Final lxf. 0.243*** (0.0927) 0.850*** (0.0223) 0.927*** (0.223) -0.260*** (0.0413) -1.311*** (0.0358) -0.249 (0.168) -0.0735 (0.0715) 0.457*** (0.0782) 0.241*** 0.181** (0.0660) (0.0725) 0.424*** (0.0753) -2.858*** -0.959 (0.784) (0.831) 0.477*** 0.461*** (0.0453) (0.0428) -2.620*** 1.420** (0.862) (0.662) 28,669 0.517. 28,982 0.568. Note: The dependent variables are the bilateral imports of intermediates and the bilateral exports of final goods measured at current prices. Landi, Landj, Common borderij, EU and CEECs are dummies equal to 1 when countries are landlocked, share a border, or belong to the EU or to the group of CEECs, respectively. Lntariffsw denote the log of (1+weighted ad-valorem tariff) and lnmavlag is the first lag of imported intermediates from OECD countries. Robust standard errors clustered by sector-exporter-and-importer are in parentheses. * p<0.10, ** p<0.05, *** p<0.01.. 30.
(31) Table 3. Determinants of Imports of Intermediate goods and Exports of Final Goods by the CEECs – Linear Models- Extensive margin. VARIABLES Lyi. (1) Imports Parts nm. (2) Exports Finals nx. 0.154*** (0.0115) 0.287*** (0.00408) -0.132*** (0.0277) -0.0591*** (0.00763) -0.262*** (0.00600) 0.00222 (0.0221) 0.277*** (0.0124) -0.0842*** (0.0165) 0.0522*** (0.0102) 0.0823*** (0.0116) 0.174* (0.105). 0.211*** (0.0225) 0.251*** (0.00693) 0.536*** (0.0520) -0.134*** (0.0110) -0.480*** (0.0105) -0.244*** (0.0410) 0.00186 (0.0200) 0.0475* (0.0262) -0.178*** (0.0155) 0.251*** (0.0174) -0.0107 (0.177). (3) Imports Parts nm. (4) Exports Finals nx. (5) Exports Finals nx. (6) Exports Finals nx. 0.189*** (0.0233) Lyj 0.247*** (0.00738) Lyhi 0.493*** (0.0543) Lyhj -0.126*** (0.0118) Ld -0.481*** (0.0112) Landi -0.216*** (0.0425) Landj -0.00457 (0.0208) Contig 0.0320 (0.0269) EU 0.0145* -0.127*** -0.161*** -0.156*** (0.00785) (0.0138) (0.0161) (0.0152) CEECs 0.268*** (0.0189) Lntariffw -0.237** -0.222 0.445** 0.0753 (0.0971) (0.160) (0.222) (0.213) Lnmavlag 0.466*** 0.377*** (0.0500) (0.0407) Constant -3.092*** -2.645*** 0.217*** -0.668*** -2.744*** -0.540*** (0.128) (0.237) (0.0458) (0.0889) (0.235) (0.0962) Observations 52,578 53,758 53,406 54,586 39,945 40,608 Note: The dependent variables are the bilateral imports of intermediates and the bilateral exports of final goods measured at current prices. Landi, Landj, Common borderij, EU and CEECs are dummies equal to 1 when countries are landlocked, share a border, or belong to the EU or to the group of CEECs, respectively. Lntariffsw denote the log of (1+weighted ad-valorem tariff) and lnmavlag is the first lag of imported intermediates from OECD countries. Robust standard errors clustered by sector-exporter-and-importer are in parentheses. * p<0.10, ** p<0.05, *** p<0.01.. 31.
(32) Table 4. Determinants of Imports of Intermediates and Exports of Final Goods with lagged effects of EU accession. VARIABLES EU2003 EU2004 EU2006 EU2007. (1) DyadMRT_M_Parts lm. (2) DyadMRT_X_Final lxf. -0.0134 (0.0349) 0.0706 (0.0535) 0.480*** (0.0604) 0.585*** (0.0439). -1.911*** (0.555) 9.131*** (0.251). 0.154*** (0.0501) 0.119 (0.0948) 0.111 (0.106) 0.193*** (0.0685) 0.459*** (0.0429) -0.899 (0.831) 1.413** (0.661). 45,750 0.641. 28,982 0.568. lmptotlag lntariffw Constant. Observations R-squared Robust standard errors in parentheses *** p<0.01, ** p<0.05, * p<0.1. 32.
(33) Appendix Table A.1. Economic Organizations of Countries in the Dataset. Abbreviation EU. Title European Union. Members Admitted before 1999: Austria, Belgium, Denmark, Finland, France, Germany, Greece, Ireland, Italy, Luxembourg, Netherlands, Portugal, Spain, Sweden, United Kingdom , Admitted in 2004: Czech Republic, Hungary, Poland, Slovak Republic Admitted in 2007: Bulgaria, Romania. OECD. Organization for Economic Co-operation and Development. CEECs. Central East European Countries. Admitted before 1999: Austria, Australia, Belgium, Canada, Czech Republic, Denmark, Finland, France, Germany, Greece, Hungary, Iceland, Ireland, Italy, Japan, Luxembourg, Mexico, Netherlands, New Zealand, Norway, Poland, Portugal, South Korea, Spain, Sweden, Switzerland, Turkey, United Kingdom, United States Admitted in 2000: Slovakia Bulgaria, Czech Republic, Hungary, Poland, Romania, Slovakia. 33.
(34) Table A.2. List of Parts and Components according to the Standard Industrial Classification (SITC) System Revision 3 Product Categories Power-generating machinery and equipment (SITC 71) Machinery specialized for particular industries (SITC 72). Metalworking machinery (SITC 73) General industrial machinery and equipment, n.e.s., and machine parts, n.e.s (SITC 74). Office machines and automatic data processing machines (SITC 75) Telecommunications and sound recording and reproducing apparatus and equipment (SITC 76) Electrical machinery, apparatus and appliances, n.e.s., and electrical parts thereof (SITC 77). Road vehicles (SITC 78) Other transport equipment (SITC 79) Furniture and parts thereof (SITC 82) Measuring, checking, analyzing and controlling instruments and apparatus, n.e.s. (SITC 874) Photographic apparatus, equipment and supplies and optical goods, n.e.s; watches and clocks (SITC 88). Codes for Parts and Components 71191, 71192, 71280, 71311, 71319, 71321, 71322, 71323, 71332, 71333, 71391, 71392, 71441, 71449, 71481, 71489, 71491, 71499, 71690, 71819, 71878, 71899 72119, 72129, 72139, 72198, 72199, 72391, 72392, 72393, 72399, 72439, 72449, 72461, 72467, 72468, 72488, 72491, 72492, 72591, 72599, 72635, 72689, 72691, 72699, 72719, 72729, 72819, 72829, 72839, 72851, 72852, 72853, 72855 73511, 73513, 73515, 73591, 73595, 73719, 73729, 73739, 73749 74128, 74135, 74139, 74149, 74159, 74172, 74190, 74291, 74295, 74380, 74391, 74395, 74419, 74491, 74492, 74493, 74494, 74519, 74529, 74539, 74568, 74593, 74597, 74610, 74620, 74630, 74640, 74650, 74680, 74691, 74699, 74710, 74720, 74730, 74740, 74780, 74790, 74810, 74821, 74822, 74839, 74840, 74850, 74860, 74890, 74991, 74999 75910, 75980, 75990, 75991, 75993, 75995, 75997. 76211, 76312, 76491, 76492, 76493, 76499. 77129, 77220, 77231, 77232, 77233, 77235, 77238, 77241, 77242, 77243, 77244, 77245, 77249, 77251, 77252, 77253, 77254, 77255, 77257, 77258, 77259, 77261, 77262, 77281, 77282, 77311, 77312, 77313, 77314, 77315, 77316, 77317, 77318, 77322, 77323, 77324, 77326, 77328, 77329, 77423, 77429, 77549, 77557, 77579, 77589, 77611, 77612, 77621, 77623, 77625, 77627, 77629, 77631, 77632, 77633, 77635, 77637, 77639, 77641, 77642, 77643, 77644, 77645, 776446, 77649, 77681, 77688, 77689, 77812, 77817, 77819, 77822, 77823, 77824, 77829, 77831, 77833, 77834, 77835, 77848, 77869, 77879, 77883, 77885, 77886, 77889 78421, 78425, 78431, 78432, 78433, 78434, 78435, 78436, 78439, 78535, 78536, 78537, 78689 79199, 79291, 79293, 79295, 79297 82111, 82112, 82119, 82180 87412, 87414, 87424, 87426, 87439, 87449, 87454, 87456, 87469, 87479, 87490. 88112, 88113, 88114, 88115, 88123, 88124, 88134, 88136, 88210, 88220, 88230, 88240, 88250, 88260, 88310, 88390, 88415, 88417, 88419, 88421, 88422, 88431, 88432, 88433, 88439, 88551, 88552, 88571, 88591, 88596, 88597, 88598, 88599 Note: In order to select relevant parts and components, we first referred to the United Nations’ Broad Economic Category (BEC) classification system. The BEC classification system groups traded goods. 34.
(35) according to their main end use and it is defined in terms of the SITC system. Among seven major categories, industrial supplies (BEC 2), capital goods (BEC 4), and transport equipment (BEC 5) include a subcategory for ‘parts and components’. The corresponding subcategories are BEC 22, 42 and 53. We chose only the items under these subcategories that also correspond to the SITC 7 and SITC 8 categories that we study.. 35.
(36) Table A.3. Definitions of variables Variable Reporter Partner Yi Yj YHi YHj DISTANCEij LANDi LANDj CONTIGij CEECsj EUij. Definition CEECs countries EU and OECD countries GDP of reporter country i. GDP of partner country j. GDP per capita of reporter country i. GDP per capita of partner country j. The distance expressed in kilometers between reporter’s i and partner’s j capital cities. Binary variable that takes the value of “1” if the reporter country is landlocked, meaning they don’t have access to sea or coastline, and “0” otherwise. Binary variable that takes the value of “1” if the partner country is landlocked and “0” otherwise. Binary variable that takes the value “1” if the reporter country “i” and partner country “j” share a common border. Binary variable that takes the value “1” if the partner country belongs to CEECs and “0” otherwise. Binary variable that takes the value “1” if both countries are members of EU.. 36.
(37)
Figure


Documento similar
Namely, while citizens of Central and Eastern European countries feel quite attached to the European Union (affective dimension), it does not necessarily translate into
To meet our objectives with data comparable to those used by the European Union and UNESCO and that enable comparative data with other AACC, we have turned
Catalonia's interregional trade in goods is slightly larger than its international trade, and taking both into account shifts a chronic trade de ficit into a surplus, helps identify
We report the first growth and diet data for European catfish (Silurus glanis) in the Iberian Peninsula and compare three populations in the river Ebro corresponding to the oldest
2005) estimation of interregional trade in goods at a regional level (Eurostat NUTS-2 level: eighteen Spanish regions or ‘‘Autonomous Communities’’) and the first at a
The European Association for Solar Telescopes (EAST), founded in 2006 and currently formed by solar physicists from 15 European countries, aims at providing European
teriza por dos factores, que vienen a determinar la especial responsabilidad que incumbe al Tribunal de Justicia en esta materia: de un lado, la inexistencia, en el
The link between trade liberalization and poverty reduction has played a crucial role on economic policy in developing and least developed countries, particularly in
