TítuloLymphocyte subsets in a population of nonfrail elderly individuals
14
0
0
Texto completo
(2) weakness; (iii) self-reported exhaustion; (iv) slow walk; and (v) low physical activity level (Fried et al., 2001). However, the use of molecular and cellular biomarkers has a great potential of anticipating, at preclinical stages, the recognition of frail individuals and improving outcomes by means of prevention and intervention programs. Several investigators noted an association between frailty and immunological system alterations, including inmunosenescence and inflammation markers (Collerton et al., 2012). Analysis of immunological changes, such as alterations in lymphocyte subsets, during senescence may provide useful markers for frailty and associated pathologies. Flow cytometry has several advantages: (1) It is a precise and reliable technique for the assessment of immunological status (Al-Mawali et al., 2013); (2) a small quantity of biological sample is required; and (3) time needed for the analysis is very short, which is a great benefit in population studies due the vast amount of samples handled. Since reference ranges currently used for lymphocyte subsets are referred to adult individuals in general, without specifically differentiating the elderly group, the aims of this study were to (1) establish reference ranges of lymphocyte subsets (CD3+ T lymphocytes, CD4+ T-helper lymphocytes, CD8+ Tcytotoxic lymphocytes, CD19+ B lymphocytes, and CD56+16+ natural killer [NK] cells) in nonfrail elderly individuals (aged 65 years and over), and (2) assess the evolution of these parameters with age. The influence of other physiological and lifestyle factors—namely, number of positive frailty items, gender, smoking habits, physical exercise, and consumption of alcohol or caffeine beverages—on the lymphocyte subpopulations was also evaluated. Materials and methods Subjects and Sample Collection In total, 144 adult volunteer donors, aged at least 65 years of age, were recruited for this study from several associations of retired or elderly people located in Galicia (in northwestern Spain). Participants were community subjects living at their home. Participants were individually assessed at the centers. All donors completed a questionnaire to assess demographic, lifestyle, and medical information. Qualified staff members with extensive experience in the gerontology field participated in the research for the clinical evaluation and were trained to unify criteria. Participants were excluded if they did not possess the necessary skills to be assessed. Exclusion criteria included taking medications known to affect the immune system and having any chronic infection including human immunodeficiency virus (HIV), hepatitis C virus (HCV), and hepatitis B virus (HBV). Frailty status of each participant was determined according to five criteria proposed by Fried et al. (2001). In brief, these criteria are (i) unintentional weight loss (i.e., not due to dieting or exercise): at least 4.5 kg in past year, (ii) self-reported exhaustion: identified by two questions from the modified 10-item Center for Epidemiological Studies-Depression (CES-D) scale, (iii) weakness: grip strength in the lowest 20% at baseline, adjusted for gender and body mass index, (iv) slow walking speed: the slowest 20% at baseline, based on time to walk 15 ft, adjusting for gender and standing height, and (v) low physical activity: the lowest 20% at baseline, based on a weighted score of kilocalories expended per week, calculated according to the Spanish validation of the Minnesota Leisure Time Activity (MLTA) questionnaire (Ruiz Comellas et al., 2012), according to each participant’s report, and adjusting for gender. Three or more of these criteria need to be present for an individual to be classified as frail; thus, a maximum of two positive criteria was considered the inclusion criterion for this study. Anatomical Therapeutic Chemical (ATC) classification was used to categorize drugs (WHO Collaborating Center for Drug Statistics Methodology, 2013). Whole blood was collected into EDTA Vacutainer tubes between 9:30 and 12:30 a.m., and transported to the lab immediately. Blood samples were stained and fixed within 4 h of collection. The study protocol was approved by the Ethics Committee at the University of A Coruña and conformed to the principles embodied in the Declaration of Helsinki. Before data collection, all individuals were informed about the study and signed the corresponding informed consent. Assessment of Lymphocyte Subsets Peripheral blood lymphocyte phenotypes were determined by three-color direct immunofluorescence surface marker analysis by flow cytometry. The following lymphocyte subsets were evaluated: T lymphocytes (CD3+), T-helper lymphocytes (CD3+ and CD4+), T-cytotoxic lymphocytes (CD3 + and CD8+), B lymphocytes (CD19+), and natural killer (NK) cells (CD3− and CD16+56+). In brief, 100 μl whole peripheral blood was incubated for 15 min in the dark with the following antibodies (Immunostep),.
(3) according to the manufacturer’s instructions: fluorescein isothiocyanate (FITC)-labeled antiCD3, phycoerythrin (PE)-labeled antiCD4, peridinin-chlorophyll-protein complex (PerCP)-labeled antiCD8, PerCP-labeled antiCD19, and PE-labeled antiCD16 and antiCD56. FACS lysing solution (Becton Dickinson) was then added and incubated for 8 min in the dark to remove erythrocytes by lysis. After washing with phosphate buffer solution (PBS), cells were fixed with CellFix (Becton Dickinson), and analyzed in a FACScalibur flow cytometer using Cell Quest Pro software (Becton Dickinson). Lymphocytes were gated on the basis of forward/side scatter plots, and fluorescence data from FL1 (FITC), FL2 (PE), and FL3 (PerCP) were obtained to determine percentages of different lymphocyte subsets. At least 104 events in the lymphocytes window were acquired. All specimens were analyzed using identical reagents, instruments, and procedures. All measurements were analyzed and interpreted by the same analyst following a standard procedure. Background staining was assessed using appropriate isotype controls (Immunostep). The flow cytometer was calibrated using fluorescent beads (CaliBrite) using FACSComp software (all from Becton Dickinson). Statistical Analysis Descriptive statistics (mean, median, standard deviation [SD], standard error [SE], 2.5th to 97.5th percentiles) for each percentage of lymphocytes subset were obtained using standard procedures. The assumption of a normal distribution for continuous variables was verified using the Kolmogorov– Smirnov test. When normality was assumed according to the Kolmogorov–Smirnov test (%CD3+, %CD4+, and %CD16+56+), reference ranges were defined by the mean ± 2SD. When the hypothesis of normality for the quantitative variable was not accepted (%CD8 +, CD4+/CD8+, and %CD19+), data were considered to have a non-Gaussian distribution, and reference ranges were defined as the central 95% of the area under the distribution curve of values (from 2.5 to 97.5%). To achieve a better approximation to the normal distribution, logarithmic transformation was applied to %CD8+ and %CD19+; CD4+/CD8+ rates were transformed to square root values. A preliminary comparison of the mean values between groups was performed with Student’s t-test for two groups (gender, physical activity, and alcohol and caffeine beverages consumption) or single-factor analysis of variance (ANOVA) for more than two groups (frailty positive items, age, and smoking). Linear regression using the natural logarithm (ln) of each subset was then used to test for differences between groups. All statistical models were adjusted for all parameters considered. Correlations between two variables were assessed using Pearson correlation. Values of p < .05 were considered significant. Data were analyzed using the IBM SPSS Statistics software, version 20, and STATA/SE 12.0 for Windows software. Results The characteristics of the study population are presented in Table 1. One hundred and forty-four donors aged 65 years and over (range from 65 to 95) were analyzed. More than half of the subjects (55%) were positive for one frailty item (prefrail—one item), the rate of female gender was largest (64%), distribution among 5 established age groups (grouped by 5 years until 84, and the last category included individuals older than 84 years) was quite equitable, and most subjects were nonsmokers, although there were 22% ex-smokers (who gave up smoking since 6 to 62 years ago). Positive answer to caffeine beverages consumption was obtained for 63% of subjects. Half of the individuals reported consuming alcoholic beverages, and the same rate expended less than 3,350 kcal/week in different physical activities. Table 2 shows drug consumption by the study subjects, classified according to their frailty status (nonfrail, prefrail—one item or prefrail—two items) and the main category of drugs. In general, the more positive frailty items there were, the higher was the drug consumption for all families. Especially remarkable is consumption of drugs for the cardiovascular system, alimentary tract, and metabolism, and anti-infectives for systemic use in all three groups of subjects, and consumption of drugs for the nervous system and musculoskeletal system in the two prefrail groups. Among all ATC system main groups, only drugs from the categories antiparasitic products, insecticides and repellents, and various were not consumed by any study subject..
(4) Table 1. Characteristics of the Study Population. Number of individuals. 144. Frailty items Nonfrail. 37 (25.7%). Prefrail—one item. 79 (54.9%). Prefrail—two items. 28 (19.4%). Gender Males. 52 (36.1%). Females. 92 (63.9%). Smoking Nonsmokers. 107 (74.3%). Smokers. 5 (3.5%). Pack-yearsa Ex-smokers. 26.4 ± 23.9 (6.6–66.0) 32 (22.2%). Pack-yearsa. 14.0 ± 10.4 (0.6–35.0). Years since stop smokinga. 29.2 ± 13.9 (6.0–62.0). Age (years)a. 75.1 ± 6.7 (65–95). 65–69. 38 (26.4%). 70–74. 35 (24.3%). 75–79. 31 (21.5%). 80–84. 24 (16.7%). ≥85. 16 (11.1%). Alcohol consumption No. 74 (51.4%). Yes. 70 (48.6%). Caffeine beverages consumption. a. No. 54 (37.5%). Yes. 90 (62.5%). Physical activity (kcal/week)a,b. 3861 ± 2629 (395–15178). <3,350. 71 (49.3%). ≥3,350. 73 (51.7%). Mean ± SD (range). Calculated according to Minnesota Leisure Time Activity (MLTA) questionnaire (Spanish validation by Ruiz Comellas et al., 2012). b.
(5) Table 2. Number of Individuals Consuming Drugs, Classified According to the Main Group of Drugs (ATC Classification) Group of drugs. Nonfrail. Prefrail, one item. Prefrail, two items. Alimentary tract and metabolism. 18 (48.6%) 41 (51.9%). 23 (82.1%). Blood and blood-forming organs. 8 (21.6%). 21 (26.6%). 10 (35.7%). Cardiovascular system. 18 (48.6%) 56 (70.9%). 20 (71.4%). Dermatologicals. 9 (24.3%). 8 (10.1%). 6 (21.4%). Genitourinary system and sex hormones. 5 (13.5%). 14 (17.7%). 2 (7.1%). Systemic hormonal preparations, excluding sex hormones and insulins. 2 (5.4%). 1 (1.3%). 4 (14.3%). Antiinfectives for systemic use. 20 (54.1%) 35 (44.3%). 15 (53.6%). Musculoskeletal system. 4 (10.8%). 23 (29.1%). 12 (42.9%). Nervous system. 7 (18.9%). 41 (51.9%). 22 (78.6%). Respiratory system. 3 (8.1%). 9 (11.4%). 4 (14.3%). Sensory organs. 9 (24.3%). 24 (30.4%). 11 (39.3%). Immunofluorescence surface marker analysis was performed by flow cytometry. The means, standard errors, medians, and reference ranges for the lymphocyte subsets studied in the whole population are collected in Table 3. Tables 4–10 show the effect of number of positive frailty items, age, gender, smoking habits, physical activity, alcohol consumption, and caffeine beverages consumption, respectively, on lymphocyte subsets, according to linear regression analyses where all these parameters were mutually adjusted.. Table 3. Lymphocyte Subsets in the Whole Population N. Mean. SE. Median. Reference range. %CD3+. 144. 71.70. 0.85. 72.03. 51.24–92.16. %CD4+. 144. 42.06. 0.93. 43.57. 19.80–64.32. %CD8+. 144. 23.88. 0.92. 21.59. 8.28–54.17. CD4+/CD8+. 144. 2.31. 0.13. 2.01. 0.46–6.57. %CD19+. 144. 7.62. 0.38. 6.80. 1.94–20.15. %CD16+56+. 144. 18.77. 0.76. 17.98. 0.61–36.93. Note. SE: mean standard error..
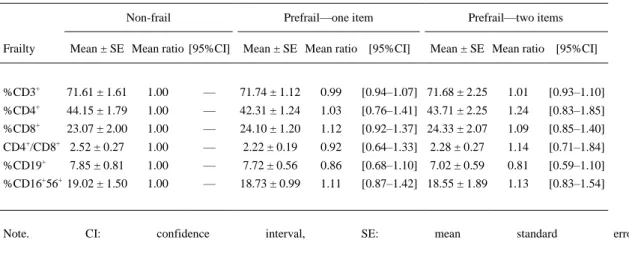
(6) Table 4. Effect of Number of Positive Frailty Items on Lymphocyte Subsets Non-frail. Prefrail—one item. Prefrail—two items. Frailty. Mean ± SE Mean ratio [95%CI]. Mean ± SE Mean ratio [95%CI]. Mean ± SE Mean ratio [95%CI]. %CD3+. 71.61 ± 1.61. 1.00. —. 71.74 ± 1.12. 0.99. [0.94–1.07] 71.68 ± 2.25. 1.01. [0.93–1.10]. %CD4+. 44.15 ± 1.79. 1.00. —. 42.31 ± 1.24. 1.03. [0.76–1.41] 43.71 ± 2.25. 1.24. [0.83–1.85]. %CD8+. 23.07 ± 2.00. 1.00. —. 24.10 ± 1.20. 1.12. [0.92–1.37] 24.33 ± 2.07. 1.09. [0.85–1.40]. CD4+/CD8+ 2.52 ± 0.27. 1.00. —. 2.22 ± 0.19. 0.92. [0.64–1.33]. 2.28 ± 0.27. 1.14. [0.71–1.84]. %CD19+. 7.85 ± 0.81. 1.00. —. 7.72 ± 0.56. 0.86. [0.68–1.10]. 7.02 ± 0.59. 0.81. [0.59–1.10]. %CD16+56+ 19.02 ± 1.50. 1.00. —. 18.73 ± 0.99. 1.11. [0.87–1.42] 18.55 ± 1.89. 1.13. [0.83–1.54]. Note.. CI:. confidence. interval,. SE:. mean. standard. error..
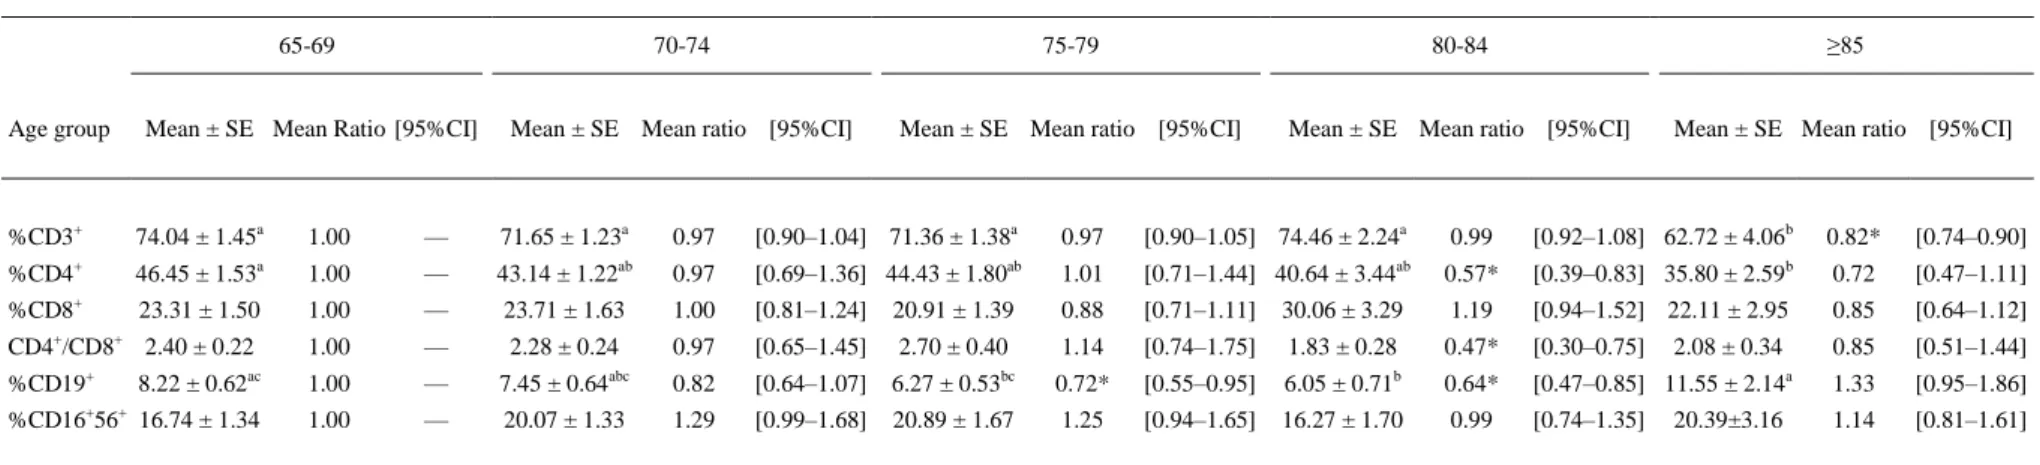
(7) Table 5. Effect of Age on Lymphocyte Subsets. Age group. 65-69. 70-74. 75-79. 80-84. ≥85. Mean ± SE Mean Ratio [95%CI]. Mean ± SE Mean ratio [95%CI]. Mean ± SE Mean ratio [95%CI]. Mean ± SE Mean ratio [95%CI]. Mean ± SE Mean ratio [95%CI]. %CD3+. 74.04 ± 1.45a. 1.00. —. 71.65 ± 1.23a. +. a. 46.45 ± 1.53. 1.00. —. ab. %CD8+. 23.31 ± 1.50. 1.00. CD4+/CD8+ 2.40 ± 0.22 %CD19+. 0.97. [0.90–1.04] 71.36 ± 1.38a. 43.14 ± 1.22. 0.97. ab. —. 23.71 ± 1.63. 1.00. —. 8.22 ± 0.62ac. 1.00. %CD16+56+ 16.74 ± 1.34. 1.00. %CD4. 0.97. [0.90–1.05] 74.46 ± 2.24a. [0.69–1.36] 44.43 ± 1.80. 1.01. ab. 0.99. [0.92–1.08] 62.72 ± 4.06b. 0.82*. [0.74–0.90]. [0.71–1.44] 40.64 ± 3.44. 0.57*. [0.39–0.83] 35.80 ± 2.59b. 0.72. 1.00. [0.81–1.24]. 20.91 ± 1.39. [0.47–1.11]. 0.88. [0.71–1.11]. 30.06 ± 3.29. 1.19. [0.94–1.52] 22.11 ± 2.95. 0.85. 2.28 ± 0.24. 0.97. [0.65–1.45]. [0.64–1.12]. 2.70 ± 0.40. 1.14. [0.74–1.75]. 1.83 ± 0.28. 0.47*. [0.30–0.75]. 0.85. —. 7.45 ± 0.64abc. 0.82. [0.51–1.44]. [0.64–1.07]. 6.27 ± 0.53bc. 0.72*. [0.55–0.95]. 6.05 ± 0.71b. 0.64*. [0.47–0.85] 11.55 ± 2.14a. 1.33. —. 20.07 ± 1.33. 1.29. [0.95–1.86]. [0.99–1.68]. 20.89 ± 1.67. 1.25. [0.94–1.65]. 16.27 ± 1.70. 0.99. [0.74–1.35]. 1.14. [0.81–1.61]. 2.08 ± 0.34 20.39±3.16. Note.CI: confidence interval, SE: mean standard error. Means with different superscript letters represent significantly different groups: a ≠ b ≠ c, p < .05 (univariate statistics). Asterisk, significant at p < .05.
(8) Table 6. Effect of Gender on Lymphocyte Subsets Females. Males. Gender. Mean ± SE. Mean ratio. [95%CI]. Mean ± SE. Mean ratio. [95%CI]. %CD3+. 72.24 ± 0.92. 1.00. —. 70.72 ± 1.72. 0.97. [0.90–1.03]. %CD4+. 43.90 ± 1.13. 1.00. —. 41.56 ± 1.60. 0.81. [0.59–1.10]. +. 23.50 ± 1.16. 1.00. —. 24.55 ± 1.53. 1.14. [0.94–1.38]. CD4+/CD8+. 2.42 ± 0.18. 1.00. —. 2.11 ± 0.19. 0.71. [0.49–1.03]. %CD19+. 8.07 ± 0.43. 1.00. —. 6.82 ± 0.74. 0.71*. [0.56–0.90]. %CD16+56+. 18.04 ± 0.90. 1.00. —. 20.06 ± 1.37. 1.16. [0.91–1.48]. %CD8. Note. CI: confidence interval, SE: mean standard error. Asterisk indicates significant at p < .05. Table 7. Effect of Smoking Habits on Lymphocyte Subsets Nonsmoker Smoking. Smoker. Mean ± SE Mean ratio [95%CI]. Mean±SE Mean ratio. Ex-smoker [95%CI]. Mean±SE Mean ratio. [95%CI]. %CD3+. 71.62 ± 0.91. 1.00. —. 74.68 ± 5.72. 1.10. [0.95–1.28]. 71.47 ± 2.21. 1.02. [0.95–1.09]. %CD4+. 42.84 ± 1.04. 1.00. —. 40.30 ± 6.05. 1.34. [0.66–2.69]. 44.22 ± 2.18. 1.28. [0.92–1.77]. %CD8+. 23.60 ± 1.06. 1.00. —. 30.28 ± 6.20. 1.28. [0.82–1.99]. 23.81 ± 1.95. 1.01. [0.82–1.25]. CD4 /CD8. 2.35 ± 0.16. 1.00. —. 1.57 ± 0.39. 1.05. [0.45–2.41]. 2.29 ± 0.25. 1.26. [0.85–1.87]. %CD19+. 7.54 ± 0.39. 1.00. —. 6.24 ± 0.66. 1.12. [0.65–1.93]. 8.11 ± 1.13. 1.10. [0.85–1.41]. —. 16.05 ± 4.75. [0.37–1.12]. 19.04 ± 1.64. 0.97. [0.75–1.25]. +. +. %CD16+56+. 18.82 ± 0.87. 1.00. 0.65. Note. CI: confidence interval, SE: mean standard error.. Table 8. Effect of Physical Activity on Lymphocyte Subsets ≥3,350 kcal/wk. <3,350 kcal/wk Physical activity. Mean ±SE. Mean ratio. [95%CI]. Mean ± SE. Mean ratio. [95%CI]. %CD3+. 71.46 ± 1.14. 1.00. —. 71.92 ± 1.27. 0.99. [0.95–1.05]. %CD4+. 42.51 ± 1.26. 1.00. —. 43.59 ± 1.36. 0.97. [0.76–1.24]. %CD8+. 24.99 ± 1.44. 1.00. —. 22.80 ± 1.16. 0.93. [0.79–1.09]. CD4+/CD8+. 2.28 ± 0.21. 1.00. —. 2.34 ± 0.16. 1.04. [0.78–1.40]. %CD19+. 7.70 ± 0.48. 1.00. —. 7.54 ± 0.60. 0.96. [0.79–1.16]. %CD16+56+. 19.19 ± 1.10. 1.00. —. 18.36 ± 1.05. 0.96. [0.79–1.16]. Note. CI: confidence interval, SE: mean standard error..
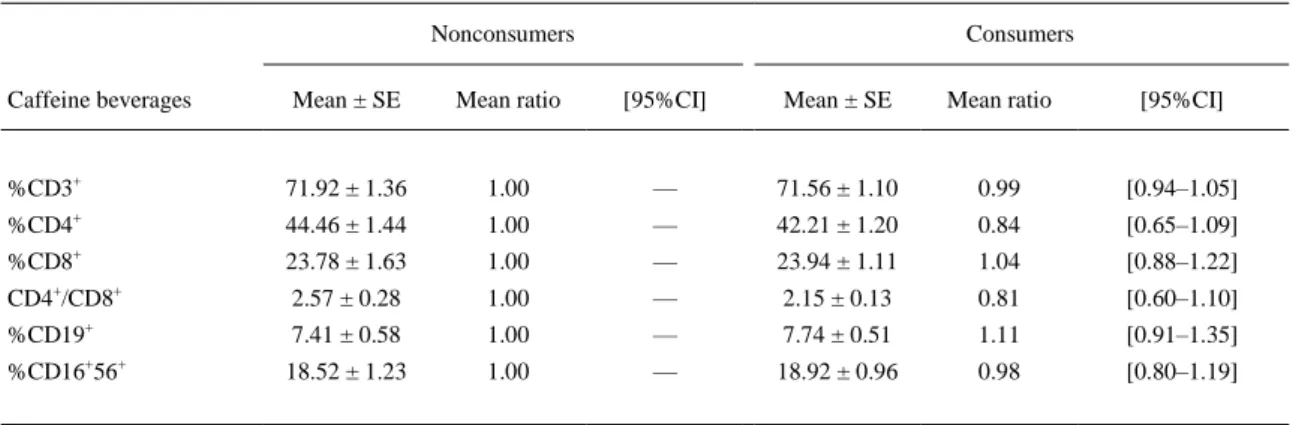
(9) Table 9. Effect of Alcohol Consumption on Lymphocyte Subsets Nonconsumers. Consumers. Alcohol. Mean ± SE. Mean ratio. [95%CI]. Mean ± SE. Mean ratio. [95%CI]. %CD3+. 72.35 ± 1.21. 1.00. —. 71.01 ± 1.20. 0.97. [0.92–1.03]. %CD4+. 41.99 ± 1.26. 1.00. —. 44.18 ± 1.36. 1.10. [0.85–1.42]. %CD8+. 25.28 ± 1.39. 1.00. —. 22.40 ± 1.18. 0.86. [0.73–1.01]. CD4+/CD8+. 2.12 ± 0.15. 1.00. —. 2.51 ± 0.22. 1.28. [0.94–1.74]. %CD19+. 7.57 ± 0.46. 1.00. —. 7.67 ± 0.63. 1.08. [0.88–1.32]. %CD16+56+. 17.79 ± 1.14. 1.00. —. 19.80 ± 0.98. 1.17. [0.96–1.43]. Note. CI: confidence interval, SE: mean standard error.. Table 10. Effect of Caffeine Beverages Consumption on Lymphocyte Subsets Nonconsumers. Consumers. Caffeine beverages. Mean ± SE. Mean ratio. [95%CI]. Mean ± SE. Mean ratio. [95%CI]. %CD3+. 71.92 ± 1.36. 1.00. —. 71.56 ± 1.10. 0.99. [0.94–1.05]. %CD4+. 44.46 ± 1.44. 1.00. —. 42.21 ± 1.20. 0.84. [0.65–1.09]. %CD8+. 23.78 ± 1.63. 1.00. —. 23.94 ± 1.11. 1.04. [0.88–1.22]. CD4+/CD8+. 2.57 ± 0.28. 1.00. —. 2.15 ± 0.13. 0.81. [0.60–1.10]. %CD19+. 7.41 ± 0.58. 1.00. —. 7.74 ± 0.51. 1.11. [0.91–1.35]. 18.52 ± 1.23. 1.00. —. 18.92 ± 0.96. 0.98. [0.80–1.19]. +. %CD16 56. +. Note. CI: confidence interval, SE: mean standard error.. No significant differences were observed for any of the parameters analyzed between nonfrail and prefrail subjects, regardless of the number of positive frailty items (1 or 2; Table 4). Among prefrail individuals positive for one frailty item, the great majority (n = 74 out of 79, 94%) were positive for the item indicative of muscle weakness. Similarly, all individuals positive for two frailty items (n = 28) were positive for the grip strength item, and also for slow walk (n = 19), self-reported exhaustion (n = 8), or unintentional weight loss (n = 1). As presented in Table 5, age presented influence on %CD3+, %CD4+, and %CD19+ cell subpopulations. A significant decrease in %CD3 + lymphocytes was found only in the group of individuals aged ≤85 years. Progressive decline with age was observed in %CD4 + cells, more pronounced from 80 years old and higher, and significant for individuals aged 80–84 years. Indeed, inverse and significant correlations were obtained between age and these two parameters (r = –0.229, p < .01 for %CD3+ and r = –0.292, p < .01 for %CD4+). In addition, a significant reduction in CD4 +/CD8+ ratio was detected in the group 80–84 years old. The levels of %CD19+ lymphocytes also diminished progressively with age. The reduction was significant in the groups of 75–79 years and 80- to 84-year-old subjects. However, the group of individuals aged ≤85 years showed a recovery in %CD19 + cells, and levels were not markedly different from lower age group levels. %CD19 + was the only lymphocyte subset found to be influenced by gender (Table 6), showing a significant fall in males. CD4+/CD8+ ratio was numerically higher in females than males, but not significant. With respect to alcohol consumption (Table 9), no significant change in %CD8+ was found in alcohol consumers compared to nonconsumers. As shown in Tables 7, 8, and 10, no marked differences were observed for any lymphocyte subset according to smoking habits (either establishing nonsmokers, smokers, and ex-smokers as separate categories or comparing nonsmokers with ever-smokers, i.e., by.
(10) merging smokers and ex-smokers in the same category [data not shown]), physical activity or caffeine beverages consumption. Discussion The objective of this investigation was to establish reference value ranges of lymphocyte subsets in the nonfrail elderly and assess the influence of age on these immunological parameters. In addition, this study aimed to determine the effect of other possible physiological or lifestyle factors (namely, gender, smoking habits, physical activity, and alcohol and caffeine beverages consumption) on these variables. Given the advanced age of the study subjects, most of them consumed some drugs (Table 2). Although the number of positive frailty items was parallel to the rate of medicated individuals for all drug groups, drugs for the cardiovascular system, along with those for the alimentary tract and metabolism and anti-infectives for systemic use, were the most representative in both nonfrail and prefrail individuals. Frailty was described as a major consequence of sarcopenia, the age-related loss in muscle mass and strength (Roubenoff, 2000). At the clinical level, assessment of muscle mass and function has emerged as a possible biomarker for aging (Fisher, 2004), and sarcopenia was also reported to be associated with telomere shortening (Marzetti et al., 2014), another indicator of biological aging (Fossel, 2012). Muscle weakness was present in almost all our prefrail individuals; accordingly, their consumption of drugs for the musculoskeletal system was notably higher than in nonfrail individuals. The same occurred for drugs for the nervous system; among them, the most notable subgroups being analgesics (consumed by 17.8% of prefrail—one item subjects and by 39.3% of prefrail—two items subjects), anxiolytics (29.1 and 35.7%, respectively), and antidepressants (19 and 28.6%, respectively). Indeed, associations between frailty and sleep disturbances (Ensrud et al., 2012) or depression (Mezuk et al., 2012) were noted. It is possible that drug consumption may have influenced the results in the current study in some manner, but establishing these reference value ranges in the elderly is inevitably linked to medication use, and therefore our results are expected to be representative for the general elderly population. The distributions of lymphocyte subsets found in this study (Table 3) were quite different from those described by Vasson et al. (2013) for a Spanish population (range of differences between means from 6.3% for %CD3+ lymphocytes to 74.5% for %CD19+ lymphocytes). These differences are probably related to the broader age range of the participants in that study (20–75 years), and also to the fact that it was restricted to men. To our knowledge, this is the first lymphocyte subpopulation study focused on the elderly sector of the population that takes into account their status regarding absence of frailty. Less pronounced differences were observed when our results were compared with values from other adult Spanish populations, although in general our population levels were usually lower (García-Dabrio et al., 2012, age range 16–88 years; Andreu-Ballester et al., 2012, age range 18–95 years). Elderly subjects positive for one or two frailty items, classified as prefrail according to Fried et al. (2001), were not markedly different from nonfrail elderly individuals according to lymphocyte subsets analyzed (Table 4); hence, the presence of muscle weakness or slow walking does not appear to produce alterations in these immunological variables. Data suggest that nonfrail and prefrail individuals may be classified jointly in studies addressing immunological parameters in elderly people. The immune functions decline with increasing age. This phenomenon is known as immunosenescence, and is partially responsible for increased prevalence and severity of infectious diseases, increased autoimmunity, and low efficacy of vaccination in elderly persons (Mahbub et al., 2011). It should be noted that elderly subjects spend 80–90% of their time indoors and predominantly at elder care centers (Viegas et al., 2014). Further, the potential for exposure to fungal and indoor air contaminants is enhanced in elder care centers (Mendes et al., 2013; Viegas et al., 2014). Thus increased exposure potential to pollutants and diminished ability to cope due to lack of immunocompetence indicates that the elderly subpopulation is at higher risk for adverse effects. Immunosenescence affects both adaptive (T and B lymphocytes) and innate (monocytes, NK cells, and dendritic cells) systems. However, the more severe age-related changes occur in the adaptive system and higher exposure potential to contaminants is a cause for concern. The innate system is apparently better preserved during the aging process (Weiskopf et al., 2009). Maturation of T lymphocytes occurs in the thymus. One of the most remarkable changes in immunosenescence is the involution of the thymus, and consequently a decrease in the proportion of T lymphocytes with age (Chinn et al., 2012; Goronzy and Weyand, 2005). Moreover the aging process in T lymphocytes may be accelerated by several factors, including repeated exposure to antigens, environmental chemicals, and pathogens like cytomegalovirus (CMV), herpes viruses, or polyomaviruses (Weiskopf et al., 2009)..
(11) In the current study, the percentage of total T lymphocytes (%CD3 +) remained stable in subjects aged between 65 and 84 years, and a significant decrease was observed in the eldest group (≥85 years) (Table 5). In addition, %CD4+ lymphocytes experienced a progressive fall with age, more notable in the two eldest categories, and significance was obtained for the group 80–84 years old. Consequently, and despite no marked differences observed in %CD8+ cells, CD4+/CD8+ ratio also diminished significantly in the same group. Similar data were reported by Andreu-Ballester et al. (2012) and Bisset et al. (2004). However, other studies found opposite results. García-Dabrio et al. (2012) observed an age-related increase of %CD4+ cells, while Jentsch-Ullrich et al. (2005) noted an age-related reduction in %CD8+. No marked differences linked to age for any lymphocyte subset were observed by Santagostino et al. (1999). The wider age ranges and younger study populations analyzed in these studies may account for differences compared to our results. B-lymphocytes maturation occurs in the bone marrow. The aging process initiates changes within the bone marrow, leading to a defective production of B-lymphocyte progenitors (Chinn et al., 2012; Pritz et al., 2014). In addition, B-cell functions experience age-related alterations and, consequently, specificity and class of antibodies produced change with age. This entails a rise in susceptibility to infectious diseases and reduces the effectiveness of vaccination in the elderly (Frasca et al., 2011. Further, the proportions of mature human B lymphocytes significantly decrease with age (Frasca et al., 2011. Accordingly, the current results showed a progressive decline with age in the levels of %CD19+ lymphocytes, reaching significance in the groups 75–79 and 80–84 years old (Table 5). These findings are in agreement with the results of Jentsch-Ullrich et al. (2005) in a German population, and García-Dabrio et al. (2012) and Vasson et al. (2013) in Spanish populations. Nevertheless, these later investigators did not find a change in subjects from France or Austria. They suggest that the Mediterranean diet (more frequent in Spain) may play a role in these results, and in the marked age-linked increase in percent of NK cells in the Spanish population, discussed in the following. NK cells are cytotoxic cells that play a crucial role as modulators of tumor, viral, and microbial immunogenicity (Mahbub et al., 2011). Aging is related to NK-cell alterations, both functional and phenotypically. NK senescent cells seem to present a defective functional capacity with advanced age that is partially compensated by elevating the number of mature NK cells. High levels of NK cells are associated with high NK cytotoxicity, and therefore an age-related increased proportion of NK cells is related to healthy aging and longevity (Weiskopf et al., 2009). Previous studies found age-related rise in %CD16+56+ in healthy volunteers, particularly for those aged over 50 (Jentsch-Ullrich et al., 2005) or over 60 (Vasson et al., 2013). Percentages of NK cells did not change markedly with age in our study. All individuals analyzed were over 64 years (until 95) and supposed to display healthy aging, since they were not frail. Hence, stability found in NK cell levels with age suggests that the increase in proportion of these cells may already have occurred some time ago. It is known that males and females deal differently with infections, and the prevalence of autoimmune diseases is different between genders. This is in part due to dissimilarities in the immune systems of men and women, since females produce more robust humoral and cellular immune responses than males. However, the reason for the gender-related differences in immunosenescence still requires investigation (Yan et al., 2010). Previous studies demonstrated differences between genders in percentages of immune cell subtypes (Jentsch-Ullrich et al., 2005; Yan et al. 2010). In our study, females showed a significantly higher %CD19+ cells (Table 6). These results are consistent with those of Abdullah et al. (2012), who similarly noted a higher percentage of B lymphocytes in females. No significant gender-related differences were found in the present study for T lymphocytes or NK cells, similar to previous studies (Shokouhi Shoormasti et al., 2011; Valiathan et al., 2014). Nevertheless, significantly higher %CD3+ and CD4+ cells and a lower % NK cells in women were also reported in Spanish (Andreu-Ballester et al., 2012; GarcíaDabrio et al., 2012) and Italian (Santagostino et al., 1999) populations. Since only elderly individuals were examined in this investigation, our results suggest that gender differences detected in other studies decrease with age; indeed, female values obtained for %CD3 + and %CD4+ lymphocytes were numerically higher than in males, and for %CD16+56+ cells were numerically lower, but significance was not reached. The influence of smoking, physical activity, and alcohol and caffeine beverage consumption on lymphocyte subsets was also studied, but none of these factors demonstrated a significant effect. Previous studies found alterations in levels of different lymphocyte subsets in smokers compared to nonsmokers (Andreoli et al., 2014; García-Dabrio et al., 2012; Jubri et al., 2013; Santagostino et al., 1999). Touil et al. (2012) also reported no marked influence of smoking. The relevance of our negative results regarding smoking factor (Table 7) is only marginal, due to the small group of smokers analyzed (n = 5). Moreover, the number of ex-smokers was not high either (n = 32), and they ceased to smoke a minimum of 6 years ago, such that their physiological status resembles nonsmokers rather than smokers..
(12) Acute physical exercise was reported to produce transient variations in some lymphocyte subsets (Ceddia et al., 1999). Specifically, increases in CD8+ and CD4+ T cells were observed immediately post exercise (modified Balke maximal exercise treadmill test), but 20 min later only CD8 + cell level was still elevated. Long-term (2 years) moderate physical activity did not produce changes in the distribution of lymphocyte subpopulations in elderly women (62–86 years old) compared to a sedentary control group (Drela et al., 2004). Our negative results support these latter studies, since physical activity estimated referred to a regular month or week (from the Spanish validation of Minnesota Leisure Time Activity [MLTA] questionnaire [Ruiz Comellas et al., 2012]), and thus can be considered long-term. Drela et al. (2004) also observed a higher percentage of lymphocytes expressing intracellular interleukin 2, an important regulator of immune response, in the group of women attending the physical activity program, indicating that physical activity-mediated amelioration of immunosenescence occurs by mechanisms different from alterations in immune cell subpopulations. Regarding alcohol consumption, Matos et al. (2013) reported significantly lower percentages of T lymphocytes—both helper and cytotoxic—and B lymphocytes, but not NK cells, in patients with alcoholic liver disease compared to control cases. In the current study no marked differences between alcohol consumers and nonconsumers were observed in the proportions of lymphocyte subsets, except for a nonsignificant numerical decrease in %CD8 + cells. Still, consumption of alcoholic beverages by the study individuals was moderate: 59% of alcohol drinkers consumed 7 measures/week, and maximal reported was 14 measures/week (11%); wine was the preferred alcoholic beverage in nearly all cases (92%). To our knowledge, no apparent studies were found thus far on the effect of moderate alcohol consumption on lymphocyte subsets distribution in relatively healthy elderly individuals. Caffeine, a member of the methylxanthine family of drugs, is probably the behaviorally active substance most widely consumed in the Western countries due to its presence in common drinks like coffee, tea, and some soft drinks. Caffeine is known to modulate both innate and adaptive immune responses (Horrigan et al., 2006). Bishop et al. (2005) found significantly higher levels of %CD4 + and %CD8+ activated lymphocytes (expressing the CD69 surface antigen) 1 h postadministration in individuals at rest administered caffeine (6 mg/kg body mass) compared to placebo. In contrast, Fletcher and Bishop (2012) did not observe any marked differences in total count of CD4 + and CD8+ cells in individuals who ingested the same quantity of caffeine compared to the group administered placebo. Caffeine-related differences were also not found in lymphocyte subsets in our study. However, the Bishop et al. (2005) and Fletcher and Bishop (2012) studies were carried out with endurance-trained young males (less than 30 years old in both cases), a population clearly different from the current study population. Assuming that a cup of coffee (espresso, 1 fl oz) contains approximately 40 mg caffeine (Heckman et al., 2010) and considering a mean body weight of 75 kg for males, individuals in the studies already mentioned were given a single caffeine dose equivalent to 11 cups of coffee. In contrast, the current study subjects using caffeine beverages were just moderate consumers (29% consumed 1 cup/day, 21% 2 cups/day, 8% 3 cups/day, and only 6% consumed more than 3 cups/day). In conclusion, reference values for percent lymphocyte subsets in a population of nonfrail elderly individuals (65–95 years old) from Galicia (in northwestern Spain) were obtained. Our results illustrated how gender and age influence proportions of several peripheral blood lymphocyte subpopulations. No significant influence of the number of positive frailty items or of other lifestyle factors (smoking habits, physical activity, and alcohol and caffeine beverages consumption) was observed. The results obtained might serve as a basis to establish comparisons between frail and nonfrail elder individuals in future studies, in order to determine the usefulness of lymphocyte subsets as immunological biomarkers of frailty. Funding The authors sincerely thank all the volunteers who participated in this study. Vanessa Valdiglesias and María Sánchez-Flores contributed equally to this work. Research funded by Fundació Agrupació and Fundación Mapfre. Notes a. Mean ± SD (range). Calculated according to Minnesota Leisure Time Activity (MLTA) questionnaire (Spanish validation by Ruiz Comellas et al., 2012). Note. SE: mean standard error. Note. CI: confidence interval, SE: mean standard error. b.
(13) Note. CI: confidence interval, SE: mean standard error. Means with different superscript letters represent significantly different groups: a ≠ b ≠ c, p < .05 (univariate statistics). Asterisk, significant at p < .05. Note. CI: confidence interval, SE: mean standard error. Asterisk indicates significant at p < .05. Note. CI: confidence interval, SE: mean standard error. Note. CI: confidence interval, SE: mean standard error. Note. CI: confidence interval, SE: mean standard error. Note. CI: confidence interval, SE: mean standard error. References 1. Abdullah, M., Chai, P. S., Chong, M. Y., Tohit, E. R., Ramasamy, R., Pei, C. P., and Vidyadaran, S. 2012. Gender effect on in vitro lymphocyte subset levels of healthy individuals. Cell Immunol. 272: 214–219. 2. Al-Mawali, A., Pinto, A.D., Al Busaidi, R., and Al-Zakwani, I. 2013. Lymphocyte subsets: Reference ranges in an age- and gender-balanced population of Omani healthy adults. Cytometry A 83A: 739–744. 3. Andreoli, C., Bassi, A., Gregg, E.O., Nunziata, A., Puntoni, R., and Corsini, E. 2014. Effects of cigarette smoking on circulating leukocytes and plasma cytokines in monozygotic twins. Clin. Chem. Lab. Med. 53: 57–64. 4. Andreu-Ballester, J.C., García-Ballesteros, C., Benet-Campos, C., Amigó, V., Almela-Quilis, A., Mayans, J., and Ballester, F. 2012. Values for ab and cd T-Lymphocytes and CD41, CD81, and CD561 subsets in healthy adult subjects: assessment by age and gender. Cytometry B Clin. Cytom. 82: 238–244. 5. Bishop, N. C., Fitzgerald, C., Porter, P. J., Scanlon, G. A., and Smith, A. C. 2005. Effect of caffeine ingestion on lymphocyte counts and subset activation in vivo following strenuous cycling. Eur. J. Appl. Physiol. 93: 606–613 6. Bisset, L. R., Lung, T. L., Kaelin, M., Ludwig, E., and Dubs, R. W. 2004. Reference values for peripheral blood lymphocyte phenotypes applicable to the healthy adult population in Switzerland. Eur. J. Haematol. 72: 203–212. 7. Bortz, W. M. 2nd. 2002. A conceptual framework of frailty: A review. J. Gerontol. A Biol. Sci. Med. Sci. 57: M283–M288. 8. Bouillon, K., Kivimaki, M., Hamer, M., Sabia, S., Fransson, E. I., Singh-Manoux, A., Gale, C. R., and Batty, G. D. 2013. Measures of frailty in population-based studies: An overview. BMC Geriatr. 13: 64. 9. Ceddia, M. A., Price, E. A., Kohlmeier, C. K., Evans, J. K., Lu, Q., McAuley, E., and Woods, J. A. 1999. Differential leukocytosis and lymphocyte mitogenic response to acute maximal exercise in the young and old. Med. Sci. Sports Exercise 31: 829–836. 10. Chinn, I. K., Blackburn, C. C., Manley, N. R., and Sempowski, G. D. 2012. Changes in primary lymphoid organs with aging. Semin. Immunol. 24: 309–320. 11. Collerton, J., Martin-Ruiz, C., Davies, K., Hilkens, C. M., Isaacs, J., Kolenda, C., Parker, C., Dunn, M., Catt, M., Jagger, C., von Zglinicki, T., and Kirkwood, T. B. L. 2012. Frailty and the role of inflammation, immunosenescence and cellular ageing in the very old: Cross-sectional findings from the Newcastle 85+ Study. Mech. Ageing Dev. 133: 456–466. 12. Drela, N., Kozdron, E., and Szczypiorski, P. 2004. Moderate exercise may attenuate some aspects of immunosenescence. BMC Geriatr. 4: 8. 13. Ensrud, K. E., Blackwell, T. L., Ancoli-Israel, S., Redline, S., Cawthon, P. M., Paudel, M. L., Dam, T.-T. L., and Stone, K. L. 2012. Sleep disturbances and risk of frailty and mortality in older men. Sleep Med. 13: 1217–1225. 14. Ensrud, K. E., Ewing, S. K., Cawthon, P. M., Fink, H. A., Taylor, B. C., Cauley, J. A., Dam, T. T., Marshall, L. M., Orwoll, E. S., Cummings, S. R., and Osteoporotic Fractures in Men Research Group. 2009. A comparison of frailty indexes for the prediction of falls, disability, fractures, and mortality in older men. J. Am. Geriatr. Soc. 57: 492–498. 15. Fisher, A. L. 2004. Of worms and women: Sarcopenia and its role in disability and mortality. J. Am. Geriatr. Soc. 52: 1185–1190. 16. Fletcher, D. K., and Bishop, N. C. 2012. Caffeine ingestion and antigen-stimulated human lymphocyte activation after prolonged cycling. Scand. J. Med. Sci. Sports 22: 249–258 17. Fossel, M. 2012. Use of telomere length as a biomarker for aging and age-related disease. Curr. Transl. Geriatr. Exp. Gerontol. Rep. 1: 121–127. 18. Frasca, D., Diaz, A., Romero, M., Landin, A. M., and Blomberg, B. B. 2011. Age effects on B cells and humoral immunity in humans. Ageing Res. Rev. 10: 330–335. 19. Fried, L. P., Tangen, C. M., Walston, J., Newman, A. B., Hirsch, C., Gottdiener, J., Seeman, T., Tracy, R., Kop, W. J., Burke, G., and McBurnie, M. A. 2001. Frailty in older adults: Evidence for a phenotype. J. Gerontol. A Biol. Sci. Med. Sci. 56: M146–M156 20. García-Dabrio, M. C., Pujol-Moix, N., Martinez-Perez, A., Fontcuberta, J., Souto, J. C., Soria, J. M., and Nomdedéu, J. F. 2012. Influence of age, gender and lifestyle in lymphocyte subsets: Report from the Spanish Gait-2 Study. Acta Haematol. 127: 244–249. 21. Goronzy, J. J., and Weyand, C. M. 2005. T cell development and receptor diversity during aging. Curr. Opin. Immunol. 17: 468–475. 22. Heckman, M. A., Weil, J., and Gonzalez de Mejia, E. 2010. Caffeine (3,3,7-trimethylxanthine) in foods: A comprehensive review on consumption, functionality, safety and regulatory matters. J. Food Sci. 75: R77–R87 23. Horrigan, L. A., Kelly, J. P., and Connor, T. J. 2006. Immunomodulatory effects of caffeine: Friend or foe? Pharmacol. Ther. 111: 877–892.
(14) 24. Jentsch-Ullrich, K., Koenigsmann, M., Mohren, M., and Franke, A. 2005. Lymphocyte subsets’ reference ranges in an age- and gender-balanced population of 100 healthy adults—A monocentric German study. Clin. Immunol. 116: 192–197. 25. Jubri, Z., Latif, A. A., Top, A. G., and Ngah, W. Z. 2013. Perturbation of cellular immune functions in cigarette smokers and protection by palm oil vitamin E supplementation. Nutr. J. 12: 2. 26. Mahbub, S., Brubaker, A. L., and Kovacs, E. J. 2011. Aging of the innate immune system: An update. Curr. Immunol. Rev. 7: 104–115. 27. Marzetti, E., Lorenzi, M., Antocicco, M., Bonassi, S., Celi, M., Mastropaolo, S., Settanni, S., Valdiglesias, V., Landi, F., Bernabei, R., and Onder, G. 2014. Shorter telomeres in peripheral blood mononuclear cells from older persons with sarcopenia: Results from an exploratory study. Front. Aging Neurosci. 6: 233. 28. Matos, L. C., Batista, P., Monteiro, N., Ribeiro, J., Cipriano, M. A., Henriques, P., Girão, F., and Carvalho, A. 2013. Lymphocyte subsets in alcoholic liver disease. World J. Hepatol. 5: 46–55. 29. Mendes, A., Pereira, C., Mendes, D., Aguiar, L., Neves, P., Silva, S., Batternman, S., and Teixeira, J. P. 2013. Indoor air quality and thermal comfort-Results of a pilot study in elderly care centers in Portugal. J. Toxicol. Environ. Health A 76: 333–344. 30. Mezuk, B., Edwards, L., Lohman, M., Choi, M., and Lapane, K. 2012. Depression and frailty in later life: A synthetic review. Int. J. Geriatr. Psychiatry 27: 879–892 31. Morley, J. E., Vellas, B., van Kan, G. A., Anker, S. D., Bauer, J. M., Bernabei, R., Cesari, M., Chumlea, W. C., Doehner, W., Evans, J., Fried, L. P., Guralnik, J. M., Katz, P. R., Malmstrom, T. K., McCarter, R. J., Gutierrez Robledo, L. M., Rockwood, K., von Haehling, S., Vandewoude, M. F., and Walston, J. 2013. Frailty consensus: A call to action. J. Am. Med. Dir. Assoc. 14: 392–397. 32. Pathai, S., Shiels, P. G., Weiss, H. A., Gilbert, C. E., Peto, T., Bekker, L.-G., Wood, R., Wong, T. Y., and Lawn, S. D. 2013. Ocular parameters of biological ageing in HIV-infected individuals in South Africa: Relationship with chronological age and systemic biomarkers of ageing. Mech. Ageing Dev. 134: 400–406. 33. Pizza, V., Agresta, A., D’ Acunto, C. W., Festa, M., and Capasso, A. 2011. Neuroinflammation and ageing: Current theories and an overview of the data. Rev. Recent Clin. Trials 6: 189–203 34. Pritz, T., Weinberger, B., and Grubeck-Loebenstein, B. 2014. The aging bone marrow and its impact on immune responses in old age. Immunol. Lett. 162: 310–315. 35. Rockwood, K., Andrew, M., and Mitnitski, A. 2007. A comparison of two approaches to measuring frailty in elderly people. J. Gerontol. A Biol. Sci. Med. Sci. 62: 738–743 36. Roubenoff, R. 2000. Sarcopenia: A major modifiable cause of frailty in the elderly. J. Nutr. Health Aging 4: 140– 142. 37. Ruiz Comellas, A., Pera, G., Baena Díez, J. M., Mundet Tudurí, X., Alzamora Sas, T., Elosua, R., Torán Monserrat, P., Heras, A., Forés Raurell, R., Fusté Gamisans, M., and Fàbrega Camprubí, M. 2012. Validation of a Spanish Short Version of the Minnesota Leisure Time Physical Activity Questionnaire (VREM). Rev. Esp. Salud Publica. 86: 495–508. 38. Santagostino, A., Garbaccio, G., Pistorio, A., Bolis, V., Camisasca, G., Pagliaro, P., and Girotto, M. 1999. An Italian national multicenter study for the definition of reference ranges for normal values of peripheral blood lymphocyte subsets in healthy adults. Haematologica. 84: 499–504. 39. Shamliyan, T., Talley, K. M. C., Ramakrishnana, R., and Kanea, R. L. 2013. Association of frailty with survival: A systematic literature review. Ageing Res. Rev. 12: 719–736. 40. Shokouhi Shoormasti, R., Azimdoost, A., Saghafi, S., Movahhedi, M., Haghi Ashtiani, M. T., Pourpak, Z., and Eslami, M. B. 2011. Normal range determination of lymphocytes subsets in normal adults in Iran. Iran J. Allergy Asthma Immunol. 10: 295–298. 41. Touil, N., Hadef, R., Lemnouer, A., Zrara, A., Sbai, A. I., Belfquih, B., Mrani, S., Benkirane, A., Ouaaline, M., and Mrabet, M. 2012. Range-reference determination of lymphocyte subsets in Moroccan blood donors. Afr. Health Sci. 12: 334–338. 42. Topinková, E. 2008. Aging, disability and frailty. Ann. Nutr. Metab. 52(suppl. 1): 6–11. 43. Vasson, M.-P., Farges, M.-C., Goncalves-Mendes, N., Talvas, J., Ribalta, J., Winklhofer-Roob, B., Rock, E., and Rossary, A. 2013. Does aging affect the immune status? A comparative analysis in 300 healthy volunteers from France, Austria and Spain. Immun. Ageing 10: 38. 44. Weiskopf, D., Weinberger, B., and Grubeck-Loebenstein, B. 2009. The aging of the immune system. Transpl. Int. 22: 1041–1050. 45. United Nations. 2013. World population ageing 2013. Department of Economic and Social Affairs. Population Division. New York, NY: United Nations. 46. Valiathan, R., Deeb, K., Diamante, M., Ashman, M., Sachdeva, N., and Asthana, D. 2014. Reference ranges of lymphocyte subsets in healthy adults and adolescents with special mention of T cell maturation subsets in adults of South Florida. Immunobiology. 219: 487–496. 47. Viegas, C., Almeida-Silva, M., Gomes, A. Q., Wolterbeek, H. T., and Almeida, S. M. 2014. Fungal contamination assessment in Portugese elderly care centers. J. Toxicol. Environ. Health A 77: 14–23. 48. WHO Collaborating Center for Drug Statistics Methodology. 2013. Guidelines for ATC classification and DDD assignment 2013. Oslo, Norway: WHO Collaborating Centre for Drug Statistics Methodology. 49. Yan, J., Greer, J. M., Hull, R., O’Sullivan, J. D., Henderson, R. D., Read, S. J., and McCombe, P. A. 2010. The effect of ageing on human lymphocyte subsets: Comparison of males and females. Immun. Ageing 7: 4.
(15)
Figure


+3

Documento similar
That is to say, in the context of perfect information about the future, the Frischian demands describe the consumption behaviour of individuals in terms of the current prices and
The synthesis of the results obtained in the aggregate analysis of the consumption of seabream and seabass in the Mediterranean countries of the European Union shows that consumption
This doctoral thesis aims to clarify the effect of habitual coffee consumption on the development of functional limitations, frailty and disability, as well as its effect on the
Participants were asked about their alcohol consumption, their perception of risk regarding their pattern of alcohol consumption, about their opinion on alcoholism,
Secondly, ha- ving taken into account the different age cohorts establi- shed for the configuration of the focus groups, it has been possible to see how this influence manifests
reliable for predicting the risk of falling or for discriminating between population groups with different age, illness or level of physical activity 17,18. The identification
Significant associations between sexual behaviour and consumption of alcohol and drugs were confirmed in the group of alcohol and drugs users (see Table 8): the number of
The paper mainly focuses on the inherent conflict that, in a period of increased consumption of alcoholic beverages and of increased alcohol related harm, occurs in United
