An assessment of volume ratio functions for Eucalyptus globulus and E nitens in Chile
12
0
0
Texto completo
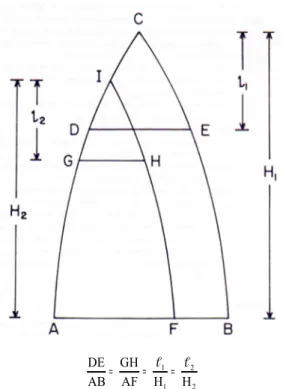
(2) 6. ciencia e investigación agraria. At the level of the tree, there have traditionally been three methodological solutions to solve the problem of products volume estimation (Prodan et al., 1997): (i) functions for the tree volume at different limit diameters; (ii) taper functions (TF); and (iii) volume ratio functions (VRF). The VRFs correspond to a system of equations with two functions operating jointly to estimate the tree product volumes. The system is developed with a traditional volume function (local or general) that estimates the total volume (v) of the tree and a function for the volume ratio (Alemdag, 1988; Amateis et al., 1986; Cao et al., 1980). The volume ratio function estimates the proportion of the total volume (R) that is accumulated at a specific top diameter or commercial height; the coefficients of the volume ratio are generally estimated through regression analysis. The ratio function uses the top diameter or the commercial height, the diameter at 1.3 m, the total tree height, and in some cases the stump height, as the predictor variables. The commercial volume that is then calculated is the product of the proportion factor and the total stem volume (Alemdag, 1988). Equations conforming to VRFs are generally fitted separately and independently using the same set of data (Lynch, 1986); recent approaches also consider autocorrelation among measurements taken from the same tree (Gregoire and Schabenberger, 1996). The development of VFRs is based on analyzing the volumetric content of two trees that are identical in shape and therefore possess proportional dimensions. For each (di/d) or (hi/h) relation there is only one (vi/v) relation (Alemdag, 1988). It is therefore possible to calculate the products volume within a stem using the total volume and the proportion of a certain top stem diameter by using the independent variables that were previously described. The relationship among the diameters and the superior stem heights is proportional when the tree shape is constant. This principle is illustrated in Figure 1, which shows the proportionality among the diameters measured at height (DE and GH) and. basal diameters (AB and AF). This same proportionality is repeated among the distances between the tree apex and the height measurements at the diameters DE and GH (ℓ1 y ℓ2) and the trees heights (H1 and H2).. . . . Figure 1. The relationship among the diameter, area and volume for similar trees (Alemdag, 1988).. VRFs have traditionally not been used in Chile because product estimation in plantation forestry (the most developed forest sector) is conducted using taper functions, which are generally more versatile and flexible than VRFs. In addition, VRFs provide volume estimations for logs with specific lengths and minimum diameters. Despite these characteristics, taper functions also have limitations since they sometimes cause considerable errors in the estimation of stem volumes and they tend to be poor estimates at the extremes of the tree (i.e., the tip and the stump) (Newberry et al., 1985). These functions often yield biased estimates for important attributes such as volume and the diameters at dif-.
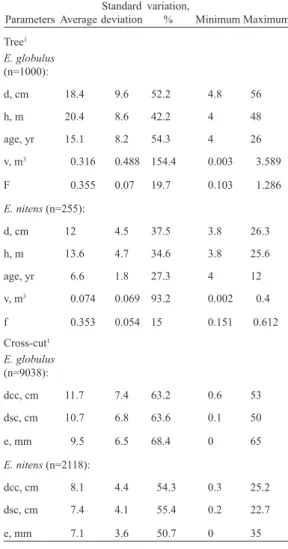
(3) VOLUME 37 Nº1 JANUARY - APRIL 2010. ferent stem sizes since the dependent variable in the regression model for a taper equation is a relative diameter or a relative squared diameter. VRFs are considered an alternative to volume functions that have a series of disadvantages for different top limit diameters (i.e., taper functions). Problems associated with top limit functions include the generation of inconsistencies when estimating the commercial volume at different top diameters, inflexibility in the process and the large number of functions that must be managed. VRFs allow for a different approach to product volume estimation than taper functions do when the relevant volume is defined on a limit diameter basis without establishing restrictions on the log length, such as the stand pulpwood volume. The objective of this work was to propose and validate volume ratio functions (VRF) to estimate tree volumes at different utilization diameters for Eucalyptus species (E. globulus and E. nitens) in Chile, and to compare the estimates of product volumes from these functions with the estimates of the Bruce taper function. Material and methods Nomenclature The following nomenclature is used in this document: d, stem diameter (cm) with bark at 1.3 m of height from the ground; di, stem diameter (cm) without bark, measured at stem height hi; h, total height (m) of the tree; hi, height (m) from the ground where the stem diameter is di; v, total stem volume (m3) without bark, calculated with the function of volume; vi, volume (m3) without bark up to diameter di or height hi; ri, proportion (ratio) of total stem volume (m3) up to a limit diameter of utilization di; bi, regression coefficient; i, sub-index.. 7. Data The data that was used for fitting and validating the models included tree measurements form juvenile and adult stands in Eucalyptus plantations (E. globulus and E. nitens) in the South of Chile. The descriptive statistics of the data from the tree and the cross-cut section levels for both species are shown in Table 1. Table 1. The tree-level and the cross-cut-level data obtained for each Eucalyptus species. Coefficient of Standard variation, Parameters Average deviation % Minimum Maximum Tree1 E. globulus (n=1000): d, cm. 18.4. 9.6. 52.2. 4.8. 56. h, m. 20.4. 8.6. 42.2. 4. 48. age, yr. 15.1. 8.2. 54.3. 4. 26. v, m. 0.316. 0.488 154.4. 0.003. 3.589. F. 0.355. 0.07. 19.7. 0.103. 1.286. 3. E. nitens (n=255): d, cm. 12. 4.5. 37.5. 3.8. 26.3. h, m. 13.6. 4.7. 34.6. 3.8. 25.6. age, yr. 6.6. 1.8. 27.3. 4. 12. v, m. 0.074. 0.069 93.2. 0.002. 0.4. f. 0.353. 0.054 15. 0.151. 0.612. 3. Cross-cut1 E. globulus (n=9038): dcc, cm. 11.7. 7.4. 63.2. 0.6. 53. dsc, cm. 10.7. 6.8. 63.6. 0.1. 50. e, mm. 9.5. 6.5. 68.4. 0. 65. E. nitens (n=2118): dcc, cm. 8.1. 4.4. 54.3. 0.3. 25.2. dsc, cm. 7.4. 4.1. 55.4. 0.2. 22.7. e, mm. 7.1. 3.6. 50.7. 0. 35. d: stem diameter, h: total height, v: volume, f: normal form factor, dcc: the overbark stem diameter in a cross-cut section, dsc: the underbark stem diameter in a cross-cut section, e: double bark thickness in a cross-cut section. 1.
(4) 8. ciencia e investigación agraria. Selection of a volume ratio model The general selection strategy considered the first developmental stage where the total volume and the VRFs were fitted separately by specie. The tested models were extracted from the literature. Once the best function, or functions from each group, was selected, the full estimation system was validated. For example, volumes at different top diameters were estimated with both functions operating together. The following set of functions was fitted in order to select the best model from each group, which was then validated using a ranking system (Prodan et al., 1997; Norambuena and Laroze, 1996; Avery and Burkhart, 1994; Martin, 1992; Amateis et al., 1986):. signed to each model according to its position after the models were sorted; the lowest grade was assigned to the best model and the highest grade was assigned to the worst model based on the interpretation of the individual statistics. For example, the model with the best adjusted coefficient of determination Raj2 (highest) would obtain a grade of 1, the second best model would be given a grade of 2, and so on. This sorting and grading was performed with each model type. The goodness of fit criteria that were used included the adjusted coefficient of determination (R 2aj) and the graphical analysis of the residues that were used to determine heteroscedasticity. The predictive ability criteria included the mean squared error (ECM%) and the mean difference (DIFA%): ∑ (O n. Mean quadratic error:. i =1. ECM % =. The volume ratio models (r) Model 1 r = exp (b0X b1)+ ε Model 2 r = 100+b1X +b2X2+b3X3+b4X4+b5X5+b6X6+ ε Model 3 r = 100+b3X3+b4X4+b5X5+b6X6+ ε Model 4 r = b0+b1X+b2X2h+ ε X : (di/d) r : volume ratio exp() : exponential function log() : natural logarithm (neperian) ε : random estimation error For each of these models, a set of statistics for the goodness of fit and for the predictive ability was calculated. These statistics were then used to produce the relative arrangement that defines the ranking system. An integer grade was as-. Mean difference: Oi: Ei: n: ō:. DIFA% =. − Ei ) / n 2. O. ∑ (O n. The total tree volume models (v) Model 1 v = b1db2+ε Model 2 v = b0+b1d 2+ ε Model 3 v = b0+b1d 2h+ ε Model 4 (v/d 2)= b0+b1h+ ε Model 5 v = b1db1hb2+ ε Model 6 log v = b0+b1log(d 2h)+ ε. i. i =1. i. − Ei ) × 100. n×O. × 100. (1). (2). Observed Value, i=1, 2…., n Estimated Value, i=1, 2…., n Number of observations. Average observed value.. The indicators of the DIFA% and the ECM% were calculated for the total stem volume for the total volume models, as well as for the volume ratio in the ratio models. The ECM% is a measurement of the total estimation error (systematic + random error), while the DIFA% accounts for the expected bias of the estimates (systematic error). The model fits were calculated independently for each model and for each species using the entire data set in SAS® (SAS Institute, 2001). The Ordinary Least Square (OLS) method was used for the estimation of the parameters in each model as well as for the coefficients for each parameter, the Raj2, and the significance of the parameter estimators (t-Student) generated for each candidate model. Residual plots were also developed to de-.
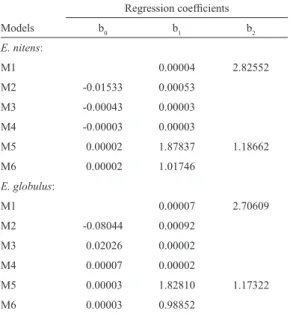
(5) VOLUME 37 Nº1 JANUARY - APRIL 2010. tect problems of heteroscedasticity and normalplots in an effort to ensure the normality of the regression residuals. The presence of clear heteroskedasticity in a model removed it from use, regardless of its position in the ranking.. 9. the models were evaluated considering the general predictive performance for each commercial volume. This process generated an overall picture of each model. Results and discussion. Comparison of the volume ratio model with the Bruce taper function Once the best model for the volume ratio (functions of the total volume and the ratio) was selected, the model was compared with the predictions of the same system determined using a taper function – the standard method used by the majority of forest firms in their processing systems. For this purpose, the model selected for each species was used to calculate the volume up to the utilization indexes of 5, 10, and 18 cm (v5, v10 and v18, respectively). Likewise, the estimates for the coefficients of the Bruce taper function (Prodan et al., 1997) were calculated using the same trees that were used to fit the total volume and the volume ratio functions. The Bruce taper function of was as follows:. (3) Y: X:. (di /d)2 (h–hi )/(h–1,3). This function was used to estimate the previously mentioned volumes. After these three utilization index volumes were estimated, the ECM% and the DIFA% for each prediction system was calculated. With these parameters estimated, it was possible to compare the predictions form the taper function and the predictions from the total volume and the volume ratio models. During the validation stage, only the trees whose diameter at the breast height (d) exceeded the index of utilization were considered. Initially,. Fit and selection of the total volume functions The process of fitting and selecting the equations was conducted simultaneously for both Eucalyptus species. Table 2 shows the coefficients of the total volume models.. Table 2. The volume model coefficients obtained for each Eucalyptus species. Regression coefficients Models. b0. b1. b2. 0.00004. 2.82552. E. nitens: M1 M2. -0.01533. 0.00053. M3. -0.00043. 0.00003. M4. -0.00003. 0.00003. M5. 0.00002. 1.87837. M6. 0.00002. 1.01746. 1.18662. E. globulus: M1. 0.00007. M2. -0.08044. 0.00092. M3. 0.02026. 0.00002. M4. 0.00007. 0.00002. M5. 0.00003. 1.82810. M6. 0.00003. 0.98852. 2.70609. 1.17322. Mi: model number i, i=1, 2,…, 6.. The test parameters established in the selection system by using the rankings for the total volume functions selected Model 6 (M6).
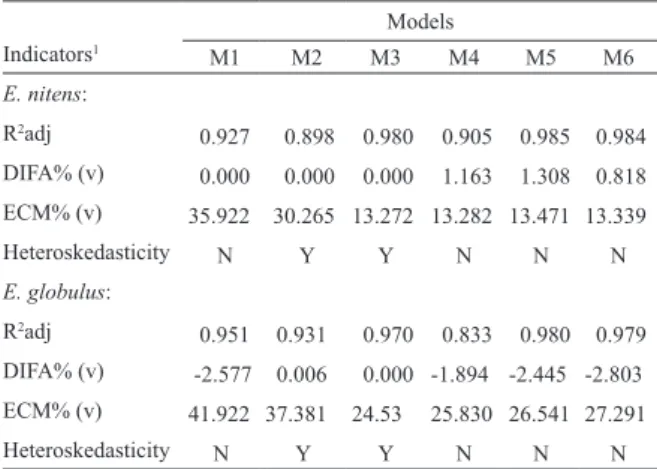
(6) ciencia e investigación agraria. 10. (log v=b0+b1log(d 2h) ) for E. nitens and Model 5 (M5) (v=b1db1hb2) for E. globulus as the best models. The goodness of fit and the predictive ability statistics determined the selection of these volume models and they are summarized in Table 3.. Figure 2 shows the residuals of the total volume models 2 and 3 plotted against the estimated value of the dependent variable. These models presented evidence of heteroscedasticity for both Eucalyptus species (EN=E. globulus, EN=E. nitens). Figure 3 shows the same plots for the. Table 3. Quality indices for the volume (v) models obtained for both Eucalyptus species. Models Indicators1. M1. M2. M3. M4. M5. M6. 0.927. 0.898. 0.980. 0.905. 0.985. 0.984. 0.000. 0.000. 1.163. 1.308. 0.818. E. nitens: R2adj DIFA% (v). 0.000. ECM% (v). 35.922. Heteroskedasticity. 30.265 13.272 13.282 13.471 13.339. N. Y. Y. N. N. N. R2adj. 0.951. 0.931. 0.970. 0.833. 0.980. 0.979. DIFA% (v). -2.577. 0.006. 0.000 -1.894 -2.445 -2.803. ECM% (v). 41.922 37.381. E. globulus:. Heteroskedasticity. N. Y. 24.53 Y. 25.830 26.541 27.291 N. N. N. R 2adj: adjusted coefficient of determination, ECM: mean squared error, DIFA: mean difference. N: no marked signs of heteroskedasticty, Y: clear signs of heteroskedasticty. 1. A logarithmic model (M6) was selected for E. nitens, which included the diameter at 1.3 m (d) and the total stem height (h) as the predictor variables. The inclusion of both variables allows for a better representation of the stem volumes given the variability of the trees to which the model will be applied. The model selected for E. nitens presented a high coefficient of determination R2aj (close to 1), which indicates a good fit to the data as measured by the percentage of the explained variability in the dependent variable. A very low bias was obtained with this model, as seen by the DIFA% value of +0.82%. The ECM% (13.3%) is within the reasonable ranges for this type of model. For E. globulus, a logarithmic model (M5) was also selected with d and h as the predictor variables. The indicator of the goodness of fit R2aj also achieved a value close to 1. This model presented DIFA% and ECM% values that can be considered as high (above 2% and 20%, respectively). However, this model performed better according to the strict application of the ranking system.. residuals of volume in M5 and M6, which were the models selected where no evidence of heteroscedasticity was observed. Models 1 and 4 presented patterns similar to the patterns of the models shown in Figure 3. These plots were used to detect the non-random patterns in the residuals. Models 2 and 3 (Figure 2) showed the characteristic pattern of a funnel for both species – a signature of heteroscedasticity in the regression residuals. All of the other models showed the expected random patterns in the residual plots. Fit and selection of a volume ratio model Following the same procedure that was used for the total volume equations, the coefficients for the volume ratio models were estimated. Table 4 shows the coefficient estimates for these models..
(7) VOLUME 37 Nº1 JANUARY - APRIL 2010. Figure 2. The residual plots for Models 2 (a: EG, b: EN) and 3 (c: EG, d: EN).. Figure 3. The residual plots for Models 5 (a: EG, b: EN) and 6 (c: EG, d: EN).. 11.
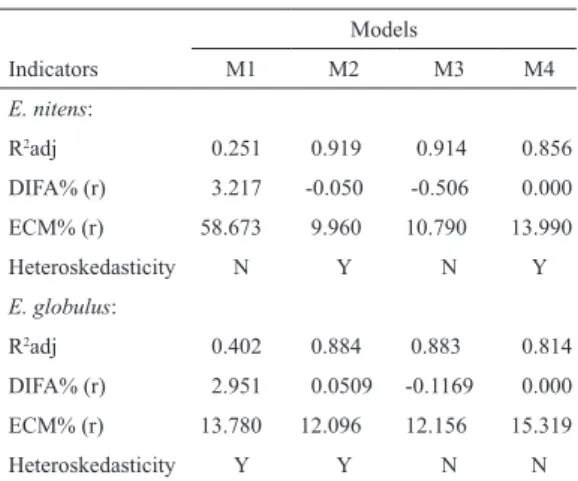
(8) ciencia e investigación agraria. 12. Table 4. Volume-ratio models coefficients obtained for both Eucalyptus species. Regression coefficients Models. b0. b1. b2. b3. b4. b5. b6. E. nitens: M1. 4.095. -0.0604. M2. 66.558. M3 M4. 242.7. -812.0. 3223.4 -5803.0 4461.8 -1213.4. -1115.3. 119.475 -56.679. 1139.9 -343.2. -0.02364. E. globulus: M1. 4.056. -0.0752. M2. -61.179. 459.6. M3. 164.2. -938.8. M4. 123.25. -72.214. Table 5. Quality indices for the volume-ratio (r) models obtained for both Eucalyptus species. Models M1. M2. M3. M4. 0.251. 0.919. 0.914. DIFA% (r). 3.217. -0.050. -0.506. 0.000. ECM% (r). 58.673. 9.960. 10.790. 13.990. E. nitens: R2adj. Heteroskedasticity. N. Y. N. 0.856. Y. E. globulus: R2adj. 0.402. 0.884. 0.883. DIFA% (r). 2.951. 0.0509. -0.1169. 0.000. ECM% (r). 13.780. 12.156. 15.319. Heteroskedasticity. Y. 12.096 Y. N. 0.814. N. R 2adj: adjusted coefficient of determination, ECM: mean squared error, DIFA: mean difference. 1. 973.3 -279.7. -0.01242. Models 1, 2 and 4 were previously reported and Model 3 was proposed in order to eliminate the variables that generated multicollinearity, as observed in Model 2. Once the coefficients for all of the models were estimated, the statistics of goodness of fit and the predictive ability were calculated (Table 5).. Indicators. -1063.4 547.8 148.1 -110.5. The system of the rankings selected Model 3 (r = 100+b3X3+b4X4+b5X5+b6X6) as the best model for both Eucalyptus species. Model 3 is a polynomial model and includes the diameter of reference d (dbh) and the merchantable diameter or index of utilization di as the independent variables. The explicit inclusion of di provided a remarkable flexibility for the estimation of different forest products as specified by the top diameter. The model performed acceptably for both Eucalyptus species, with an adequate goodness of fit and low errors in estimation and in bias (Table 5). Validation of the selected functions The validation process was conducted using the estimation system composed of the best volume equation and the best volume ratio model for each species. The first stage considered the estimation of the DIFA% and the ECM% for the volume estimation at the utilization indices of 5, 10 and 18 cm (v5, v10 and v18). The values of DIFA% and ECM% for this validation stage are indicated in Table 6..
(9) VOLUME 37 Nº1 JANUARY - APRIL 2010. Table 6. The indices for the predictive ability for the system of functions when estimating the volume at different top diameters for both Eucalyptus species. Predictive ability indexes at: Indicators. 1. 5 cm, v5. 10 cm, v10. 18 cm, v18. E. nitens: Observed average, m3 n (observations). 0.071 249. 0.076 162. 0.061 30. DIFA, %. -0.459. -0.079. -28.195. ECM, %. 13.523. 15.227. 53.000. E. globulus: Observed average, m3 n (observations). 0.315 997. 0.348 833. 0.498 406. DIFA, %. -2.683. -2.642. -6.497. ECM, %. 26.702. 26.842. 28.343. ECM: mean squared error, DIFA: mean difference.. 1. In E. nitens, the estimations were satisfactory for v5 and v10, and the system can be considered unbiased for these volumes. However, for v18 the estimations were completely biased with large, unacceptable levels of error. Considerable caution should therefore be used for the volume estimates at top diameters as high as 18 cm when estimating using this system of functions. These high levels of error were probably influenced by the low number of observations (n=30) used in the estimation for v18; in this regard, the comparison was provided as a reference only. For E. globulus, the estimations had significant error levels for all of the index diameters; thus, the system could be considered as biased. For the v5 and v10 estimations, the bias may be regarded as moderate, but for the v18 estimations, as in the previous case, the use of the system is not recommendable given the size of the errors. It seems reasonable to consider the quality of the estimations from this system to be composed of the quality of the two functions (fitted independently with errors that may be compensated for or not). When the values of the DIFA% and the ECM% for the volume functions selected in Table 3 (Model 5 and 6 for E. globulus and E. nitens, respectively) and the volume ratio func-. 13. tions in Table 5 (Model 3 for both species) were observed and compared with the DIFA% and ECM% values for v5, v10 and v18 estimations in Table 6, it was observed that volume estimates errors at different index diameters were associated with the errors of the individual functions. The independent DIFA% and ECM% values for the estimations of the total volume and for the ratio functions were always in the same range of magnitude and had the same sign as the errors in the volume estimations at index diameters, with the exception of the errors for v18. The magnitude of the estimation errors for the system that modeled the E. globulus volume for these index diameters might be explained by the bias and the total error in the total volume and the volume ratio functions. The same relationships between the estimation errors can explain the magnitude of the errors in the volume estimated at different index diameters for E. nitens. As a final validation for the functions, the system estimations of the volumes for the index diameters were compared with the estimations from the Bruce taper function (Prodan et al., 1997) that was fitted with the same information used in the system functions. The ECM% and the DIFA% statistics were calculated for v5, v10 and v18 (Table 7).. Table 7. Indices for the predictive ability for the Bruce taper model. Predictive ability indexes at: Indicators1. 5 cm, v5. 10 cm, v10. 18 cm, v18. E. nitens: Observed average, m3 n (observations). 0.071 249. 0.076. 0.061. 162. 30. DIFA, %. 5.573. 14.663. 40.035. ECM, %. 19.296. 25.519. 61.2. E. globulus: Observed average, m3 n (observations). 0.315 997. 0.348 833. DIFA, %. 1.489. 2.935. 4.812. ECM, %. 23.849. 24.061. 25.895. ECM: mean squared error, DIFA: mean difference.. 1. 0.498 406.
(10) 14. ciencia e investigación agraria. Table 7 and its comparison with Table 6 show that the system of functions yielded better volume estimates than the taper model only for E. nitens, where the DIFA% and ECM% indicate a much better prediction performance as compared to the taper function. However, the DIFA% and ECM% values for the taper function were still rather high. For E. globulus, the taper function provides volume estimates that are slightly better than the system of functions for v5 and slightly poorer than the estimates for v10. However, these estimations were unsatisfactory, since the DIFA% was only under 2% for the v5; all of the values that were positive (subestimation) and the ECM% that were above 20%, a level that was considered beyond the acceptable limits. According to the results obtained, the models of the volume ratio estimated commercial volumes adequately only in some cases. The results of this work indicate that the quality of commercial volume estimates was dependent, to a great extent, on (i) the number of trees involved in the coefficients estimates, and (ii) the estimation of quality for the individual functions (total volume and ratio) comprising the volume ratio system. In this work, the volume estimates for the utilization indices at 5 and 10 cm were satisfactory only in some cases (E. nitens). The estimates for the utilization index at 18 cm were unsatisfactory in all of the cases, partly because of the reduced number of trees that had a commercial volume for this particular utilization index. From the comparative analysis for E. nitens, it was possible to conclude that the system of. volume ratio has a better performance than the taper function. For E. globulus the opposite was true, but the differences were marginal. The general trend for both Eucalyptus species was that poorer volume estimates were obtained for larger indices of utilization. This scenario suggested a decreasing model capacity when the calibration database lacks information on individuals with the commercial volume that was being estimated. The loss of model quality when estimating larger forest products indicated weakness in the model at lower sections of the stem. It is important to highlight the strong impact that the total volume estimates have on the quality of the prediction when using the system of volume ratio functions. This situation was observed mainly for E. globulus as a strong bias that was transferred from the equation of the total volume into the system of function estimates. For E. nitens, the function for the total volume presented lower biases and, thus, the total volume function did not generate major errors in the commercial volume estimates. The models presented in this paper represent important tools that can be used in the estimation of pulpwood products. Likewise, exploring and fitting methods that take into account the interactions between functions of the total volume and ratio is recommended. Strictly speaking, their parameters should be estimated simultaneously, or should consider the autocorrelation that exists among the data from the same tree. These approximations will be covered in a future study..
(11) VOLUME 37 Nº1 JANUARY - APRIL 2010. 15. Resumen H. Gilabert y C. Paci. 2009. Funciones de razón de volumen para Eucalyptus globulus y Eucalyptus nitens en Chile. Cien. Inv. Agr. 37(1):5-15. Se calibraron modelos de razón de volumen y de volumen total para Eucalyptus nitens y Eucalyptus globulus en el sur de Chile. Los modelos fueron ajustados en forma independiente y fueron sometidos a una validación tradicional. Esta validación consideró el sesgo y error total en estimaciones de volumen de productos considerando distintos índices de utilización o diámetros límite. Asimismo, las estimaciones de volumen de productos del sistema de razón de volumen fueron comparadas con las estimaciones de un modelo de ahusamiento (modelo de Bruce). Los resultados indican que funciones generales (comparadas con funciones locales) del logaritmo del volumen entregan mejores estimaciones del volumen total para ambas especies, mientras que un único modelo polinomial estima en mejor forma la razón de volumen en ambas especies. El sistema de funciones (modelos de volumen total + razón) estima insesgadamente volúmenes a diámetros límite de 5 y 10 cm para E. nitens y con un ligero sesgo para E. globulus. Para volúmenes a un diámetro límite de 18 cm las magnitudes de sesgo y error total son muy altas para ambas especies. Se encontró que estos errores totales están más relacionados con los errores en las estimaciones de volumen total que con los errores en las estimaciones de la razón de volumen. Cuando se comparan las estimaciones de volumen con la del modelo de ahusamiento se encontró que el sistema de razón de volumen tiene mejores estimaciones para E. nitens, pero para E. globulus las estimaciones del modelo de ahusamiento son mejores. Palabras clave: Eucalyptus, modelos, estimaciones de productos madereros, volumen de productos.. References Alemdag, I.S. 1988. A ratio method for calculating stem volume to variable merchantable limits, and associated taper equations. The Forestry Chronicle 64:18-26. Amateis, R.L., H.E. Burkhart, and T.E. Burk. 1986. A ratio approach to predicting merchantable yields of unthinned loblolly pine plantations. Forest Science 32:287-296. Avery, T.E., and H.E. Burkhart. 1994. Forest Measurement. Fourth ed. McGraw–Hill, NY, USA. 408 pp. Cao, Q.V., H.E. Burkhart, and T.A. Max. 1980. Evaluation of two methods for cubic–volume predictions of loblolly pine to any merchantable limits. Forest Science 26:71-80. Gregoire, T.G., and O. Schabenberger. 1996. Nonlinear mixed-effects modeling of cumulative bole volume with spatially correlated within-tree data.. Journal of Agricultural, Biological, and Environmental Statistics 1:107-119. Lynch, T.B. 1986. Total cubic volume equations implied by diameter–based merchantable to total volume ratio models. Forest Science 32:262-267. Martin, L.F. 1992. Construcción de Modelos de Razón de Volumen. Tesis Ingeniería Forestal. Facultad de Ciencias Forestales, Universidad Austral de Chile. Valdivia, Chile. 88 pp. Newberry, J.D., and H.E. Burkhart. 1985. Variable– form stem profile models for Loblolly pine. Canadian Journal of Forest Research 16:109-114. Norambuena, A. 1996. Funciones de Ahusamiento para Plantaciones de Eucalyptus globulus en la Provincia de Valdivia, Décima Región. Tesis Ingeniería Forestal. Facultad de Ciencias Forestales, Universidad Austral de Chile. Valdivia. Chile. 98 pp. Prodan, M., Peters, R., Cox, F., and P. Real. 1997. Mensura Forestal. Primera ed. IICA/GTZ, San José, Costa Rica. 586 pp..
(12)
(13)
Figure
+4


Documento similar
The expansionary monetary policy measures have had a negative impact on net interest margins both via the reduction in interest rates and –less powerfully- the flattening of the
Jointly estimate this entry game with several outcome equations (fees/rates, credit limits) for bank accounts, credit cards and lines of credit. Use simulation methods to
In our sample, 2890 deals were issued by less reputable underwriters (i.e. a weighted syndication underwriting reputation share below the share of the 7 th largest underwriter
The morphological characteristics (diameter at breast height; heartwood, sapwood, bark, and pith percentages; and eccentricity of pith), physical properties (shrinkage, green
The Dwellers in the Garden of Allah 109... The Dwellers in the Garden of Allah
The analysis of plant height, stem diameter, fresh forage, and dry matter in the dry season varied between forage shrub species. oleifera were the two species that showed
Nevertheless, in the CWS case, the growth of wave height stimulates nonlinearities, so the merging of bars is much stronger for waves of 1.25 m than for waves of 1 m and this leads
Most of the studies included in this review use various constructs to measure issues associated with STEM achievement, STEM motivation, gender stereotypes about STEM careers,
