Spatial distribution of intertidal fishes: a pattern dependent on body size and predation risk?
12
0
0
Texto completo
(2) 176. with high refuge availability, while individuals that reach a size large enough to avoid being ingested cease to do so (Sale 1991; Hixon and Beets 1993; Halpin 2000; Almany 2004). Although such observations support the role of spatial heterogeneity in fish distribution, or its coexistence as predatory control, they also suggest its dependence on body size. This latter, could be a motivational factor towards the use of refuge associated with its role in the individual susceptibility to the predation. The importance of body size in fish distribution in the community context has not been approached directly. Studies consider the observed pattern of space use as a consequence of individuals making decisions based on the trade-off between foraging behavior and predation risk. Behind of this trade-off is assumed that small fish have less food processing and storage capacity than larger fish, which relates to their ability to find food. This fact could force small fish to increase foraging time and intensity, and consequently, their exposure to predators (Gill and Hart 1994; Karpouzi and Stergiou 2003; Byström et al. 2004). In this sense, Byström et al. (2004) suggested that predation risk is the main factor for small fish when it comes to making decisions on space use, and that resource limitation is more relevant on decision making as they growth. An accepted notion about antipredatory behaviour is that it is a plastic response, whose magnitude is sensitive to the intensity of the predatory threat against other factors (“threat-sensitive predator avoidance hypothesis”) (Helfman 1989; Helfman and Winkelman 1997). Thus, the interaction between body size and refuge availability could define the intensity of the predatory threat. Consequently, distribution could result from individual decisions on space use, which may imply certain costs, such as less foraging opportunities. Recent studies show changes in the intensity of freezing behaviour (Engström-Öst and Lehtiniemi 2004), distances for avoidance reactions (Helfman 1989), and space use (Brown et al. 2006) with increases in the degree of predation risk, where spatial heterogeneity and ratio size between predator and prey play significant roles in controlling threat levels. Hence, considering these previous backgrounds, body size and spatial heterogeneity could be central drivers in fish distribution, and if we want to improve our understanding of the proximal causes of spatial distribution, the inclusion of size relationships. Environ Biol Fish (2010) 87:175–185. among individuals into the spatial context could be the next relevant step. Our study system focuses on fish assemblages that inhabit the intertidal rocky area of central Chile. Resident species are mainly carnivorous (ten out of 11) (Varas and Ojeda 1990; Muñoz and Ojeda 1998), having a maximum body size of 220 mm (TL) in Auchenionchus microcirrhis, followed by Bovichthys chilensis with 180 mm. The body sizes of the rest of the individuals do not exceed 90 mm (Muñoz and Ojeda 1998). Both species, over 110 mm, show preference for consuming fish, being the principal predators of the assemblage, including conspecific juveniles (Muñoz and Ojeda 1998). This fact implies that piscivorous fishes are prey when small, and they also possibly compete with the ones that become their main prey in latter stages (e.g. intraguild predation) (Fox 1975; Gill and Hart 1994). Hence, this could involve a variable risk of predation which would depend on the predator—prey size ratio for all fish. Within this scenario, the intertidal fish assemblage of the central Chilean coast is an interesting natural system, where the role of spatial heterogeneity can be tested in relation to the size structure of the assemblage and the spatial distribution of fish. The general objective of this study, through the implementation of a semi-natural experiment, was to evaluate the influence of spatial heterogeneity on the spatial distribution of an intertidal fish assemblage. Here, size-dependent predation risk is considered to be the core motivation for spatial distribution of prey. Due to the available background on intertidal fish distribution (Horn et al. 1999), we included the possible influence of food availability in the discussion of our results.. Materials and methods To describe the distribution patterns of intertidal rocky fishes, observations were carried out every 2 months, for 2 years (January 2001–January 2003), at Las Cruces locality (33° 30′S; 71° 39′W), which is on the coast of central Chile (Fig. 1). The observations were performed in 24 artificial pools of similar volume (190 l; 0.7×0.3×0.9 m) (Fig. 1), placed at the mid-low rocky intertidal level into a lower tide channels. The use of artificial pools as observation units allowed us to manipulate spatial heterogeneity.
(3) Environ Biol Fish (2010) 87:175–185 Fig. 1 Study site and experimental treatments. Field experiments were carried out in Las Cruces. The arrow on the map indicates the site where the artificial pools were located. The experimental treatments were defined by number of heterogeneity units in the artificial pool (Hx), as shown in the figure (see text for more details). 177. HETEROGENEITY LEVELS 71. HC: control. El Tabo 30˚27`. H1: medium - low Las Cruces. H2: medium - high +. 30˚30`. N. H3: high. 1 Km. Cartagena. n = 24. 0.3m. 0.7m 0.9m. conditions, while controlling differences in physical condition associated to the position and orientation towards the swash zone, as well as size. Each pool was modified on its internal surface according to a random factorial model (see details below). Each artificial pool was monitored through an animal census, which was conducted during low tide, when the pools were isolated. To reduce handling stress before captures were performed, specific anesthesia for fish (BZ-20, Veterquímica) was added to the water in each pool. Afterwards, each pool was carefully emptied by using a suction pump, so as to collect all of the individuals within 45 min. The collected fish were identified to the species level. Their total length (to the nearest millimeter) and weight (to the nearest grams) were recorded. The individuals were maintained in tanks near their original pool during handling. Finally, they return to original pools within a time period no longer than 1 h, after the pool was refilled with fresh marine water. As mentioned previously, the heterogeneity level in each pool was modified following a random factorial model. Such level was manipulated using three boulders of similar volume and shape (2 kg approximately each one), linked by metallic ring anchorage connector. These arrangements were referred to as “heterogeneity units” (Fig. 1). The level of heterogeneity in each pool was defined by the number of heterogeneity units (HU’s) that they. contained. The units were randomly assigned to each pool in groups of 0, 1, 2 and 3 HUs, defining the following four treatments: a) high heterogeneity (H3) with three HUs; b) medium heterogeneity (H2) with two HUs; c) low heterogeneity (H1) with one HU; and d) control (H0) without HUs. Each heterogeneity treatment was replicated in six artificial pools (24 total pools), under the precaution of not placing pools with similar treatments close to each other. Body size and functional predation risk To objectively analyze the relevance of body size in fish distribution within a spatial heterogeneity and predation risk context, statistical analysis was carried out considering the potential functional relationships between the individuals. For this purpose, all captured individuals were classified in an ontogenetic trophic guild (OTG), where body size was the main criteria. These groups were defined according to trophic categories previously established for this fish assemblage by Cancino and Castilla (1988) and by Muñoz and Ojeda (1998). These authors showed the occurrence of functional groups according to stomach content and body size (OTG). Based on this information, all the fishes collected were classified into four trophic guilds. The D group was the main carnivorous guild, with a diet regime that included fish and macroinvertebrates. The A, B and C groups were the.
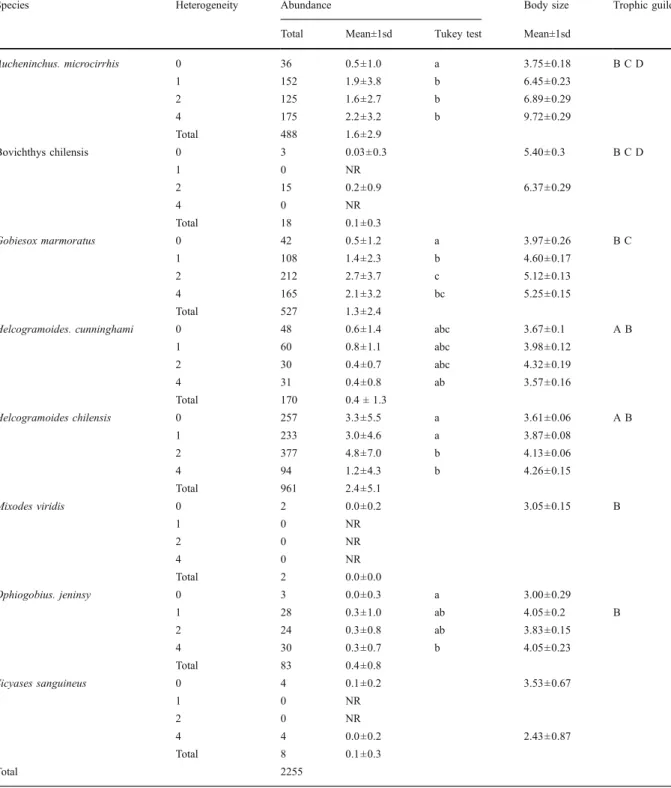
(4) 178. microcarnivore guilds, who consume invertebrates of different sizes. Data analysis Statistical analyses were performed using the Statistica® (StatSoft 2001) statistical package for Windows. Assuming possible interaction among individuals, temporal variation of abundance across heterogeneity levels was analyzed by multifactorial ANOVA. The time factor was considered a random factor, and the heterogeneity level a fixed factor. The test assumptions were previously evaluated and the data were transformed to log(x+1). The a posteriori Tukey test was used to evaluate differences between heterogeneity levels. Since time was a random factor, it was not possible to include it in the post hoc test. Similarities in the contribution of individuals to species abundance and ontogenetic trophic guild throughout the heterogeneity treatment were evaluated by a Kendall concordance analysis and a Friedman Anova test. Graphic analysis (histogram) was used to evaluate size dominance under each heterogeneity treatment, together with treatment accessibility for individuals (particularly the small’s ones), this last referred to a possible influence on size structure observed of experimental observation units (artificial pool and heterogeneity units). So as to evaluate whether a body size is dominant under some experimental conditions, each histogram was fit to normal distribution as a null model using the Shapiro–Wilks test. The statistic descriptors of the fit model then were used to contrast among heterogeneity treatments. Finally, multidimensional scaling analysis (MDS) was used to evaluate consistency in the occurrence of each ontogenetic trophic guild over each artificial pool and/or heterogeneity treatment along study. MDS analysis was based on a Bray-Curtis similarity matrix among observations (time × pool), considering the abundance of each OTG as the response variable. Similarity values between observed pairs were scaled to Euclidean distances, so as to order them by using the Unweighted Pair Group Method (UPGMA) on a bidimensional plane. Thus, we obtained one MDS panel per heterogeneity level, where the nearness among samples represents the grade of guild cooccurrence through the study in each treatment. Prior to the analysis, all data were converted to square roots (Clarke 1993).. Environ Biol Fish (2010) 87:175–185. Results After 2 years of conducting censuses, we recorded a total of eight carnivorous species and 2,255 fish (Table 1). Four of the former represented up to 90% of the total abundance (Table 1), namely, Auchenionchus microcirrhis, Helcogrammoides chilensis, Helcogrammoides cunninghami, and Gobiesox marmoratus, of which H. chilensis showed the greatest contribution to this assemblage (Table 1). In relation to the effect of heterogeneity levels on abundance, almost all individuals showed significant differences in such (Wilks Multivariate test, heterogeneity level, F(27, 324) =6.51, p<0.00; Time, F(108, 324) =2.12, p<0.00). Auchenionchus microcirrhis showed its highest abundances upon greater heterogeneity treatment (Univariate test F(3,36) = 16.6, p<0.00; Table 1), in opposition to what was observed for H. chilensis, which showed its lowest abundances (H. chilensis, Univariate test F(3, 36) =21.36, p<0.00; Table 1). For the rest of species, in general, maximum abundances were observed at middle heterogeneity levels (G. marmoratus, Univariate test F(3, 36) = 22.3, p<0.00; H. cunninghami, Univariate test F(3, 36) = 2.88, p<0.03; and Ophiogobius jenynsi, Univariate test F(3, 36) =3.93, p<0.01; Table 1). Non-significant interactions between heterogeneity levels and time were observed (Wilks Multivariate test, F(324, 3022) =0.99, p>0.05). As with results above, only some species showed temporal changes in their abundances. Significant changes were recorded in the three highabundance species, together with H. cunninghami. (A. microcirrhis, Univariate test F(12, 36) =23.0, p<0.00; G. marmoratus, Univariate test F(12, 36) =13.7, p<0.00; H. chilensis, Univariate test F(12, 36) =7.23, p<0.00; H. cunninghami, Univariate test F(12, 36) =1.86, p<0.03). From a visual evaluation, a seasonal tendency under these temporal variations was not evident. Throughout the study, only one clingfish species was recorded (Sicyases sanguineous). The largest individual recorded did not reach 30 mm, which according to Cancino and Castilla (1988) could imply that all captures could correspond to herbivorous fish. Therefore, such species was excluded from posterior analyses. From histograms, differences in abundance but not in presence of small individual among heterogeneity treatments were observed. This result suggests a minimal influence of the observational unit in the habitability of treatments or its accessibility (Fig. 2). For each histogram, an asymmetric positive.
(5) Environ Biol Fish (2010) 87:175–185. 179. Table 1 Species recorded recorded during duringthe thestudy. study.We Weincluded includedthe themean mean abundance 1 standard and total amount of specimens range for (± each species, deviation) was included. Trophic classification was by heterogeneity abundance (± 1 standard level recorded deviation)throughout and total amount the study. of specimens The Tukey test represents output the and statistical test onto;pair donecolumn according to Muñoztheand Ojedaof1998, corresponds A: comparison by heterogeneity among level heterogeneity recorded throughout levels. Equal the study. lettersThe correspond Tukey toHarpacticoid non-significant differences The body mean by copepods eater; (p<0.05). B: amphipods eater;size C: decapods test species, column as well represents as the trophic the output guildofcategory the statistical that includes test on the pairsize range for each species,eater; was D: included. Trophic crabs and amphipods decapods crabs classification and fish eater.was S. comparison done according among to heterogeneity Muñoz and Ojeda levels.1998, Equal and letters corresponds correspond to; to A: sanguineus, Harpacticoidsmaller copepods eater; B:than amphipods decapods individuals 150 mmeater; are C: classified as non-significant crabs and amphipods differences eater;(p<0.05). D: decapods The crabs body and size fish mean eater. by S. sanguineus, smaller individuals 150consequently, mm are classified as herbivorous (Cancino and Castillathan 1988), they were herbivorous species, as well (Cancino as the trophic and Castilla guild 1988), categoryconsequently, that includes they the size were not individuals notincluded includedininthis thisclassification. classification. NR: NR: non-recorded non-recorded individuals Species. Aucheninchus. microcirrhis. Bovichthys chilensis. Gobiesox marmoratus. Helcogramoides. cunninghami. Helcogramoides chilensis. Mixodes viridis. Ophiogobius. jeninsy. Sicyases sanguineus. Total. Heterogeneity. Abundance. Body size. Total. Mean±1sd. Tukey test. Mean±1sd. 0. 36. 0.5±1.0. a. 3.75±0.18. 1. 152. 1.9±3.8. b. 6.45±0.23. 2. 125. 1.6±2.7. b. 6.89±0.29. 4. 175. 2.2±3.2. b. 9.72±0.29. Total. 488. 1.6±2.9. 0. 3. 0.03±0.3. 1. 0. NR. 2. 15. 0.2±0.9. 4. 0. NR. Total. 18. 0.1±0.3. 0. 42. 0.5±1.2. a. 3.97±0.26. 1. 108. 1.4±2.3. b. 4.60±0.17. 2. 212. 2.7±3.7. c. 5.12±0.13. 4. 165. 2.1±3.2. bc. 5.25±0.15. Total. 527. 1.3±2.4. 0. 48. 0.6±1.4. abc. 3.67±0.1. 1. 60. 0.8±1.1. abc. 3.98±0.12. 2. 30. 0.4±0.7. abc. 4.32±0.19. 4. 31. 0.4±0.8. ab. 3.57±0.16. Total. 170. 0.4 ± 1.3. 0. 257. 3.3±5.5. a. 3.61±0.06. 1. 233. 3.0±4.6. a. 3.87±0.08. 2. 377. 4.8±7.0. b. 4.13±0.06. 4. 94. 1.2±4.3. b. 4.26±0.15. Total. 961. 2.4±5.1. 0. 2. 0.0±0.2. 1. 0. NR. 2. 0. NR. 4. 0. NR. Total. 2. 0.0±0.0. 0. 3. 0.0±0.3. a. 3.00±0.29. 1. 28. 0.3±1.0. ab. 4.05±0.2. 2. 24. 0.3±0.8. ab. 3.83±0.15. b. 4.05±0.23. 4. 30. 0.3±0.7. Total. 83. 0.4±0.8. 0. 4. 0.1±0.2. 1. 0. NR. 2. 0. NR. 4. 4. 0.0±0.2. Total. 8. 0.1±0.3. 2255. 5.40±0.3. Trophic guild. BCD. BCD. 6.37±0.29. 3.05±0.15. 3.53±0.67. 2.43±0.87. BC. AB. AB. B. B.
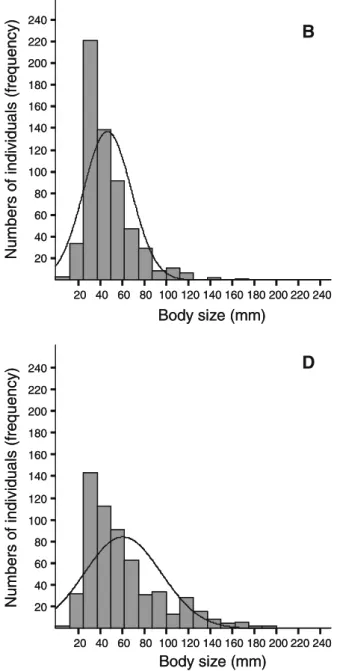
(6) 180. Environ Biol Fish (2010) 87:175–185. 240. A. 220 200 180 160 140 120 100 80 60 40 20. with greater predominance under control treatment and low heterogeneity. Similarly, large fish (over 10 cm) were also present in all heterogeneity treatments. However, is possible suggest a more homogeneous representation of all size classes considering the kurtosis reduction observed upon high heterogeneity treatments. This last result was probably associated to the relative major presence of large individuals under greater heterogeneity treatment (Fig. 2). The latter agrees with. Numbers of individuals (frequency). Numbers of individuals (frequency). size distribution was observed, as well as strong differences in the kurtosis values among treatments (Table 2). These results are supported by the lack of fit between size distribution and normal theoretical distribution (Fig. 2). The mean values showed a tendency to increase with heterogeneity, together with a rise in the recorded size range. Biologically, these results show that small fish were present in all heterogeneity situations (treatments and control), but. 240. 200 180 160 140 120 100 80 60 40 20. 20 40 60 80 100 120 140 160 180 200 220 240. 20 40 60 80 100 120 140 160 180 200 220 240. Body size (mm). C. 220 200 180 160 140 120 100 80 60 40 20 20 40 60 80 100 120 140 160 180 200 220 240. Body size (mm) Fig. 2 Frequency distribution of body size by heterogeneity level. The lines represent a normal curve fit by the Shapiro– Wilk test. a Control treatment: SW-W=0.91, p<0.00, n=391; b. Numbers of individuals (frequency). Numbers of individuals (frequency). Body size (mm). 240. B. 220. D. 240 220 200 180 160 140 120 100 80 60 40 20. 20 40 60 80 100 120 140 160 180 200 220 240. Body size (mm) Low heterogeneity: SW-W=0.87, p<0.00, n=584; c Mean heterogeneity: SW-W=0.85, p<0.00, n=771; D) High heterogeneity: SW-W=0.91, p<0.00, n=503.
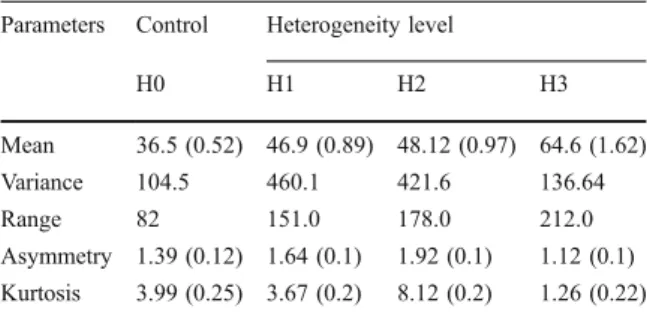
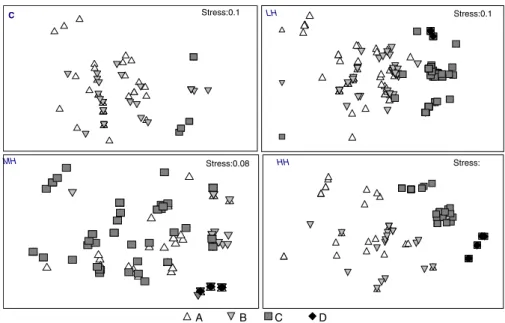
(7) Environ Biol Fish (2010) 87:175–185. 181. Table 2 Statistic parameters for the body size frequency distributions by heterogeneity level. H3: high heterogeneity, three HUs. H2: medium heterogeneity, two HU’s. H1: low heterogeneity, with one HU. H0: control. HU: heterogeneity unit (see text for details). Numbers in parenthesis correspond to a standard error Parameters. Control. Heterogeneity level. H0. H1. H2. H3. Mean. 36.5 (0.52) 46.9 (0.89) 48.12 (0.97) 64.6 (1.62). Variance. 104.5. 460.1. 421.6. 136.64. Range. 82. 151.0. 178.0. 212.0. Asymmetry 1.39 (0.12) 1.64 (0.1). 1.92 (0.1). 1.12 (0.1). Kurtosis. 8.12 (0.2). 1.26 (0.22). 3.99 (0.25) 3.67 (0.2). the results drawn for relative abundance, in which a low concordance was observed in terms of individuals’ contribution to species abundance among treatments (Kendall Concordance=0.00; Aver. rank r=−0.13; ANOVA Chi Sqr(8,3) =0.2 p<0.97), aside from nonsignificant differences in the total abundances among treatments. Considering trophic group contribution to abundance for each heterogeneity level, significant differences in total abundance were observed (ANOVA Chi Sqr.(4, 3) = 7.8 p<0.05). Furthermore, important level of concordance in the composition of trophic guilds among treatments were recorded (Kendall Concordance=0.65; Aver. rank r=0.53) (Fig. 3). From a functional perspective per trophic group, these results show a decrease in the occurrence of microinvertebrate consumers (group A) when heterogeneity increased, followed by a rise in the abundance of crab (group C) and fish consumers (group D) (Fig. 3). A drop in the abundance of amphipod consumers (group B) was observed only at the highest heterogeneity level (H3),. Discussion Contrary to what is commonly assumed for the relationship between spatial heterogeneity and spatial distribution of fish, our results showed a major occurrence of small fish in low heterogeneity areas, including open areas. Apparently, this result could be related to a greater spatial affinity among individuals with similar diets than among conspecifics, as has been evidenced by Horn et al. (1999). This last. 0.6. Number of Individuals (relative proportion). Fig. 3 Proportion of individuals that composed each trophic group on total number recorded by heterogeneity level. The total number of individuals observed under each heterogeneity treatment is shown in parentheses. being the group with lowest variability in this study. Piscivorous group was only recorded in treatments that included some level of heterogeneity, showing its highest abundances in the more heterogeneity treatment (H3) (Fig. 3). As for scaling analysis (MDS), differences in the co-occurrence of the OTG among heterogeneity treatments were evidenced from the four panels together. In general, decreases in the co-occurrence (high Euclidian distance) of different trophic groups with increments in heterogeneity levels were observed (Fig. 4). Considering the results described in the previous section (Fig. 3) in interpretation of these last results, microinvertebrate and fish consumers showed a reduced probability of encounter (between smaller and big fish), while the possibilities of coexistence among crab and fish consumers were greater (large Euclidian distance). This pattern was observed only in treatments with structural modifications (HU inclusion) and was more consistent as heterogeneity levels increased (Fig. 4). Under control conditions (without HU), only microcarnivorous fish were recorded. In summary, these observations show a decrease in the cooccurrence of individuals of different sizes with a rise in refuge availability.. B group (584). A group (391). C group (771). D group. (503). 0.5 0.4 0.3 0.2 0.1 0. H0. H1. Heterogeneity levels. H2. H3.
(8) 182 Fig. 4 A spatial representation of the co-occurrence of individuals categorized by trophic group (MDS). Each spatial map shows the arrangement of groups observed by heterogeneity level. The stress value is shown as an estimator in adjusting the model to the data (see text for details). Environ Biol Fish (2010) 87:175–185 C. Stress:0.1. MH. Stress:0.08. A. observation was also supported by a minor overlap in space use of small specimens with larger fishes. Spatial distribution of marine assemblages has been associated with an active selection of habitat, as a consequence of productivity, structural complexity of habitat and local predation risk (Hixon and Beets 1993; Caley and John 1996; Polivka and Chotkowski 1998; Montgomery et al. 2001; Shima 2001; Griffiths 2003b; Almany 2004). The effects of the last two factors are not independent, suggesting that animals often respond to the presence of predators by increasing the use of refuges, moving to zones with low predator abundances (Sih 1986; Lima and Dill 1990; Sih et al. 1992; Hixon and Beets 1993; Krivan 1998), or to high complexity areas, assuming that predators may be less efficient foragers in these habitats (Roberts and Ormond 1987; Sih et al. 1992; Hixon and Beets 1993; Beukers and Jones 1997; Flynn and Ritz 1999; Almany 2004). Predators may use several strategies for foraging in the wild, ranging from ambush to cruiser predators. The influence of a predator’s foraging strategies on the natural system has been evidenced at the community (Schmitz 2008), population (Dalin et al. 2006) and individual levels (Greene 1986; Laurel and Brown 2006). A result that emerges from these studies is that the different antipredatory displays or intensities in prey response are related with the predictability an/or duration of the predation risk pressure (Lima and Bednekoff 1999; Sih and McCarthy 2002). Functionally, predation risk may be considered a continuum. B. LH. Stress:0.1. HH. C. Stress:. D. variable, where an ambush hunter and active predator would be found on each one of the extremes of the variable. An ambush hunter could be associated with a low predictable threat, and consequently a persistent risk source. Chronic behavioral responses are expected to be seen in the prey of such predators. On other hand, for an active hunter, its threat could set up a more variable source of depredation, which is unlikely to cause chronic behavioural responses in their prey (Lima and Bednekoff 1999; Schmitz 2008). Empirical support for these predictions are scarce in the literature, available studies suggest a spatial overlap between predators and prey highest in the presence of active predator than in presence of the ambush predator, thus, the space use behaviour of a prey could be a descriptor to consider of the behavioural relationship between the prey and its predator (Laurel and Brown 2006; Preisser et al. 2007; Valeix et al 2009). Both the presence and relative abundance of individuals and species recorded in this study were in agreement with what has been observed for the same system under native conditions (Varas and Ojeda 1990; Muñoz and Ojeda 1998; Rojas 2005). Auchenchus microcirrhis, the one registered piscivore predator, correspond to a criptobenthic piscivore which switch their food preferences during ontogeny from microinvertebrates to a fish (piscivores) in the adult stage. This switch in trophic preference is concomitant with a change in their hunting strategy, from being active to ambush hunters (Werner 1986; Werner and Hall 1988; Sale 1991; Jobling 1995;.
(9) Environ Biol Fish (2010) 87:175–185. Hughes 1997; Rojas 2005). According to the above, in our semi-experimental scenario we may consider that a heterogeneous zone could represent a riskier area than an open zone relate to the presence of A. microcirrhis piscivores, situation that could increment in risk according to abundance of predators. In this respect, a reduction in the overlap between predators and its potential victims with the increment in the spatial heterogeneity corresponds to a possible result, particularly for small-sized fish or individuals most susceptible to the predation. Hence, the preference by space open or low heterogeneity of smaller fish also would be a coherent expected result. In general, these results agree with those obtained for different taxa. For insects, an increase in depredation risk according to the environmental heterogeneity is reported for preys that face ambush predators. This result are related to the gain of potential hunting grounds, from which more effective attacks can be launched (Giller and McNeill 1981; Janes 1985) and where prey have reduced predators visibility (Coen et al. 1981). In mammals herbivorous, a tendency to use more open habitats preferentially when lions are in their vicinity was reported as a consequence of an antipredatory decision (Valeix et al 2009). A result similar in juvenile Atlantic cod was observed, where a low spatial overlapping between cod and its ambush predators in open water was described (Laurel and Brown 2006). Food accessibility also has been described as an important factor affecting fish distribution (Horn et al. 1999). Members of guild A (smaller fish) are characterized by being harpacticoid copepod consumers, which is one of the invertebrate groups with greatest abundance and dispersion in the rocky intertidal zone (Dole-Oliver and Galassi 2000; Johnson 2001). This condition suggests the absence of any spatial and temporal food restrictions for its consumers. In the case of macroinvertebrates (prey of guild B and C) (Muñoz and Ojeda 1998), amphipods, isopods and crabs are their principal prey, which are animals with high displacement ability, but with a tendency to settle on high spatial heterogeneity zones (Bertness 1981; Pennings et al. 2000; Beyst et al. 2002; Ingólfsson and Agnarsson 2003; Castilla et al. 2004; Davidson et al. 2004). Therefore, we would at least have to expect a positive correspondence between heterogeneous areas and the distribution of macroinvertebrate. 183. consumers for example, as has been described in the literature (Horn et al. 1999). The high physical instability of the rocky intertidal zone of the South Pacific coast implies serious difficulties to efficiently evaluate food availability for individuals. In spite this, taking into account our results and the above background information, we suggest a low agreement between the spatial distribution of intertidal fish and food availability, particularly in small fishes (copepod and amphipod consumers). The high presence of small specimens at open or low heterogeneity fields could result from a behavioral response to increases in potential predators with heterogeneity (or predation risk), which is a possible decision due to an apparent lack of limitation in the system’s food availability. Similar inferences are possible for other trophic guilds, supporting the hypothesis that predatory risk could be an important cause for such observed spatial distribution (Byström et al. 2004). In brief, our results showed a tendency of individuals to stay away from high heterogeneity zones where ambush predators can be readily found, being this tendency negatively related to body size. These results suggest a relevant role of predation risk in spatial distribution of fish, manifesting the importance of foraging strategies used by predators as the ultimate driving factor. Nevertheless, empirical evidence that directly supports this hypothesis is necessary. A core element for this prediction is body size, expressed in predator-prey ratios, due to its role as a motivational factor for antipredatory behavior decisions. In this scenario, it is interesting to observe the responsibility of spatial heterogeneity as a facilitator of ambush (risk) places more than antipredatory refuges, as has been traditionally perceived in marine systems. This last observation does not contradict what is assumed for the intertidal fish assemblage, where spatial heterogeneity is considered a key function in the persistence of these systems due to its role in supplying refuges (Grossman 1982; Prochazka 1996, 1998; Polivka and Chotkowski 1998; Shima 1999; Montgomery et al. 2001; Shima 2001; Griffiths 2003b; Almany 2004). One of the features of this system that has contributed to such view is the active movement of individuals among micro-habitats, which has been related with the balance between safety and food availability (Crowder and Cooper 1982; Yoshiyama 1981; Carr 1991; Persson.
(10) 184. and Eklöv 1995; Pfister 1996; Meserve et al. 1999; Griffiths 2003a, b). Our results and the high structural complexity that distinguishes the intertidal system suggest that the origin of this individual activity would be conditioned by trophic interactions, where the role of the environment is subordinate to the individual context defined by the body size. Acknowledgements We thank Tatiana Manzur and José Miguel Fariña for their valuable comments together to two anonymous reviewers This work was supported by Fondo de Áreas Prioritarias—Fondo Nacional de Investigación Científica y Tecnológica 1501-0001, granted to the Center of Advanced Studies in Ecology and Biodiversity (CASEB). JMRB was supported by the Comisión Nacional de Investigación Científica y Tecnológica (CONICYT).. References Almany G (2004) Does increased habitat complexity reduce predation and competition in coral reef fish assemblages? Oikos 106:275–284 Bertness M (1981) Predation, physical stress, and the organization of a tropical rocky intertidal hermit crab community. Ecology 62:411–425 Beukers J, Jones J (1997) Habitat complexity modifies the impact of piscivores on a coral reef fish population. Oecología 114:50–59 Beyst B, Vanaverbeke J, Vincx M, Mees J (2002) Tidal and diurnal periodicity in macrocrustaceans and demersal fish of an exposed sandy beach, with special emphasis on juvenile plaice Pleuronectes platessa. Mar Ecol Prog Ser 225:263–274 Brown G, Rive A, Ferrari M, Chivers D (2006) The dynamic nature of antipredator behavior: prey fish integrate threatsensitive antipredator responses within background levels of predation risk. Behav Ecol Sociobiol 61:9–16 Byström P, Andersson J, Persson L, De Roos A (2004) Sizedependent resource limitation and foraging-predation risk trade-offs: growth and habitat use in young arctic char. Oikos 104:109–121 Caley M, John J (1996) Refuges availability structure assemblages of tropical reef fishes. J Anim Ecol 65:414–428 Cancino J, Castilla J (1988) Emersion behaviour and foraging ecology of the common Chilean clingfish Sicyases sanguineus (Pisces: Gobiesocidae). J Nat Hist 13:249–261 Carr M (1991) Habitat selection and recruitment of an assemblage of temperate zone reef fishes. J Exp Mar Biol Ecol 146:113–137 Castilla J, Lagos N, Cerda M (2004) Marine ecosystem engineering by the alien ascidian Pyura praeputialis on a mid-intertidal rocky shore. Mar Ecol Progr Ser 268:119–130 Clarke K (1993) Non-parametric multivariate analyses of changes in community structure. Austral J Ecol 18:117–143 Coen L, Heck J, Abele L (1981) Experiments on competition and predation among shrimps of seagrass meadows. Ecology 62:1481–1493. Environ Biol Fish (2010) 87:175–185 Crowder L, Cooper W (1982) Habitat structural complexity and the interaction between bluegills and their prey. Ecology 63:1802–1813 Dalin P, Kindvall O, Björkman C (2006) Predator foraging strategy influences prey population dynamics: arthropods predating a gregarious leaf beetle. Anim Behav 72:1025– 1034 Davidson I, Crook A, Barnes K (2004) Macrobenthic migration and its influence on the intertidal diversity dynamics of a meso-tidal system. Mar Biol 145:833–842 Dole-Oliver M, Galassi D (2000) The biology and ecology of lotic microcrustaceans. Freshwater Biol 44:63–91 Engström-Öst J, Lehtiniemi M (2004) Threat-sensitive predator avoidance by pike larvae. J Fish Biol 65:251–261 Flynn A, Ritz D (1999) Effect of habitat complexity and predatory style on the capture success of fish feeding on aggregated prey. J Mar Biol Assoc UK 79:487–494 Fox L (1975) Cannibalism in natural populations. Ann Rev Ecol Syst 6:87–106 Gill A, Hart P (1994) Feeding behaviour and prey choice of the threespine stickleback: the interacting effect of prey size, fish size and stomach fullness. Anim Behav 47:921–932 Giller P, McNeill S (1981) Predation strategies, resource partitioning and habitat selection in Notonecta (Hemiptera/Heteroptera). J Anim Ecol 50:789–808 Greene C (1986) Patterns of prey selection: implications of predator foraging tactics. Am Nat 128:824–839 Griffiths S (2003a) Rockpool ichthyofaunas of temperate Australia: species composition, residency and biogeographic patterns. Estuar Coast Shelf Sci 58:173–186 Griffiths S (2003b) Spatial and temporal dynamics of temperate Australian rockpool ichthyofaunas. Mar Freshwater Res 54:163–176 Grossman G (1982) Dynamic and organization of a rocky intertidal fish assemblage: the persistence and resilence of taxocene structure. Am Nat 119:611–637 Halpin P (2000) Habitat use by an intertidal salt-marsh fish: trade-offs between predation and growth. Mar Ecol Progr Ser 198:203–214 Helfman G (1989) Threat-sensitive predator avoidance in damselfish–trumpetfish interactions. Behav Ecol Sociobiol 24:47–58 Helfman G, Winkelman D (1997) Threat sensitivity in bicolor damselfish: effects of sociality and body size. Ethology 103:369–383 Hixon M, Beets J (1993) Predation, prey refuges, and the structure of coral-reef fish assemblages. Ecol Monogr 63:77–101 Horn M, Martin K, Chotkowski M (1999) Intertidal fishes. Life in two worlds. Academy, San Diego Hughes R (1997) Diet selection. In: Godin JG (ed) Behavioural ecology of teleost fishes. Oxford University Press, pp 134–162 Ingólfsson A, Agnarsson I (2003) Amphipods and isopods in the rocky intertidal: dispersal and movements during high tide. Mar Biol 143:859–866 Janes S (1985) Habitat selection in raptorial birds. In: Cody ML (ed) Habitat selection in birds. Academy, New York, pp 159–188 Jobling M (1995) Environmental biology of fishes. Chapman and Hall, London.
(11) Environ Biol Fish (2010) 87:175–185 Johnson M (2001) Metapopulation dynamics of Tigriopus brevicornis (Harpacticoida) in intertidal rock pools. Mar Ecol Progr Ser 211:215–224 Karpouzi V, Stergiou K (2003) The relationships between mouth size and shape and length for 18 species of marine fishes and their trophic implications. J Fish Biol 62:1353– 1365 Krivan V (1998) Effects of optimal antipredator behavior of prey on predator-prey dynamics: the role of refuges. Theor Popul Biol 53:131–142 Laurel B, Brown J (2006) Influence of cruising and ambush predators on 3-dimensional habitat use in age 0 juvenile Atlantic cod Gadus morhua. J Exp Mar Biol Ecol 329:34–46 Lima S, Dill L (1990) Behavioral decisions made under the risk of predation—a review and prospectus. Can J Zool 68:619–640 Lima S, Bednekoff P (1999) Back to the basics of antipredatory vigilance: can nonvigilant animals detect attack? Anim Behav 58:537–543 May R (1973) Stability and complexity in model ecosystems. Princeton Univ. Press, Princeton McCann K (1998) Density-dependent coexistence in fish communities. Ecology 79:2957–2967 Meserve P, Milstead W, Gutierrez J, Jaksic F (1999) The interplay of biotic and abiotic factors in a semiarid Chilean mammal assemblage: results of a long-term experiment. Oikos 85:364–372 Montgomery J, Tolimieri N, Haine O (2001) Active habitat selection by pre-settlement reef fishes. Fish and Fisheries 2:261–277 Muñoz A, Ojeda F (1998) Guild structure of carnivorous intertidal fishes of the Chilean coast: implications of ontogenetic dietary shifts. Oecologia 114:563–573 Pennings S, Carefoot T, Zimmer M, Danko J, Ziegler A (2000) Feeding preferences of supralittoral isopods and amphipods. Can J Zool 78:1918–1929 Persson L, Eklöv P (1995) Prey refuges affecting interactions between piscivorous perch and juvenile perch and roach. Ecology 76:70–81 Pfister C (1996) The role and importance of recruitment variability to a guild of tide pool fishes. Ecology 77:1928–1941 Preisser E, Orrock J, Schmitz O (2007) Predator hunting mode and habitat domain alter nonconsumptive effects in predator—prey interactions. Ecology 88:2744–2751 Polivka K, Chotkowski M (1998) Recolonization of experimentally defaunated tidepool by northeast Pacific intertidal fishes. Copeia 1998:456–462 Prochazka K (1996) Seasonal patterns in a temperate intertidal fish community on the west coast of South Africa. Environ Biol Fish 45:133–140. 185 Prochazka K (1998) Spatial and trophic partitioning in cryptic fish communities of shallow subtidal reef in False bay, South Africa. Environ Biol Fish 51:201–220 Roberts C, Ormond F (1987) Habitat complexity and coral reef fish diversity and abundance on Red Sea fringing reef. Mar Ecol Progr Ser 41:1–8 Rojas J (2005) Influencia de los procesos cognitivos sobre las conductas antidepredatorias y la distribución espacial del ensamble de peces intermareales de Chile central. Ph. D. Thesis, Pontificia Universidad Católica de Chile Sale P (1991) The ecology of fishes on coral reefs. Academic, New York Schmitz O (2008) Effects of predator hunting mode on grassland ecosystem function. Science 319:952–954 Schoener T (1974) Resource partitioning in ecological communities. Science 185:27–39 Shima J (1999) Variability in relative importance of determinants of reef fish recruitment. Ecol Lett 2:304–310 Shima J (2001) Recruitment of a coral reef fish: roles of settlement, habitat, and postsettlement losses. Ecology 82:2190–2199 Sih A (1980) Optimal behavior: can foragers balance two conflicting demands? Science 210:1041–1043 Sih A (1986) Antipredator responses and the perception of danger by mosquito larvae. Ecology 67:434–441 Sih A, McCarthy T (2002) Prey responses to pulses of risk and safety: testing the risk allocation hypothesis. Anim Behav 63:437–443 Sih A, Kats L, Moore R (1992) Effects of a predatory sunfish on the density, drift, and refuge use of stream salamander larvae. Ecology 73:1418–1430 Valeix M, Loveridge A, Chamaillé-Jammes S, Davidson Z, Murindagomo F, Fritz H, Macdonald D (2009) Behavioural adjustments of African herbivores to predation risk by lions: Spatiotemporal variations influence habitat use. Ecology 90:23–30 Varas E, Ojeda F (1990) Intertidal fish assemblages of the central Chilean coast: diversity, abundance and trophic patterns. Rev Biol Mar, Valparaíso 25:59–70 Werner E (1986) Species interactions in freshwater fish communities. In: Diamond J, Case T (eds) Community ecology. Harper and Row, New York, pp 344–358 Werner E, Hall D (1988) Ontogenetic habitat shifts in bluegill—the foraging rate predation risk trade-off. Ecology 69:1352–1366 Werner E, Gilliam J, Hall D, Mittelbach G (1983) An experimental test of the effects of predation risk on habitat use in fish. Ecology 64:1540–1548 Yoshiyama R (1981) Distribution and abundance patterns of rocky intertidal fishes in central California. Environ Biol Fish 6:315–332.
(12) Reproduced with permission of the copyright owner. Further reproduction prohibited without permission..
(13)
Figure

+2
Documento similar
