TítuloGenetic programming to improvement FIB model: bond and anchorage of reinforcing steel in structural concrete
8
0
0
Texto completo
(2) 1 Introduction Since the dawn of the 20th century, when Abrams’s tests were performed, the bond between concrete and steel led to numerous scientific papers, complex laboratory tests and many approaches of structural codes. There are very few expressions that are so different when comparing the various rules, such as those aimed at predicting the anchorage length of reinforcing bars in structural concrete. Two main lines were created starting from the works carried out by Orangun, Jirsa & Breen [1], precursors of the ACI code equation, and the studies performed by Tepfers [2], which inspired the guidelines of the Model Code, leading to the Eurocode. The tests carried out in Spain also were of great importance, as they gave rise to a specific formulation, extremely conservative for large-diameter reinforcement. Despite the varied approaches, the three lines have a common nexus: the proposals are developed from the experimental evidence. From a basic expression of bond stress, dependent on a main variable are incorporated as a multiplicative factor the effect of other variables When a pull-out test is performed, a state of radial tension is generated around the bar that can cause damage to the surrounding concrete. The damage can be mitigated by the placement of transverse reinforcement, and having adequate cover bar. Figure 1 shows graphically the phenomenon of a bar anchorage [3].. Fig. 1. Phenomenon of a bar anchorage. Various factors affect the bond capacity. They are generally associated with different origins: the materials used, the geometric conditions and, finally, the applied loads. The design equations for the anchorage length determination are based in the basic straight anchorage length necessary to reach the break of the bar. On this equation, of experimental base, are added the effects of other variables, also obtained experimentally [1],[4].. 2 FIB Model The workgroup TG4.5 of the Fédération Internationale du Beton (FIB) [5] has been working for a long time in the analysis of the anchorage and the bond characteristics of reinforcement steel bars. Based in the works of Canbay and Frosch [6], the group has proposed two equations: the version 2006 (1) and the current version employed in the development of the Model Code 2010 (2), that provides the work stress that can be reached on an anchored bar. This equation depends on the parameters seen until now and is protected by a contrast with a strong experimental database. The variables described in both formulas correspond to the bond stresses (σsu), compressive strength in cylindrical specimen (fc), diameter of the bar (db), length of anchored bar (ls), maximum and minimum coatings of the bar (cmin, cmax) and the contribution of the transverse reinforcement (Ktr)..
(3) 20 0.2 𝑙𝑠 0.55 𝑐𝑚𝑖𝑛 0.33 𝑐𝑚𝑎𝑥 0.1 𝜎su = 25 ∗ 𝑓𝑐0.25 ∗ ( ) ∗ ( ) ∗( ) ∗( ) ∗ (1 + 10 ∗ 𝐾𝑡𝑟 ) 𝑑𝑏 𝑑𝑏 𝑑𝑏 𝑐𝑚𝑖𝑛 𝜎su. 𝑓𝑐 0.25 20 0.2 𝑙𝑠 0.55 𝑐𝑚𝑖𝑛 0.33 𝑐𝑚𝑎𝑥 0.1 = 54 ∗ ( ) ∗( ) ∗( ) ∗ [( ) ∗( ) + 8𝐾𝑡𝑟 ] 20 𝑑𝑏 𝑑𝑏 𝑑𝑏 𝑐𝑚𝑖𝑛. (1). (2). 2.1 Dataset The database currently contains data (variables and results measured or calculated) corresponding to 813 trials. As will be applied GP techniques for analysis, so that the database range is consistent and frequencies of each of the data must be analyzed. Considering the frequency histogram data, several filters are applied and are accepted those recommended by the FIB [5]. One of the most important is related to the output data σsu, the stress reached by the bar during the test. Since any bar limits its maximum stress fy, the maximum value that can take the relationship σsu/fy is 1.05. In other variables their relative values are also limited, for example those related to the concrete cover. Thus, filters over cmin/cmax and cmin/db are applied. Table 1 shows the parameters used for filtering and the filter finally applied.. Table 1. Filters applied to the dataset Variables. Filter. fc db ls Cb cmin/cmax cmin/db σsu /fy. >15 and <115 MPa < 37 mm < 2100 mm <136 mm ≥ 1.0 and ≤ 5.0 ≥ 0.5 and ≤ 3.0 ≤ 1.05. After applying the filter, the BD is reduced to a total of 628 trials, of which 77.5% (487 trials), by random selection, are used for training, dedicating the remaining 22.5% (141 trials) to check. Table 2 shows the final range of the data in each of the subsets set (training and verification). On the BD filtered FIB expressions produce results whose accuracy is presented in the following sections.. Table 2. Distribution of data in subsets defined over the BD filtered Training (#487). ls (mm) db (mm) cmin (mm) cmax (mm) fc (MPa) Ktr σsu. Test (#141). Min. Max. Min. Max. 50 8 8 20 15 0 126. 2095 35.81 76 140 114 0.114 788. 120 10 8 20 20 0 182. 2032 35.81 76 140 110 0.106 814.
(4) 3 Method The method followed is oriented to improving the FIB equations developed for predicting the stress of bar anchored. The method used follows the same guidelines referred to in the paper developed by Pérez et al [7]. In summary, the method is based on GP techniques, imposing some restrictions based on knowledge of the problem provided by an expert. Symbolic regression data is one of the capabilities provided by the GP. Having a data set (input-output), the GP is able to relate these data algebraically by an equation. Its complexity may vary, and dimensional integrity is not guaranteed. This technique, applied in many cases in civil engineering, is one of those followed by Ashour al [8], for example, to predict shear strength in concrete beams. Naturally, the form of the equations obtained is very different from the ones in the common codes. The presented method improves the terms accepted by the scientific community, getting a better fit when the results are applied to a database. It starts from the expression FIB-2006, because it shows better results over the database. The search expression will determine the bar stress predicted (spred) to be compared with the real stress test (σtest). Firstly, it is necessary to define how individuals will be evaluated in the fitness function (equation 4). In this equation, σtest is the bar stress at failure, α is the parsimony coefficient, si is the number of nodes in the expression and n is the number of cases of the database. It should set the parameters pi and lbias defined in equation 3. After performing several tests, was adopted lbias = 1.0, and equation 4 shows the value of pi (DP). This equation is based on the use of the technique of "demerit points".. 𝑓𝑖𝑡𝑛𝑒𝑠𝑠(𝑖) =. ∑ ∗ |𝑙𝑏𝑖𝑎𝑠 − 𝑛 16, 8, 4,. 𝑛. 𝐷𝑃 = ∑. 𝑖=1. 2,. 𝑝𝑖 , 𝑝𝑖 =. 0, 3, {. 6,. 𝜎𝑡𝑒𝑠𝑡 | 𝜎𝑝𝑟𝑒𝑑. + 𝛼 ∗ 𝑠𝑖. 𝜎𝑡𝑒𝑠𝑡 < 0.5 𝜎𝑝𝑟𝑒𝑑 𝜎𝑡𝑒𝑠𝑡 0.5 ≤ < 0.67 𝜎𝑝𝑟𝑒𝑑 𝜎𝑡𝑒𝑠𝑡 0.67 ≤ < 0.85 𝜎𝑝𝑟𝑒𝑑 𝜎𝑡𝑒𝑠𝑡 0.85 ≤ < 1.0 𝜎𝑝𝑟𝑒𝑑 𝜎𝑡𝑒𝑠𝑡 1.0 ≤ < 1.3 𝜎𝑝𝑟𝑒𝑑 𝜎𝑡𝑒𝑠𝑡 1.3 ≤ <2 𝜎𝑝𝑟𝑒𝑑 𝜎𝑡𝑒𝑠𝑡 ≥2 𝜎𝑝𝑟𝑒𝑑. (3). (4). The technique was adapted for “oriented” searches were possible, with different purposes. The orientation was introduced through impositions or restrictions, which include: restriction on the type of functions that link the variables preferred selection of individuals with the highest ratios σtest/σpred. From the structural point of view, is much more appropriate this option for safety reasons.
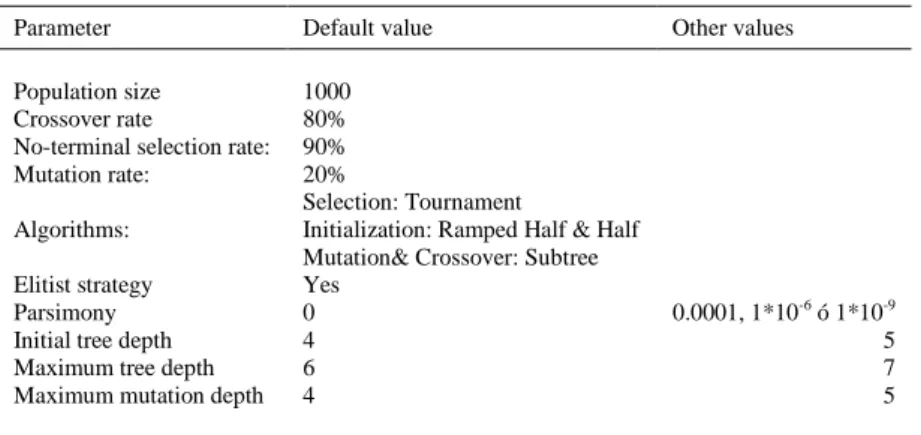
(5) The method used starts with the establishment of a “framework” from wich genetic programming will make the evolutive process, taking into account the restrictions and impositions. The framework is defined directly from the equation FIB-2006, which is divided into subexpressions. Also, each subexpression is written indicating which factor (branch) may change in the search process. The working lines can find: The optimization of the numerical coefficients of the equation. The branches will be Real values The introduction of a new subexpression. This can be a Real number or a function (new branch) linked to a variable As mentioned, in this type of model is very important that the predicted stress is equal to or greater than the actual value. In general, if an individual differs from the real value is penalized during training. From a mathematical point of view, S values equal to 0.5 or 1.5 should be penalized equally. To take into account the structural safety, the individual 0.5 should be penalized more than the individual 1.5, as it causes structural insecurity (collapse). This is achieved through the technique of demerit points, whereby the error of the expression is weighted according to the ranges defined by Pérez [9]. The fitness function (3) shows how the pi factor weights the prediction error, according to the intervals and values of the equation (4). The method used starts with the establishment of a “framework” about whom genetic programming will make the evolutive process, taking into account the restrictions and impositions. Such “framework” is based on the 2006 FIB formulation, about which it will be introduced new variables or its coefficients will be modified. In the searching process it has been proposed three basic equations (5)(6)(7). Each branch is designated as Bi. Table 3 shows the default settings implemented, based on the initial tests. The input data have not been standardized, so expressions can be used directly.. Table 3. Parameters used Parameter. Default value. Other values. Population size Crossover rate No-terminal selection rate: Mutation rate:. 1000 80% 90% 20% Selection: Tournament Initialization: Ramped Half & Half Mutation& Crossover: Subtree Yes 0 4 6 4. 0.0001, 1*10-6 ó 1*10-9 5 7 5. Algorithms: Elitist strategy Parsimony Initial tree depth Maximum tree depth Maximum mutation depth.
(6) 𝑙𝑠 𝐵4 𝑐𝑚𝑖𝑛 𝐵5 𝑐𝑚𝑎𝑥 𝐵6 𝐵 𝜎𝑠𝑢 = 𝐵1 2 ∗ 𝑓𝑐 𝐵3 ∗ ( ) ∗ ( ) ∗( ) ∗ (1 + 𝐵7 ∗ 𝐾𝑡𝑟 )𝐵9 𝑑𝑏 𝑑𝑏 𝑐𝑚𝑖𝑛. (5). 𝜎𝑠𝑢 = 𝑙𝑠 𝐵1 ∗ 𝐵2 ∗ (1 + 𝐵3 ∗ 𝐾𝑡𝑟 )𝐵4. (6). 𝐵3 𝐵4 𝑙𝑠 𝐵5 𝑐𝑚𝑖𝑛 𝐵6 𝑐𝑚𝑎𝑥 𝐵7 𝜎𝑠𝑢 = 𝐵1 ∗ 𝑓𝑐 𝐵2 ∗ ( ) ∗ ( ) ∗ ( ) ∗( ) ∗ (1 + 𝐵8 ∗ 𝐾𝑡𝑟 )𝐵9 𝑑𝑏 𝑑𝑏 𝑑𝑏 𝑐𝑚𝑖𝑛. (7). By default, addition, subtraction, multiplication and protected division were chosen as operators or non-terminal nodes. Variables from the data set (ls, db, cmin, cmax and fc), and integers in the range [-10, 10] were adopted as terminal nodes. Constraints over the equations are showed in table 4. Equation (5) have three types of constraints (“A”, “B” and “C”), the constraint “D” is imposed to equation (6) and finally the constraint “E” is imposed to equation (7).. Table 4. Constraints Eq.. Const.. (5). A. (5). B. (5). C. (6). D. (7). E. B1. B2. B3. B4. B5. B6. B7. B8. ls db cmin cmax fc db cmin cmax fc db cmin cmax fc Const. 2 dec. Const. 2 dec.. Const. 2 dec. Const. 2 dec. Const. 2 dec. db cmin cmax fc Const. 2 dec.. Const. 2 dec. Const. 2 dec. Const. 2 dec Const. 2 dec Const. 2 dec.. Const. 2 dec. Const. 2 dec.. Const. 2 dec. Const. 2 dec. Const. 2 dec. Const. 2 dec. Const. 2 dec. Const. Ent.. Const. 2 dec. Const. 2 dec. Const. 2 dec. Const. 2 dec. Const. 2 dec. Const. 2 dec. 0.5 Const. 2 dec Const. 2 dec.. B9 -. -. -. -. -. -. Const. 2 dec.. Const. 2 dec.. Const. 2 dec.. Const. 2 dec.. Const. 2 dec.. 4 Results In total, more than 4,500 executions were carried out. The results are analyzed essentially through the following indicators: COV (variation coefficient), σtest/σpred , R2 (square root of Pearson product-moment correlation coefficient), MSE (mean square root error), ME (mean error), and finally demerit points calculated according to equation (4). According to the best results, a select group of equations was chosen. If the denominator could be negative, expressions containing function "protected division" were rejected. Also too complex equations were also discarded. PG_9RSC4 (8), PG_8v2R5 (9), PG_7v3F2 (10), PGcc6 (11) were more accurate equations. Since not provide substantial improvements, these equations do not contain the derivatives of the classic GP. The results are shown in Table 5. The significant improvement achieved is evident by comparing the results of the equations FIB..
(7) Table 5. Results. COV σtest/σpred Max (σtest/σpred) Min (σtest/σpred) R2 MSE ME DP. FIB (2006). FIB CM2010. PG_7v3F2. PG_8v2R5. PG_9RSC4. PGcc6. 15.683 0.9712 1.5091 0.4990 0.7095 4215 51.26 2642. 16.010 0.9748 1.5367 0.4885 0.6938 4343 52.19 2646. 14,404 1,0254 1,5228 0,5702 0,7545 3551 46.08 2398. 14,900 1,0082 1,5119 0,5137 0,7400 3608 47.24 2492. 15,239 0,9994 1,4815 0,5016 0,7271 3740 48.10 2508. 15,442 1,0079 1,5684 0,4873 0,7193 3847 48.40 2486. Some of the expressions stand out by different appearances. PG_9RSC4 is a simple improvement of the FIB equation, achieved with better adjusts of the exponents and constants. To clear the value of the length, it is necessary to impose conditions to the search, proposing a first free function, not dependent on the length, and a adjust coefficient for the rest of parameters: the equation PG_8v2R5 arises this way. The marked tendency that exhibits the exponent (ls/db) to the value 0.5, induces a new group of executions in which this constant is fixed. With this procedure, the PG_7v3F2 equation is obtained, achieving a very noticeable distribution. 29 0.23 𝑙𝑠 0.47 𝑐𝑚𝑖𝑛 0.16 𝑐𝑚𝑎𝑥 0.13 𝑃𝐺9𝑅𝑆𝐶4: 𝜎𝑠𝑢 = 27 ∗ 𝑓𝑐 0,27 ∗ ( ) ∗( ) ∗( ) ∗( ) 𝑑𝑏 𝑑𝑏 𝑑𝑏 𝑐𝑚𝑖𝑛 ∗ (1 + 286 ∗ 𝐾𝑡𝑟)0.11. (8). 𝑐𝑚𝑎𝑥 𝑓𝑐 150 𝑙𝑠 0.49 𝑐𝑚𝑖𝑛 0.29 𝑐𝑚𝑎𝑥 0.04 𝑃𝐺8𝑣2𝑅5: 𝜎𝑠𝑢 = ( − + + 19.294) ∗ 𝑓𝑐 0.29 ∗ ( ) ∗( ) ∗( ) 36 36 𝑐𝑚𝑖𝑛 𝑑𝑏 𝑑𝑏 𝑐𝑚𝑖𝑛 ∗ (1 + 239.29 ∗ 𝐾𝑡𝑟)0.12. (9). 48 𝑓𝑐 − 44 𝑙𝑠 0.5 𝑐𝑚𝑖𝑛 0.34 𝑐𝑚𝑎𝑥 0.01 0.5 =( − + 9) ∗ 𝑓𝑐 ∗ ( ) ∗ ( ) ∗( ) 𝑐𝑚𝑖𝑛 𝑐𝑚𝑖𝑛 + 20 𝑑𝑏 𝑑𝑏 𝑐𝑚𝑖𝑛 48 ∗ (1 + 173 ∗ 𝐾𝑡𝑟)0.14. (10). 75 19 𝑓𝑐 𝑐𝑚𝑎𝑥 ∗ 𝑓𝑐 𝑃𝐺𝑐𝑐6: 𝜎𝑠𝑢 = 𝑙𝑠 0.5 ∗ (( + ) ∗ ( + + 2)) ∗ (1 + 165 ∗ 𝐾𝑡𝑟)0.15 𝑑𝑏 7 5 ∗ 𝑑𝑏 360 ∗ 𝑑𝑏. (11). 𝑃𝐺7𝑣3𝐹2: 𝜎𝑠𝑢. In the last remarkable groups, it is allowed the apparition of a free function (without ls) that multiplies ls with constant exponent and the classical term of transversal reinforcement contribution, improved with constants. This is the PGcc6 expression, which exhibit a strong concentration around the unit. Next, the stresses that can be developed for some specific variables are compared in two of the equations found against the FIB deduced expressions. It can be observed the similarity of the approach, even for equations that are not born from the structure of the FIB. As a result of the previously exposed, it can be recommended to adopt the expression PG_7v3F2 as a good equation to get the bond behavior of the passive reinforcement in a concrete element..
(8) 5 Conclusions FIB equation to determine rebar tension stress was improved with the application of heuristic techniques. In the applied method, structural safety was taken into account, through the weighting provided by demerit points As a final conclusion and summary it should be noted that it has managed to implement a novel method based on genetic programming to extract knowledge from experimental data based on the experience. This experience is implemented through constraints that are induced in the algorithm.. Acknowledgements. This work was partially supported by the Spanish Ministry of Science and Innovation (Ref. BIA2010-21551) and grants from the Ministry of Economy and Industry (Consellería de Economía e Industria) of the Xunta de Galicia (Ref. 10MDS014CT, Ref. 10TMT042E, Ref. 10TMT118004PR and Ref. 10TMT034E).. References 1. Orangun, C.O., Jirsa, J.O., Breen, J.E.: A Reevaluation of Test Data on Development Length and Splices. ACI Journal 74(11), 114–122 (1977) 2. Tepfers, R.A.: Theory of bond applied to overlapped tensile reinforcement splices for deformed bars Ph.D. Thesis, Division of concrete structures, Chalmers University of Technology. Gothenburg, Sweden (1973) 3. Cairns, J.: Model for strength of lapped joints and anchorages. Paper presented at the meeting of the TG group 4.5 of the International Federation for Structural Concrete, Stuttgart, Germany (2006) 4. Abrams, D.A.: Tests of Bond Between Concrete and Steel. University of Illinois Bulletin Nº 71. University of Illinois, Urbana (1913) 5. FIB Task Group 4.5 “Bond models” (s.f) (2007), http://fibtg45.dii.unile.it/ (January 25, 2013) 6. Canbay, E., Frosch, R.: Bond strength of lap-spliced bars. ACI Structural Journal 102(4), 605–614 (2005) 7. Pérez, J.L., Cladera, A., Rabuñal, J.R., Martínez-Abella, F.: Optimization of existing equations using a new genetic programming algorithm: Application to the shear strength of reinforced concrete beams. Advances in Engineering Software 50(1), 82–96 (2012) 8. Ashour, A.F., Alvarez, L.F.: Toropov VV.: Empirical modeling of shear strength of RC deep beams by genetic programming. Computers & Structures 81(5), 331–338 (2003) 9. Pérez, J.L.: Metodología para orientar procesos de extracción de conocimiento basados en Computación Evolutiva. Aplicación al desarrollo de modelos y formulaciones en el ámbito del hormigón estructural, Ph.D. Thesis, Department of Information and Communication Technologies, University of A Coruña (2010).
(9)
Figure
![Figure 1 shows graphically the phenomenon of a bar anchorage [3].](https://thumb-us.123doks.com/thumbv2/123dok_es/7236548.432048/2.892.175.737.497.586/figure-shows-graphically-phenomenon-bar-anchorage.webp)


Documento similar
In most cases, simplified assumptions made in the preliminary considerations (pre- emptive yielding of steel, concrete and steel failure in unconfined and confined
Parameters of linear regression of turbulent energy fluxes (i.e. the sum of latent and sensible heat flux against available energy).. Scatter diagrams and regression lines
In the previous sections we have shown how astronomical alignments and solar hierophanies – with a common interest in the solstices − were substantiated in the
It might seem at first that the action for General Relativity (1.2) is rather arbitrary, considering the enormous freedom available in the construction of geometric scalars. How-
Even though the 1920s offered new employment opportunities in industries previously closed to women, often the women who took these jobs found themselves exploited.. No matter
In the preparation of this report, the Venice Commission has relied on the comments of its rapporteurs; its recently adopted Report on Respect for Democracy, Human Rights and the Rule
In the evaluation of pipes of carbon steel used for the supply of potable water are detected structural problems in the SAE 1018 carbon steel, with which were manufactured
In the “big picture” perspective of the recent years that we have described in Brazil, Spain, Portugal and Puerto Rico there are some similarities and important differences,
