Mathematics teachers’ ideas about mathematical models: a diverse landscape
28
0
0
Texto completo
(2) A. Bautista, et al.. 2. In many countries, mathematics teachers are increasingly required to teach modeling to students. After decades of discussion (Blum, 2002), the mathematics education community agrees on the importance of modeling at all educational levels (including the middle school level, which is the focus of this study). Indeed, mathematical modeling is today considered a 21st century skill (English & Sriraman, 2010). Enabling students to explore relations between mathematics and the real world is an explicit goal in many mathematics curricula (e.g., Common Core State Standards Initiative, 2012; National Council of Teachers of Mathematics [NCTM], 2000). Considerable research has been devoted to explore how mathematics teachers from different grade levels solve modeling problems (Blum & Borromeo Ferri, 2009; Verschaffel, De Corte, & Borghart, 1997) and to describe their beliefs and conceptions of the role of modeling activities in the classroom (Kaiser & Maaß, 2007). However, little is known about how teachers themselves describe or characterize mathematical models. This paper describes some of the ideas middle school mathematics teachers have regarding (a) what constitutes a mathematical model of a real-world phenomenon, and (b) what are relationships between models and empirical data. Moreover, the paper explores how teachers’ ideas differ depending on their educational background. We analyzed the written responses that 56 in-service mathematics teachers gave to three open-ended questions. We found considerable diversity in how teachers described mathematical models and their relationship to real-world data, both within and across different educational backgrounds. We argue that explicitly leveraging such diversity can enrich teacher development by highlighting the contextual and iterative nature of mathematical modeling.. DEFINING MODELING AND MODELS IN MATHEMATICS EDUCATION Defining modeling in mathematics education is a complex task. Most mathematicians, scientists, and engineers would agree that modeling involves using mathematics to distill key elements of real-world phenomena in order to articulate the relationships among these elements (Spandaw, 2011). While there is relative agreement about this core idea in mathematics education, there is less agreement about other aspects relevant to how mathematical models and modeling are defined in educational settings (Lesh & Lehrer, 2003). A recent discussion by Kaiser and Sriraman (2006) has gone so far as to describe different perspectives toward mathematical modeling in the current international research literature as “quasi polarising” (p. 305). For example, there is little agreement regarding what constitutes necessary, sufficient, or desirable aspects of modeling activities. Some educators, researchers, and policymakers see modeling activities as synonymous to word problems (Verschaffel et al., 1997), while others argue modeling should involve ill-defined situations (Greer, 1997). Some think that modeling should help students develop skills to mathematize phenomena, whereas others go further and propose that modeling should provide stuPNA 9(1).
(3) Mathematics teachers’ ideas about mathematical models…. 3. dents with a deeper understanding of phenomena themselves (Kaiser, Blum, Borromeo Ferri, & Stillman, 2011). Moreover, some scholars emphasize the situated social and representational aspects of working with data (Lehrer & Schauble, 2004), while others see modeling as a means to develop generalizable mathematical knowledge (Gravemeijer, 1999). There is also lack of agreement about what the primary objectives of modeling education should be in school mathematics. There are arguments for its pedagogical utility (Gilat & Amit, 2013), interdisciplinarity (Vahey, Rafanan, Patton, Swan, Hooft, Kratcoski et al., 2012), and illumination of key mathematical structures and theories (Gravemeijer & Doorman, 1999). These different objectives influence what features of mathematical modeling educators emphasize, and what types of modeling activities they propose and/or use. This diversity of perspectives and approaches to modeling in mathematics education is in some ways necessary, because the very premise of modeling is that context matters. The situation at hand, the problem to be solved, and tools and knowledge available to a given learner all play a crucial role in how one chooses to represent and explore a situation using mathematics. But this diversity also means that mathematical modeling can appear underspecified to teachers, who are likely to engage with multiple—perhaps conflicting—definitions of mathematical modeling in their own preparation and practice. Defining mathematical model is equally complex. Several definitions have been proposed by educational researchers. For example, Niss (1989) defines mathematical model as a combination of one or more mathematical “entities,” whose relationships are chosen to represent aspects of a real-world situation. In a similar vein, Lesh and Doerr (2003) argue that models are conceptual systems expressed using external representations, serving as vital tools to construct, define, and explain other systems. These definitions elaborate on models’ representational nature (Janvier, 1987; Rico, 2009), and emphasize that models embody the decisions modelers make during the modeling process. Mathematical models need to be externalized throughout one or more forms of representations (e.g., symbolic-algebraic notation, graphics, pictorial representations). These representations need to be purposely chosen and displayed, in such a way that allows modelers to highlight what they identify as the most important variables and relationships of the phenomenon under study. Deciding what is and is not important constitutes one of the main tasks involved in modeling. Thus, the external representation of mathematical models may substantially vary depending on the final goals, preferences, and/or biases of their creators. Our own perspective toward mathematical modeling and models is dynamic in nature (Pozzi, Noss, & Hoyles, 1998). We understand modeling to be a rather messy process in which a modeler mathematizes key elements of a real-world or theoretical situation, establishing connections among quantities that reflect the system based on his or her mathematical and non-mathematical knowledge. Mathematical models can be externalized by means of multiple kinds of representations. These external representations allow the modeler to better understand the situation at hand, describe the situation in more detail, explain underlying mechanisms and/or predict what will hapPNA 9(1).
(4) A. Bautista, et al.. 4. pen in future situations, and communicate information about the situation to others. We agree with Blum and Niss (1991, p. 39) that modeling does not merely yield a “simplified but true” representation of reality, but rather reflects one’s own background knowledge, interests, and intentions relative to some phenomenon of interest. What constitutes a mathematical model or modeling, therefore, varies across users, contexts, and audiences. Current Challenges for Integrating Modeling into the Mathematics Classroom Research has shown that modeling activities depart from most teachers’ own mathematical preparation, and that even teachers who recognize the value of modeling may be reluctant to engage their students in modeling (Henn, 2010). One challenge is that to support modeling activities in the classroom, teachers require knowledge that goes beyond what is needed for most traditional and even reform-based curricula. Since models can employ a variety of methods and representations, teachers need to encourage and support a variety of potential approaches and to articulate connections across those approaches (Doerr, 2007). Another challenge is that modeling activities are by their nature unpredictable, which requires teachers to be able to react in-situ to ideas put forth by students (Blum & Borromeo Ferri, 2009). This can lead teachers to worry that modeling activities might distract students from learning specific skills or working toward mathematical accuracy (Verschaffel et al., 1997). Modeling activities also depart from typical classroom activities in that they highlight the nontrivial relationship between mathematical tools and practical constraints. Some research suggests that pre-service teachers do not consider mathematical tools such as functions as useful for solving modeling problems (Erdogan, 2010), and that when using mathematical tools teachers overlook pragmatic constraints—for example, by recommending 12.5 buses be rented for a field trip (Verschaffel et al., 1997). These tensions emerge even among teachers with strong mathematics backgrounds (Trelinski, 1983). These challenges are symptomatic of a broader issue related to the nature of mathematics and mathematical learning. Research suggests that many teachers think of mathematics as the application of memorized algorithms and formulae (Szydlik, Szydlik, & Benson, 2003). Kaiser and Maaß (2007) have shown that many teachers hold static beliefs about the nature of mathematical modeling, thinking of it as an exact and formal process, a collection of rules and formulas to be applied. In contrast, teachers with dynamic beliefs think of mathematical modeling as a generative and creative process relevant for society, in which one looks for the best solution to real-life problems (Ainley, 2012). These beliefs can lead to a very different classroom modeling practice than what is intended by current mathematics education curricula (e.g., NCTM, 2000). Teachers’ Ideas about Mathematical Models and Educational Background Existing literature has not yet focused on the relationship between mathematics teachers’ educational background and their ideas about mathematical models. In the field of PNA 9(1).
(5) Mathematics teachers’ ideas about mathematical models…. 5. science education, an interview study conducted by Justi and Gilbert (2003) showed that science teachers’ ideas about the notions of model tended to differ according to their educational backgrounds. For example, most teachers holding a primary education teaching certificate strongly subscribed to everyday views of the notion of model as a reproduction of something or a standard to be followed. Teachers with a degree in biology expressed similar ideas, although they referred to a broader variety of uses of models. Finally, teachers with a background in physics or chemistry discussed the notion of model in more comprehensive ways, consistent with perspectives currently held by scientists and philosophers of science, and emphasized the usefulness of models for making predictions. The educational backgrounds of grades 5-9 mathematics teachers in the United States (US) vary widely, especially because the requirements for licensing mathematics teachers have shifted over the years. Keeping in mind that there are differences across states in the US, here we provide some general characteristics of the current requirements for mathematics teachers. In many states, elementary school teachers hold licenses for grades 1-6. These teachers may teach middle school mathematics (for grades 5 or 6) but may have no formal training in mathematics. On the other hand, in some states, teachers who want to pursue an initial or professional license for grades 5-8 or grades 8-12 need to have completed the equivalent of a bachelor’s degree in mathematics, graduate courses in mathematics, and to have passed the state’s teacher test in mathematics. Therefore, today, we might find two 6th grade teachers with very different backgrounds next to each other in the same building: one may hold an elementary school license and her last mathematics class may have been algebra in high school; the other may hold a middle school license and hold a master’s degree in mathematics. In this study, therefore, we argue that an important consideration in documenting teachers’ ideas about mathematical models is the nature of their educational preparation. Purpose The purpose of this paper is to describe the diversity of ideas middle school mathematics teachers have regarding (a) what constitutes a mathematical model of a realworld phenomenon, and (b) the relationships between models and empirical data. In addition, this paper explores whether and how teachers’ ideas on mathematical models might differ depending on their educational background. Drawing on the assumption that teachers’ ideas about mathematical content are crucial mediators for the way they teach (Sánchez & Linares, 2003), the evidence presented in this paper suggests that teachers with different disciplinary backgrounds may be teaching mathematical models and modeling in different ways. A better awareness of teachers’ diversity of ideas can inform educators as they design programs to prepare mathematics teachers (both pre- and in-service) for an increasingly modeling-focused curriculum.. PNA 9(1).
(6) A. Bautista, et al.. 6. METHOD We now present the context of the study, the participants, the data collection procedure, and the data analysis method. Context for the Research This study was conducted in the context of a professional development program implemented in the Northeast region of the United States, The Poincaré Institute for Mathematics Education (see https://sites.tufts.edu/poincare/). The Poincaré Institute is a Math and Science Partnership (MSP) funded by the National Science Foundation (NSF). With the final goal of enhancing students’ learning and achievement, the Poincaré Institute aims to help grades 5-9 mathematics teachers deepen their own understandings of mathematics and student mathematical thinking. Participating teachers took a series of three graduate level semester-long courses, which covered numerous mathematical topics under the umbrella of algebra and functions, multiple representations, and modeling and applications. A detailed presentation of this professional development program can be found in Teixidor-i-Bigas, Schliemann, and Carraher (2013). Data for this study were gathered three weeks into the first course of the professional development program, as part of the first lesson specifically devoted to mathematical modeling. We surmise that, at the time of data collection, our program had had no impact on teachers’ ideas about mathematical models. The ideas described in this study could therefore be taken as baseline data. Participants Participants were 56 grade 5 to 9 mathematics teachers from nine school districts in the northeastern US. There were 49 female teachers and 7 male teachers, ranging from 26 to 63 years of age. When data were collected, their professional experience as mathematics teachers ranged from 2 months to 28 years. The teachers had a variety of educational backgrounds. For analytical purposes, we considered two groups of teachers in our quantitative comparisons: Math and Others. This grouping allowed us to explore whether and how having an educational background that included formal training in mathematics might have impacted teachers’ ideas about models. This comparison was relevant to us given that our participants were mathematics teachers participating in a mathematics education professional development program. Additionally, in order to obtain a more fine-grained description of the responses gathered, we considered four sub-groups: Mathematics, Mathematics Education, Natural Sciences and Technology, and Social Sciences and Humanities. The criteria used to assign the teachers to the different groups and subgroups were as follows.. PNA 9(1).
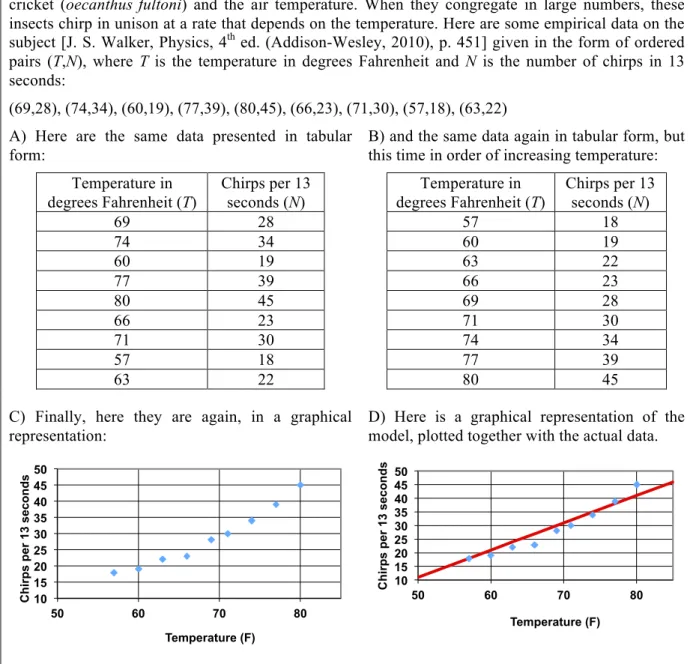
(7) Mathematics teachers’ ideas about mathematical models…. 7. Math This group included those teachers who held a bachelor’s and/or master’s degree in mathematics and/or mathematics education (21 teachers). The two sub-groups were the following ones. Mathematics. This sub-group included those teachers who earned a bachelor’s and/or master’s degree in mathematics (13 teachers). Participants with degrees in mathematics were included in this group. Mathematics Education. This sub-group included those teachers who earned a bachelor’s or master’s degree in mathematics education and did not hold a bachelor’s or master’s degree in mathematics (8 teachers). Others This group included those teachers who did not hold a bachelor’s and/or master’s degree in mathematics or mathematics education (35 teachers). The two sub-groups were the following ones. Natural Sciences and Technology. This sub-group included those teachers who earned a bachelor’s or master’s degree in disciplines such as engineering, chemistry, or dentistry (8 teachers). Social Sciences and Humanities. This sub-group included those teachers who earned a bachelor’s or master’s degree in disciplines such as special education, history, english, literature, or theology (27 teachers). This study was conducted in an action research context, where the main goal was to foster teacher learning and professional development rather than to conduct descriptive research about teachers’ ideas about models. Participants were therefore not selected based on their educational background, but based on other factors such as their motivation and availability to engage in our professional development courses. Despite the opportunistic nature of our sample and the small and uneven size of the different sub-groups, we consider our data to be relevant as they open an interesting conversation in the field of modeling education theory and practice. Our goal is not to make causal claims about the influence of teachers’ educational background on their ideas of mathematical models, but rather to qualitatively describe the diversity of views existing within this group of teachers. Modeling Activity and Target Questions The modeling activity featured in this paper was titled Famous Amos and his Cricket Thermometer (Figure 1; note that the information was displayed differently because the activity was presented online). The activity presents Dolbear’s Law, which describes a linear relationship between the rate of chirping of the snowy tree cricket (N) and air temperature (T). To describe and communicate that relationship, different representations were shown to the teachers: a set of ordered pairs with values for N and T, unordered and ordered tables containing those values, two Cartesian graphs (the first PNA 9(1).
(8) A. Bautista, et al.. 8. containing the data points only, the second also including the line of best fit), a written description of the scenario, and an equation. Famous Amos and his Cricket Thermometer: Using a Function to Model Data Amos Dolbear (1837-1910) […] Today Dolbear is remembered, if he’s remembered at all, mainly for Dolbear’s Law, which expresses the relationship between the rate of chirping of the snowy tree cricket (oecanthus fultoni) and the air temperature. When they congregate in large numbers, these insects chirp in unison at a rate that depends on the temperature. Here are some empirical data on the subject [J. S. Walker, Physics, 4th ed. (Addison-Wesley, 2010), p. 451] given in the form of ordered pairs (T,N), where T is the temperature in degrees Fahrenheit and N is the number of chirps in 13 seconds: (69,28), (74,34), (60,19), (77,39), (80,45), (66,23), (71,30), (57,18), (63,22) A) Here are the same data presented in tabular form: Temperature in degrees Fahrenheit (T) 69 74 60 77 80 66 71 57 63. Chirps per 13 seconds (N) 28 34 19 39 45 23 30 18 22. Temperature in degrees Fahrenheit (T) 57 60 63 66 69 71 74 77 80. 50 45 40 35 30 25 20 15 10 50. 60. 70. 80. Chirps per 13 seconds (N) 18 19 22 23 28 30 34 39 45. D) Here is a graphical representation of the model, plotted together with the actual data. Chirps per 13 seconds. C) Finally, here they are again, in a graphical representation: Chirps per 13 seconds. B) and the same data again in tabular form, but this time in order of increasing temperature:. 50 45 40 35 30 25 20 15 10 50. 60. 70. 80. Temperature (F). Temperature (F). Based on these data, Dolbear proposed a model for the relationship between chirp rate and temperature, expressed in the following formula: N = T - 39 where, again, N is the number of chirps per 13 seconds, and T is the temperature in degrees Fahrenheit.. Figure 1. Modeling activity used in the study Notice that the activity explicitly characterized the equation (N = T 39) as an expression of the model. The list of ordered pairs, tables, and graphs were characterized as. PNA 9(1).
(9) Mathematics teachers’ ideas about mathematical models…. 9. representations. Despite this distinction in the question statement, as we show in the Results section, teachers referred to many entities as models. Finally, the problem drew clear distinctions among the model (i.e., the equation), the representations, and the data. We adopt the perspective that it is useful to think of modeling activities as a continuum along “theory-driven” to “data-driven” situations. Theory-driven situations use models to explain the causal mechanisms of a phenomenon at hand, and thereby to predict the data. For these models, prior understanding of the mechanisms behind the phenomenon is essential. Predicting the trajectory of an object using Newton’s laws of motion would be an example. In data-driven situations, a mathematical function is fitted to represent a mathematical idealization of empirical data, sometimes with little theoretical basis. The resulting model is therefore predictive but not explanatory. While we accept the complex interaction of theory and data in all modeling activity, we consider the activity used in our study a data-driven modeling situation, since the participants had no a priori mechanistic model for how temperature affects the chirping rate of crickets. It was selected precisely because we wanted to use a problem that did not require specialized content knowledge about the phenomenon. The teachers were asked a set of 12 open-ended questions about the representations used in the activity. For this study, we analyzed the three questions that explicitly mentioned “model” and “data”. ♦ Question 1. How would you characterize the relationship between the model and the data? ♦ Question 2. Could you extract the data from the model? ♦ Question 3. Do you think the model conveys more or less information than the data? Why? It is important to clarify that these are not right-or-wrong questions. As justified in the literature review, what constitutes a mathematical model may vary across users, contexts, and audiences (Kaiser & Sriraman, 2006). Consequently, multiple types of responses to these questions might be equally consistent and valid. Our pedagogical goal with these questions was, precisely, to encourage the teachers to think about and discuss the interplay among data, models, and representations. In this paper, we use their responses to explore the diversity of teachers’ views. Data Analysis Teachers’ written responses to each of the three questions were analyzed using content analysis categories. Question 1 categories were non-mutually exclusive, whereas Questions 2 and 3 categories were mutually exclusive. Intra-rater reliability indices (George & Mallery, 2003) were higher than 90% for all three questions.. PNA 9(1).
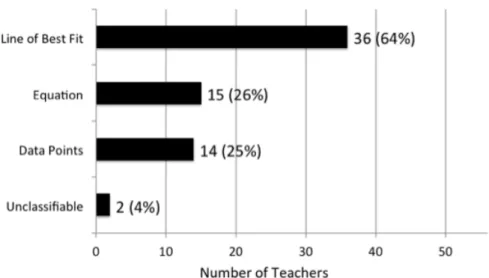
(10) A. Bautista, et al.. 10. RESULTS This section is structured as follows. For each question, we first present the categories of teachers’ responses to each question, organized by sub-groups and categories. Then, we describe the landscape of teachers’ ideas referring to the entire sample of teachers. Examples are provided to illustrate this diversity. Notice that we only present some relevant excerpts, not the entire responses, as responses were often very long. We then present a quantitative comparison across the groups Math and Others. Finally, we present a qualitative description of the most distinctive characteristics of the sub-groups (Mathematics, Mathematics Education, Natural Sciences and Technology, and Social Sciences and Humanities). Additional examples are shown to illustrate the differences among sub-groups. How would you Characterize the Relationship between the Model and the Data? (Question 1) We present in Table 1 the frequencies of teachers’ responses by sub-groups in Question 1. Table 1 Frequencies of Teachers’ Responses in Question 1 N. Line of best fit. Equation. Data points. Unclassifiable. Mathematics. 13. 8. 6. 1. 2. Mathematics Education. 8. 4. 5. 1. 0. Natural Sciences and Technology. 8. 7. 1. 3. 0. Social Sciences and Humanities. 27. 17. 3. 9. 0. Sub-group. Note. The three first categories were non-mutually exclusive because some teachers referred to more than one representation in their responses.. Despite the phrasing of the crickets problem, many teachers expressed very different ways of categorizing the various representations as being the model or belonging to the model. From most to least frequent, they mentioned the line of best fit contained in one of the graphs, the equation, and finally, the data points contained in the graphs (Figure 2). Categories in this figure are non-mutually exclusive. Because some teachers referred to more than one of these representations, we treated them as nonmutually exclusive categories. Other non-graphical representations of the data provided in the problem (list of ordered pairs, tables, etc.) were never characterized as the model, even though they contain the same information (measured values of N and T) displayed in the graphed data points. The responses of two teachers were unclassifiable because they did not answer the question asked.. PNA 9(1).
(11) Mathematics teachers’ ideas about mathematical models…. 11. Figure 2. Number of teachers who referenced each of the representations when characterizing the model of the crickets problem (N = 56) Model as Line of Best Fit The representation most commonly characterized as the model was the line of best fit (responses of 36 teachers, or 64%). Often, as shown below, these responses described the relationship of the line of best fit to the specific data points collected, or noted its utility for making predictions about data that had not been collected and for inferring general trends or patterns. “This model, or line of best fit, gives infinite data points, whereas the original data set had 9 points.” (Math, Mathematics Education) “Dolbear’s model uses the best fit line to define a function between the chirp rate and the temperature.” (Others, Natural Sciences and Technology) “I think the linear line of best fit in red closely models the data points in blue.” (Math, Mathematics) Model as Equation Even though the problem explicitly described the equation (N = T - 39) as the model, only 15 teachers (27%) characterized the equation as the model. In some of these responses (see below), the equation was referred to using the terms formula, algebraic expression, and function. “Dolbear proposed a model for the relationship between chirp rate and temperature, expressed in the following formula: N = T - 39 has a very close relationship to the actual data values.” (Math, Mathematics Education) “The N = T - 39 model assumes that the number of chirps is consistently 39 less than the temperature.” (Others, Social Sciences and Humanities). PNA 9(1).
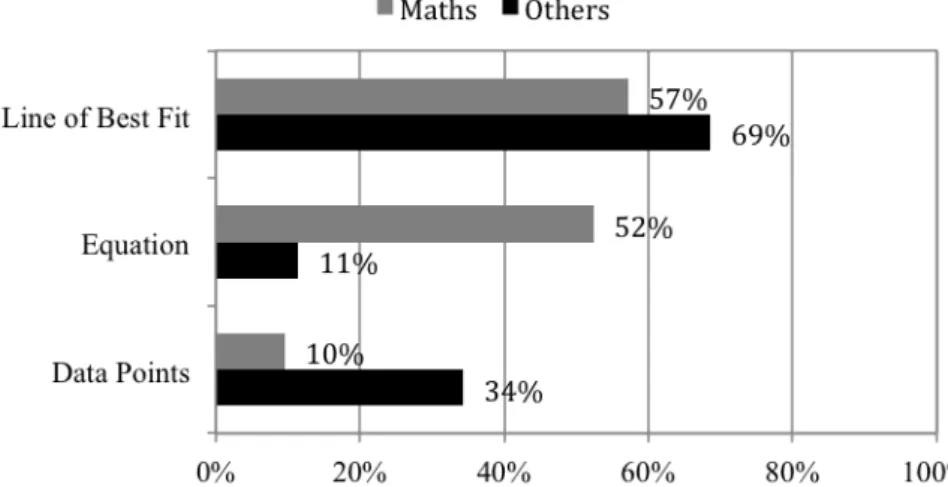
(12) A. Bautista, et al.. 12. Data Points as the Model (or Part Thereof) Finally, 14 teachers (25%) explicitly mentioned the data itself as being the model or part of the model. The following are examples of those statements. “The model is displaying the data in a scatter plot graph that includes a best fit line.” (Others, Natural Sciences and Technology) “Dolbear’s model involves graphing the data points and finding the equation of the line of best fit.” (Math, Mathematics Education) Quantitative Comparisons across Educational Backgrounds (Math vs Others) We found interesting differences in how teachers responded to this question depending on their educational background (Figure 3). The equation N = T - 39 was referred to as the model by more teachers from the Math group (11 teachers, 52%) than from the Others group (4 teachers, 11%). In contrast, the data points were referred to as the model⎯or as part of the model⎯by more teachers from the group Others (12 teachers, 34%) than from the group Math (2 teachers, 9%). Finally, the line of best fit was referred to as the model by teachers from both groups. Percentages in Figure 3 refer to the total N in each sub-group (Math = 21; Others = 35).. Figure 3. Comparison for educational background in Question 1 Qualitative Description of Differences across Educational Backgrounds Our qualitative analysis of the responses suggested that the teachers in the Mathematics sub-group analyzed Dolbear’s model from an abstract and formal perspective. Many of these teachers explained that the model was an idealization of the observations gathered from nature, thereby acknowledging the tensions between mathematics and the natural world. In addition, they frequently referred to the constraints and limitations of Dolbear’s model. For example, some teachers mentioned the need to specify the domain and range of the model, given that crickets would die under extreme temperatures.. PNA 9(1).
(13) Mathematics teachers’ ideas about mathematical models…. 13. We can use this equation to predict the number of chirps at different temperatures, but the values will not all match the original data that was gathered. The data clearly has a range between 57° and 80° which makes me wonder what would happen above and below those temperatures. (Math, Mathematics) Teachers trained in mathematics education tended to characterize Dolbear’s model as a simplified image of the relationship between the data points. As shown below, they also tended to highlight the advantages of having models such as providing a general understanding of the data, visualizing general patterns and trends, and helping us predict and estimate. “It [the graphed line] simplifies the data in a way that allows you to make sense of it, and make predictions from it.” (Math, Mathematics Education) “The model describes the pattern observed within the data.” (Math, Mathematics Education) “The model looked for a pattern in the data. On the chart the dots seem to show this pattern. You can see a line that establishes a general rule for the number chirps to the temperature. It varies slightly from the data.” (Math, Mathematics Education) “Models are useful representations that are valid within a range and demonstrate that trend that the data takes.” (Math, Mathematics Education) The teachers with backgrounds in natural sciences and technology tended to show greater awareness of the actual phenomenon under study, the limitations of empirical data, and the tentative nature of the proposed model. They elaborated on the supposedly linear relationship existing between T and N, describing aspects such as the strength of the relationship, domain and range, presence of outliers, and other factors that might affect the relationship between the two variables involved in the scenario at hand. These descriptions were substantially more detailed than the descriptions provided by the three other sub-groups. The relationship between the model and data is strong. The model provides both a rule and a visual showing that the relationship is a positive correlation: as the temperature increases, the number of chirps heard per 13 seconds also increases. (Others, Natural Sciences and Technology) The model is displaying the data in a scatter plot graph that includes a “best fit” line. Scatter plots show the relationship between two variables by displaying data points on a two-dimensional graph. They provide the following information about the relationship between two variables: strength; shape (linear, curved, etc.); direction (positive or negative or neither); presence of outliers (data that falls outside the normal range). This particular model shows that the relationship between the two variables is linear and there is a positive correlation between N and T. This means that when T (temperature). PNA 9(1).
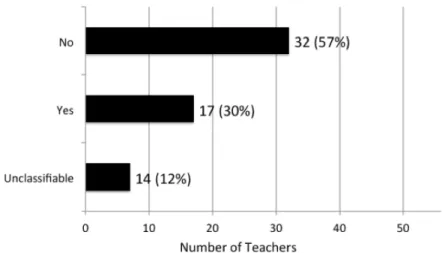
(14) A. Bautista, et al.. 14. increases, then N (number of chirps in 13 seconds) increases. (Others, Natural Sciences and Technology) Finally, the teachers with backgrounds in social sciences and humanities tended to focus attention on the exactness of Dolbear’s model. There were differing opinions about whether a linear function was appropriate to model the data. Most teachers who addressed this issue argued that a straight line was not exact enough because most data points given did not fall on the line of best fit. As shown below, these teachers stressed that models should be able to produce exact results (ideally the same results as those gathered from nature). “We probably won’t be able to prove that Dolbear’s model is exact (in fact, it isn’t exact) but it isn’t wrong yet according to what scientists are currently collecting as data.” (Others, Social Sciences and Humanities) “I would characterize the relationship between the model and the data as not exact… When you look at the model some of the data points will intersect the line but not all.” (Others, Social Sciences and Humanities) Could you Extract the Data from the Model? (Question 2) We present in Table 2 the frequencies of teachers’ responses by sub-groups in Question 2. Table 2 Frequencies of Teachers’ Responses in Question 2 Sub-group. N. No. Yes. Unclassifiable. Mathematics. 13. 11. 2. 0. Mathematics Education. 8. 5. 1. 2. Natural Sciences and Technology. 8. 2. 4. 2. Social Sciences and Humanities. 27. 14. 10. 3. Note. Categories are mutually exclusive.. We found differing ideas regarding the possibility of extracting the original data from the model, which were consistent with the differences, identified in Question 1, as to whether the data points themselves were part of the model (Figure 4). Although categories used to analyze teachers’ responses were mutually exclusive, their reasons revealed disparate ideas of what constitutes the model, which did not always map onto those categories. For example, some teachers said no, because they understood the model to be the linear relationship expressed by the equation, which could not predict the actual data points. Others understood the model to include the data points, but felt they could not read the actual numbers accurately from the graph. Still others agreed that the model included the data points, but answered yes because they thought it was PNA 9(1).
(15) Mathematics teachers’ ideas about mathematical models…. 15. possible to read the values from the graph. The categories displayed in Figure 4 are mutually exclusive.. Figure 4. Number of teachers per type of response (N = 56) No, the Data cannot be Extracted from the Model The majority of teachers (32, or 57%) answered the question negatively, that is, they did not consider the data points shown in the graphs as the model or part of the model (see example below). As will be seen later on, some teachers were more emphatic than others and the justifications provided were different. “No. You cannot extract the exact data points from the model since not all points are on the trend line.” (Math, Mathematics Education) Yes, the Data can be Extracted from the Model Fewer teachers, though still a sizeable minority (17, or 30%), gave affirmative responses; that is, they considered the data points presented in the graphs as the model or part of the model. Given that these data points were not labeled, some teachers expressed that extracting them would require to approximate their values. As shown below, other teachers expressed that the line of best fit could also be used to infer approximations to the data and acknowledged that approximations might not be exact. “Yes, you can extract the data from the model because it exists in the set of points plotted. While it may not be on the line in the model, the data points still exist on the graph.” (Others, Social Sciences and Humanities) Unclassifiable: Neither Yes or No Finally, seven teachers (13%) provided responses that could not be classified within the two categories above for not providing explicit affirmative or negative answers. Interestingly, these teachers frequently used the person (I) in their responses to indicate that extracting the data from the model might be possible in principle but would be challenging for them; for example, because it is difficult to read precise numerical values from a graph. The following are two examples of that kind of statement.. PNA 9(1).
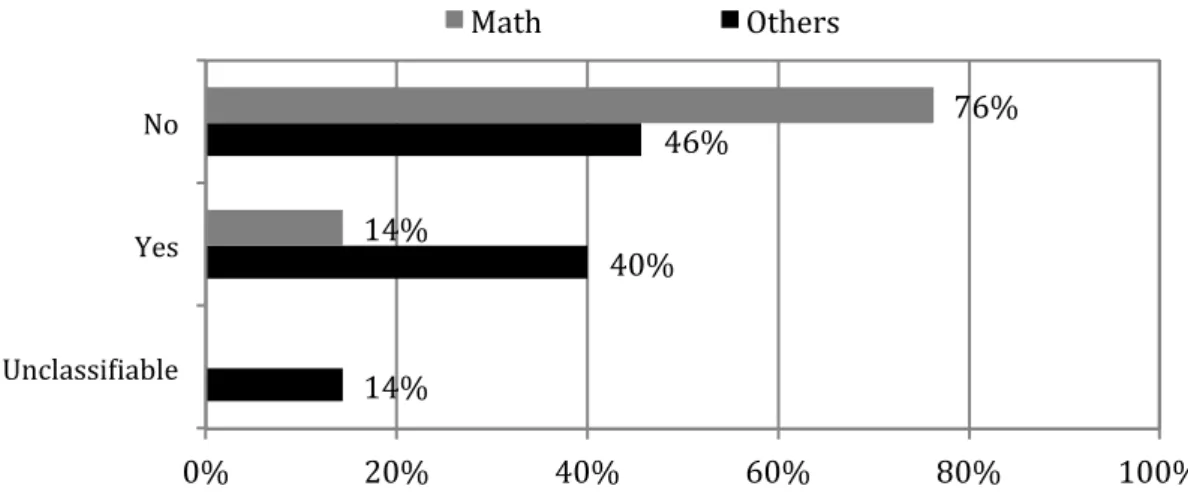
(16) A. Bautista, et al.. 16. “I feel it would be difficult to extract exact data from the model. The intervals do not lend to detailed and exact numerical values. This type of data would be much clearer in ordered pairs or a table.” (Others, Natural Sciences and Technology) I think it is difficult to extract the exact data using the model. Above I have created a table showing Dolbear's rule of N = T - 39, but I used the equivalent equation of T = N + 39. Only the first ordered pair (57, 18) could be extracted using this rule, starting with chirps and ending with temperature. (Others, Social Sciences and Humanities) Quantitative Comparisons across Educational Backgrounds (Math vs Others) Consistent with Question 1 findings, there were differences in how teachers responded to Question 2 depending on their educational background (Figure 5). More than three quarters of teachers in the Math group (16 teachers, 76%) stated that it is not possible to extract the data from the model, whereas in the group Others, the proportion of teachers who maintained that view was lower (16 teachers, 46%). The teachers from the Others group were the most likely to consider that the data could be extracted from the model (14 teachers, 40%). Only a small minority of teachers from the math group expressed this idea (3 teachers, 14%). Percentages in Figure 5 refer to the total N in each sub-group (Math = 21; Others = 35). Math$. Others$. No$. Yes$. Unclassi1iable$. 0%$. 76%$. 46%$ 14%$. 40%$. 14%$ 20%$. 40%$. 60%$. 80%$. 100%$. Figure 5. Comparison for educational background in Question 2 Qualitative Description of Differences across Educational Backgrounds Responses to this question from teachers with degrees in mathematics were often emphatic and categorical. The teachers explained that, in having access to the model only, there would be information impossible to know about the raw data, such as the specific number of data points originally collected. As shown below, they provided specific examples to justify their ideas. No. If you were given the model you would not be able to find the data points that we originally started with. For example, if you were given the model N =. PNA 9(1).
(17) Mathematics teachers’ ideas about mathematical models…. 17. T - 39 and the temperature was 80 degrees, following the model N = 80 - 39 so N = 41, but the original point was (80, 45). There would be no way to know that it was 45 from the given model. (Math, Mathematics Education) “[…] you would have no idea how many elements to extract.” (Math, Mathematics Education) The responses from the Mathematics Education sub-group were not as emphatic and categorical (see example below). Perhaps, as a result of the concern of these teachers with the usefulness of models, as seen in Question 1, they acknowledged that one could obtain fairly precise estimates from the model provided. “You wouldn’t extract the data, but you could hypothesize or ‘what if’ the data.” (Math, Mathematics Education) One teacher from the Mathematics Education sub-group—the only one in this group who included the data points as part of the model in Question 1—argued that the data could be extracted, but with restrictions. As can be seen in the quote below, it appears that this teacher was highlighting the difficulty of reading precise values from a graph, rather than any inherent distinction between the model and the data. “Extracting data from the model is possible, but presents the same difficulties as finding data from the graph, namely, at times, exact numbers are sometimes difficult to find.” (Math, Mathematics Education) Teachers with backgrounds in natural sciences and technology were the most likely to consider the data points as part of the model, as seen in Question 1. Consistently, they were also the most likely to state that obtaining the original data points from the model is indeed possible (see examples below). As in the Mathematics Education subgroup, these teachers elaborated on the idea that even when models cannot give the exact data, they are useful for providing us with predictions and approximations. “You could extract an approximate number of chirps for a particular temperature, based on the model.” (Others, Natural Sciences and Technology) “In this given model yes. The data pairs are provided by the blue points of reference on the graph.” (Others, Natural Sciences and Technology) Most. of the teachers in the sub-group Social Sciences and Humanities answered the question negatively, but their responses were even less categorical than those from the sub-groups Mathematics and Mathematics Education. Interestingly, as shown in the following quote, these teachers frequently indicated that extracting the data from the model would be challenging, difficult, or even impossible for them. I would not be able to extract the exact data from the model, as the model produces mathematically perfect pairings in a pattern, but mother nature and the inherent difficulties of data collection produce outcomes that are not so precise. If I use the formula N = T - 39 to determine the number of chirps, I. PNA 9(1).
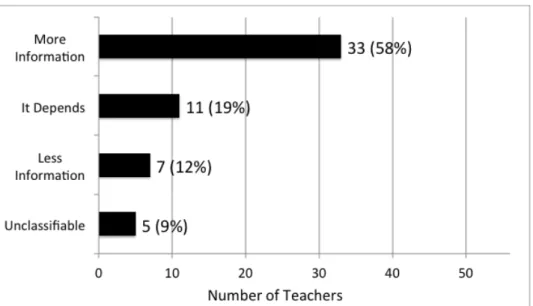
(18) A. Bautista, et al.. 18. will not get the same exact ordered pairs as those collected in the data sample. (Others, Social Sciences and Humanities) Other teachers in this sub-group answered the questions affirmatively, but conveyed doubt about the accuracy of the potential findings. The following is an example of that kind of statement. Yes, you can, however, some of the information might not be the exact measurements, as the graph uses a scale of 5 for chirps and 10 for temperature, which means there will need to be some estimating as to the measurements. (Others, Social Sciences and Humanities) Do you Think the Model Conveys more or less Information than the Data? Why? (Question 3) We present in Table 3 the frequencies of teachers’ responses by sub-groups in Question 3. Table 3 Frequencies of Teachers’ Responses in Question 3 N. More information. It depends. Less information. Unclassifiable. Mathematics. 13. 10. 3. 0. 0. Mathematics Education. 8. 5. 1. 2. 0. Natural Sciences and Technology. 8. 5. 2. 0. 1. Social Sciences and Humanities. 27. 13. 5. 5. 4. Sub-group. Note. Categories are mutually exclusive.. This question also elicited different responses among our participants. Similar to Question 2, we used a set of mutually exclusive categories to code teachers’ responses (Figure 6). The responses of 5 teachers (9%) were unclassifiable because they did not address the question asked. Categories in Figure 6 are mutually exclusive.. PNA 9(1).
(19) Mathematics teachers’ ideas about mathematical models…. 19. Figure 6. Number of teachers coded in each of the Question 3 categories (N = 56) The Model Conveys more Information than the Data Most teachers from all backgrounds (33 teachers, or 59%) expressed that the model conveyed more information than the data, although for varying reasons. As shown in the quotes below, teachers expressed, for instance, that the model allowed for predictions and estimations, that it provided a general picture of the relationship between variables, and that it allowed us to generalize the information given. “I think the model gives more latitude for information because it can show the information over a wider variety of temperatures.” (Others, Social Sciences and Humanities) “The model gives us a bigger picture of a generalization of the relationship between the crickets’ chirping and the temperature.” (Math, Mathematics Education) It Depends Fewer teachers (11, or 20%) provided us with “it depends” types of responses. For example, some teachers argued that the model conveyed both more and less information than the data, whereas others did not choose between more and less. The exactness of the values predicted by the model (as compared to the actual empirical data collected), as well as the nature of the information provided by the model, were central issues to these responses. The following are examples of such statements. Yes, the model conveys both more information and less information: “More information” in the sense that it predicts the observed outputs reasonably well… “Less information” in the sense that it does not provide exactly accurate results most of the time. That being said, the data itself is very limited. (Math, Mathematics Education). PNA 9(1).
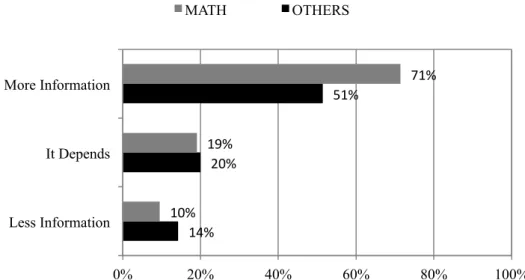
(20) A. Bautista, et al.. 20. “I don’t think the model provides more or less information than the data—just different information. But, for any T, I can give a value for N; and for any N, I can give a value for T using the model.” (Math, Mathematics Education) The Model Conveys Less Information than the Data A minority of teachers (7, or 13%) expressed that the model conveyed less information than the data. Reflecting strong concern with the idea of “exactness,” these teachers argued that the model failed to accurately predict all data points given. The following are examples of those claims. “A linear model is not exact enough; the line should be a curve… The model attempts to create a single line that represents all of the data.” (Others Social Sciences and Humanities) “The model conveys less information that the data. First, it is only a model… It is the best rule that could be used for the majority of the data.” (Math, Mathematics Education) Quantitative Comparisons across Educational Backgrounds (Math vs Others) In contrast to the two prior questions, here responses were more similar across educational backgrounds. As shown in Figure 7, the proportion of teachers who expressed that the model conveyed more information than the data was somewhat higher in the Math group (15 teachers, 72%) than in the group Others (18 teachers, 51%). The proportions for the category It Depends were similar in both groups. Finally, the proportion of teachers who said the model conveyed less information was only slightly lower in the Math group (2 teachers, 9%) than in the Others group (5 teachers, 14%). As we will show, very different ideas about the nature and purposes of models led to the same answer. Percentages in Figure 7 refer to the total N in each sub-group (Math = 21; Others = 35).. PNA 9(1).
(21) Mathematics teachers’ ideas about mathematical models…. MATH. 21. OTHERS. 71%$. More Information. 51%$ 19%$ 20%$. It Depends. 10%$ 14%$. Less Information 0%. 20%. 40%. 60%. 80%. 100%. 7. 3Comparisons Question 3 refer to Figure 7. Figure Question comparisonsfor foreducational educationalbackground background:inPercentages the total N in each sub-group (Mathematics = 21; Others = 35) Qualitative Description of Differences across Educational Backgrounds Qualitative of Differences across Educational Teachers inDescription the sub-group Mathematics were the most Backgrounds emphatic in stating that the Teachers in the sub-group Mathematics were the most emphatic stating thatenable the model conveys more information than the data points. They notedinthat models model conveys more information than the points. They noted that models enableor us to make predictions for any value, anddata in both directions (temperature to chirps us to make predictions for value, and inHowever, both directions (temperature chirps or chirps to temperature, seeany quote below). they recognized thatto predictions chirps to temperature). However, they recognized that predictions might not exactly might not exactly match the observations taken from the natural environment. Many match the observations taken from the natural environment. Many teachers in this subteachers in this sub-group noted the need to clarify the domain and range of the funcgroup noted was the need to clarify domain and range of the function, which was not tion, which not given in thethe problem. given in the problem. I think the model conveys more information than the data because you could Ichoose think the conveys (or more information the data because you could anymodel temperature any number ofthan cricket chirps) and could deterchoose any temperature (or any number of cricket chirps) and could determine a good estimate of how many cricket chirps per 13 seconds there would mine a good estimate of how many cricket pernot 13 need seconds therepoint would be (or the temperature at that time). Nowchirps you do a data for be (or exact the temperature at because that time). a data point for every temperature, youNow can you find do fornot anyneed temperature the numevery temperature, you can findgraph for any number ofexact cricket chirps (orbecause vice versa) in the or temperature by using thethe equation. ber of cricket chirps Education) (or vice versa) in the graph or by using the equation. (Math, Mathematics [Mathematics, Mathematics Education] The responses of teachers in the Mathematics Education sub-group were very similar The responses teachers in the Mathematics Education stating sub-group very similar to those of the of teachers with Mathematics backgrounds, that were the model conveys to those of the teachers with Mathematics backgrounds, stating that the model conveys more information and stressing that it allows predictions and estimations. As shown in more information and stressing allows predictions estimations. the quote below, some teachersthat alsoit pointed out that theand model provides Some a senseteachof the ers also pointed out that the model provides a sense of the overall relationship beoverall relationship between the variables. tween the variables. “The model gives us a bigger picture of a generalization of the relationship between “The model gives us aand bigger picture of a generalization of the relationship the crickets’ chirping the temperature.” (Math, Mathematics Education) between the crickets’ chirping and the temperature.” [Mathematics, Mathematics Education] Most teachers with natural sciences and technology backgrounds agreed that the modMost teachers withinformation Natural Sciences & Technology backgrounds agreed that thewith model conveys more than the data, but many expressed a concern the el conveys more information than the data, but many expressed a concern with the specifics of this model and its applicability to these data. These teachers provided con-. PNA 9(1).
(22) A. Bautista, et al.. 22. text and examples to justify their responses, alluding to issues such as domain and range, the overall shape of the data points, and the presence of outliers. As ahown in the following quote, this sub-group most commonly raised the question of whether a linear model was appropriate and whether a different function might be superior. While the data gives exact information that the model does not, the model can be used to estimate what the number of chirps would be for any given temperature. However, for temperatures below 57 degrees and above 80 degrees, I do not think Dolbear’s model will be very accurate, as the slope of the line between the points at the lower end of the temperature range becomes less steep. As the temperature gets above 77 degrees, the slope becomes greater. At first glance, the data almost looks like the relationship is exponential, as indicated by the change in slope as you move along the x-axis. (Others, Natural Sciences and Technology) Finally, the teachers with backgrounds in social sciences and humanities expressed the greatest diversity of opinions. As in the other sub-groups, most teachers stated that the model conveys more information than the data. However, some teachers from this sub-group argued that the model conveys less information (see quotes below). The justifications they gave showed strong concern with exactness. “I think the model conveys less information because it is not exact data. The model can be used to make predictions/estimates but that data is exact.” (Others, Social Sciences and Humanities) “I think the model gives more latitude for information because it can show the information over a wider variety of temperatures.” (Others, Social Sciences and Humanities). DISCUSSION AND CONCLUSIONS We opened this article by arguing that defining modeling and models in mathematics education is complex, and that researchers, educators, and policymakers have multiple—and often contradicting—views (Kaiser & Sriraman, 2006). In this paper, we show that a similar landscape of different views exists within the collective of mathematics teachers, specifically regarding their ideas about what constitutes a mathematical model of a real-world phenomenon, and the relationships between models and empirical data. Researchers have proposed that, from a representational standpoint, mathematical models consist of one or several mathematical entities purposely chosen and displayed to describe, predict, and/or explain real-world phenomena (e.g., Lesh & Doerr, 2003; Niss, 1989). We found that grades 5-9 mathematics teachers also think of mathematical models as tools of a representational nature. In the context of the activity Famous Amos and his Cricket Thermometer, most teachers cited several entities as representing the model, including the equation, the line of best fit, and to a lesser extent, the PNA 9(1).
(23) Mathematics teachers’ ideas about mathematical models…. 23. raw data points. Teachers associated these representations with the model, even though the activity explicitly defined the equation as an expression of the model and characterized the others simply as representations. Based on this evidence, we have mapped a diverse landscape of teachers’ understandings of what a mathematical model is. Our data illustrate the extent to which different audiences can interpret the term mathematical model differently. Even though all teachers were provided with the same materials, they focused their attention on different representations and analyzed the situation using different criteria. Interestingly, other representations available in the problem given—such as the list of ordered pairs, the written description of the scenario, and the tables—were never explicitly referred to as the model, even though they were constructed using the same data as the graphs. We also found that teachers with different educational backgrounds describe mathematical models in different ways. Consistent with the research by Justi and Gilbert (2003) with science teachers, our study suggests that educational background is an important component that might contribute to shape mathematics teachers’ ideas about models and modeling. While most teachers tended to refer to the line of best fit as the model, teachers in the Math group were more likely than those in the Others group to mention the equation, and to state that the data could not be extracted from the model. In contrast, teachers in the group Others were more likely to consider the data points themselves as part of the model, and thus to consider it possible, if perhaps difficult, to extract the data from the model. In order to obtain a more fine-grained account of teachers’ responses, we developed qualitative descriptions of the most distinctive characteristics for four teacher sub-groups. We found that teachers with mathematics backgrounds seemed to understand models as an “idealization” of the data, as abstract representational tools whose main work is to predict. They seemed particularly concerned with formal aspects of models. For example, they frequently expressed the importance of clarifying the domain and range of the function and referred to the tensions between mathematics and the natural world (e.g., crickets would die under extreme temperature conditions). Finally, these teachers focused on the question of how the model and data are related as abstract entities (Kaiser & Maaß, 2007), with less reference to what the user might want the models for. Teachers with degrees in mathematics education extensively referred to the advantages of having a model (e.g., to visualize patterns, estimate unknown data, see trends in the data). However, they did not describe in detail the specific conceptual information of the mathematical model at hand, as teachers from the sub-group Natural Sciences and Technology did. Indeed, the teachers in the latter sub-group focused on the characteristics of the given model, such as the specific kind of functional relationship, strength of the relationship, and the presence of outliers. Moreover, it was primarily the Natural Sciences and Technology sub-group who tended to see the model presented as just one of many possible models, and who discussed other possibilities (i.e., an exponential model). Moreover, teachers from both Mathematics Education, and Natural Sciences and Technology tended to focus on what the model is good PNA 9(1).
(24) A. Bautista, et al.. 24. for, as well as what the user can do with models. In addition, they both described models as powerful tools not only to predict but also to visualize patterns and generalize (Justi & Gilbert, 2003). The teachers from the Social Sciences and Humanities sub-group, whose education was focused neither on mathematics nor science content knowledge, were concerned with the exactness of the given model, that is, with whether or not the model could precisely reproduce the raw data points provided in the activity. This preoccupation with the exactness of the model suggests that they might conceive of mathematics as an abstract, authoritarian discipline (Kaiser & Maaß, 2007). Similar to the Mathematics Education sub-group, these teachers did not pay much attention to the conceptual/contextual information of the modeling scenario at hand. In contrast, they tended to refer to the model “in the abstract” (Verschaffel et al., 1997). This study has several limitations. First, the activity used in the study (Famous Amos and his Cricket Thermometer) exclusively focuses on one kind of modeling, which we described above as a data-driven situation. Further studies should be conducted to explore teachers’ responses to other types of modeling situations (e.g., theory-driven modeling situations, probabilistic simulation situations). Second, the opportunistic nature of the research, in which neither the subjects nor the substance was chosen primarily for research purposes, imposes important limitations. The results come from a single source of data—written responses to open-ended questions. It would be desirable to conduct additional studies based on different data sources. Further, the sample of participating teachers was small, and the size of the sub-group Social Sciences and Humanities was larger than the sizes of the other sub-groups. As explained above, this imbalance roughly reflects the current backgrounds among middle school mathematics teachers in the US, where teachers with backgrounds in mathematics, mathematics education, and natural sciences and technology are outnumbered by teachers with backgrounds in social sciences and humanities. Future studies should be conducted to explore whether the differences identified here are also observed among other samples of mathematics teachers.. EDUCATIONAL IMPLICATIONS Notwithstanding these limitations, this study indicates that one size fits all approaches towards professional development might not be the most appropriate for mathematical models and modeling, as teachers hold widely varying ideas about the nature and purposes of mathematical models, and teachers with different educational backgrounds seem to have different educational needs. In-service mathematics teacher preparation programs should take into account this diversity of teachers’ prior ideas about models and modeling, instead of assuming that they all understand the same thing when using those terms. The biggest challenge, therefore, is to find out what teachers (as learners!) know ahead of time and respond to their ideas with instruction.. PNA 9(1).
(25) Mathematics teachers’ ideas about mathematical models…. 25. The findings of this exploratory study, despite not being generalizable to all mathematics teachers, provide some insights in this direction. Based on our data, we think it would be enriching for teachers with backgrounds in mathematics and mathematics education to deal with situations of exploration and analysis of the different constraints that might affect mathematical models. Similarly, it would be beneficial for teachers with natural sciences and technology backgrounds to engage in activities that involve the analysis of models from abstract/formal perspectives. Finally, teachers with backgrounds in social sciences and humanities would benefit from experiences in which the exactness of models is not an essential issue. This would allow them to explore the advantages of visualizing general trends in the data. Moreover, this paper shows that there is room for all teachers—regardless of their educational background—to expand the range of representations they consider as, or include in, mathematical models, and the goals and purposes of generating, analyzing, and evaluating such models. One possible way to do this might be to encourage teachers with different backgrounds to collaboratively engage in modeling activities, in order to better understand the roles played by perspective, available tools and skills, and sense-making in modeling activities.. ACKNOWLEDGEMENTS This study was funded by the National Science Foundation (NSF), Grant # DUE0962863, “The Poincaré Institute: A Partnership for Mathematics Education.” The ideas expressed herein are those of the authors and do not necessarily reflect the ideas of the funding agency.. REFERENCES Ainley, J. (2012). Developing purposeful mathematical thinking: A curious tale of apple trees. PNA, 6(3), 85-103. Blum, W. (2002). ICMI Study 14: Applications and modelling in math education – Discussion document. Educational Studies in Mathematics, 51, 149-171. Blum, W., & Borromeo Ferri, R. (2009). Mathematical modelling: Can it be taught and learnt? Journal of Mathematical Modelling and Application, 1(1), 45-58. Blum, W., & Niss, N. (1991). Applied mathematical problem solving, modelling, applications, and links to other subjects – State trends and issues in mathematics instruction. Educational Studies in Mathematics, 22(1), 37-68. Common Core State Standards Initiative. (2010). Common Core State Standards for Mathematics. Washington, DC: National Governors Association Center for Best Practices and the Council of Chief State School Officers. Doerr, H. M. (2007). What knowledge do teachers need for teaching mathematics through applications and modeling? In W. Blum, P. Galbraith, H. W. Henn, & M.. PNA 9(1).
(26) A. Bautista, et al.. 26. Niss (Eds.), Modelling and applications in math education (Vol. 10, pp. 69-78). New York, NY: Springer. English, L., & Sriraman, B. (2010). Problem solving for the 21st century. In B. Sriraman & L. English (Eds.), Theories of mathematics education: Seeking new frontiers (pp. 263-285). New York, NY: Springer. Erdogan, A. (2010). Primary teacher education students’ ability to use functions as modeling tools. Procedia Social and Behavioral Sciences, 2(2), 4518-4522. George, D., & Mallery, P. (2003). SPSS for Windows step by step: A simple guide and reference. Boston, MA: Allyn & Bacon. Gilat, T., & Amit, M. (2013). Exploring young students creativity: The effect of model eliciting activities. PNA, 8(2), 51-59. Gravemeijer, K. (1999). How emergent models may foster the constitution of formal mathematics. Mathematical Thinking and Learning, 1(2), 155-177. Gravemeijer, K., & Doorman, M. (1999). Context problems in realistic math education: A calculus course as an example. Educational Studies in Mathematics, 39(13), 111-129. Greer, B. (1997). Modelling reality in mathematics classrooms: The case of word problems. Learning and Instruction, 7(4), 293-307. Henn, H. W. (2010). Modelling pedagogy: An overview. In R. Lesh, P. Galbraith, C. R. Haines, & A. Hurford (Eds.), Modeling students’ mathematical modelling competencies (pp. 321-324). New York, NY: Springer. Janvier, C. (1987). Problems of representation in the teaching and learning of mathematics. Hillsdale, NJ: LEA. Justi, R., & Gilbert, J. (2003). Teachers’ views on the nature of models. International Journal of Science Education, 25(11), 1369-1386. Kaiser, G., Blum, W., Borromeo Ferri, R., & Stillman, G. (Eds.). (2011). Trends in teaching and learning of mathematical modelling. International perspectives on the teaching and learning of mathematical modelling. Dordrecht, The Netherlands: Springer. Kaiser, G., & Maaß, K. (2007). Modelling in lower secondary mathematics classroom – Problems and opportunities. In W. Blum, P. Galbraith, H. W. Henn, & M. Niss (Eds.), Modelling and applications in Math Education (Vol. 10, pp. 275-284). New York, NY: Springer. Kaiser, G., & Sriraman, B. (2006). A global survey of international perspectives on modeling in math education. ZDM, 38(3), 302-310. Lehrer, R., & Schauble, L. (2004). Modeling natural variation through distribution. American Educational Research Journal, 41(3), 635-679. Lesh, R., & Doerr, H. M. (2003). Foundations of a models and modeling perspective on mathematics teaching, learning, and problem solving. In R. Lesh & H. M. Doerr (Eds.), Beyond constructivism, models & modeling perspective on mathematics problem solving, learning & teaching (pp. 3-33). Mahwah, NJ: LEA.. PNA 9(1).
(27) Mathematics teachers’ ideas about mathematical models…. 27. Lesh, R., & Lehrer, R. (2003). Models and modelling perspectives on the development of students and teachers. Mathematical Thinking and Learning, 5(2-3), 109129. National Council of Teachers of Mathematics [NCTM]. (2000). Principles and standards for school mathematics. Reston, VA: Author. Niss, M. (1989). Aims and scope of applications and modelling in mathematics curricula. In W. Blum (Ed.), Application and modelling in learning and teaching mathematics (pp. 22-31). Chichester, United Kingdom: Ellis Horwood. Pozzi, S., Noss, R., & Hoyles, C. (1998). Tools in practice, mathematics in use. Educational Studies in Mathematics, 36(2), 105-122. Rico, L. (2009). Sobre las nociones de representación y comprensión en la investigación en educación matemática [On the notions of representation and understanding in mathematics education research]. PNA, 4(1), 1-14. Sánchez, V., & Liinares, S. (2003). Four student teachers’ pedagogical reasoning on functions. Journal of Mathematics Teacher Education, 6(1), 5-25. Spandaw, J. (2011). Practical knowledge of research mathematicians, scientists, and engineers about the teaching of modelling. In G. Kaiser, W. Blum, R. Borromeo Ferri, & G. Stillman (Eds.), Trends in teaching and learning of mathematical modelling (Vol. 1, pp. 679-688). Dordrecht, The Netherlands: Springer. Szydlik, J. E., Szydlik, S. D., & Benson, S. R. (2003). Exploring changes in preservice elementary teachers’ mathematical beliefs. Journal of Mathematics Teacher Education, 6(3), 253-279. Teixidor-i-Bigas, M., Schliemann, A. D., & Carraher, D. (2013). Integrating disciplinary perspectives: The Poincaré Institute for Mathematics Education. The Mathematics Enthusiast, 10(3), 519-561. Trelinski, G. (1983). Spontaneous mathematization of situations outside mathematics. Educational Studies in Mathematics, 14(3), 275-284. Vahey, P., Rafanan, K., Patton, C., Swan, K., Hooft, M., Kratcoski, A., & Stanford, T. (2012). A cross-disciplinary approach to teaching data literacy and proportionality. Educational Studies in Mathematics, 81(2), 179-205. Verschaffel, L., De Corte, E., & Borghart, I. (1997). Pre-service teachers’ conceptions and beliefs about the role of real-world knowledge in mathematical modelling of school word problems. Learning and Instruction, 7(4), 339-359.. PNA 9(1).
(28) A. Bautista, et al.. 28. Alfredo Bautista Tufts University United States Nanyang Technological University Singapore [email protected]. Michelle H. Wilkerson-Jerde Tufts University United States [email protected]. Roger G. Tobin Tufts University United States [email protected]. Bárbara M. Brizuela Tufts University United States [email protected]. Received: March 2014. Accepted: May 2014.. PNA 9(1).
(29)
Figure
+4
Documento similar
