A CFD parametric study on the performance of a
low-temperature-differential
c
-type Stirling engine
Wen-Lih Chen
a,⇑, Yu-Ching Yang
a, Jose Leon Salazar
b aClean Energy Center, Department of Mechanical Engineering, Kun Shan University, Yung-Kang, Tainan 710-03, Taiwan, Republic of China b
Material Engineering School, Costa Rica Institute of Technology, Cartago, Costa Rica
a r t i c l e i n f o
Article history: Received 6 July 2015 Accepted 3 October 2015 Available online 23 October 2015
Keywords: LTD Stirling engine CFD
Parametric effects
a b s t r a c t
An in-house CFD code has been applied to a low-temperature-differential (LTD)c-type Stirling engine to understand the effects posed by several geometrical and operational parameters on engine performance. The results include variations of pressure, temperature, and heat transfer rates within an engine cycle as well as variations of engine’s power and efficiency versus these parameters. It is found that power piston stroke and radius influence engine performance very similarly, and power and efficiency both increase as these two parameters increase. In fact, the effects of the two parameters can be assimilated into those by the parameter of compression ratio. The stroke of displacer is observed to affect strongly on heat input but weakly on power, thus causing the efficiency to decrease as it increases. As expected, both power and efficiency increase as temperature difference between the hot and cold ends increases. Lastly, engine speed is observed to pose strong positive effects on power but exert weak effects on efficiency. This study reveals the effects produced by several important parameters on engine performance, and such information is very useful for the design of new LTD Stirling engines.
Ó2015 Elsevier Ltd. All rights reserved.
1. Introduction
The first Stirling engine was patented by Robert Stirling who originally invented it to replace dangerous steam engines in early 19th century. Unfortunately Stirling engines never quite succeeded this task and were even out-performed, together with steam engi-nes which they meant to replace, by internal combustion engiengi-nes. Then they were neglected for a long period of time during late 19th century to early 20th century. However, thanks to some of its unique advantages, Stirling engines have made a dramatic come-back in recent decades; and Stirling engine technology is now con-sidered as one of the important green-energy technologies to address fossil fuel depletion and global warming problems. Today, Stirling engine technology has become a thriving industry with more and more applications being discovered due to continuous improvement on engine performance through new generations of Stirling engines.
Stirling engines are broadly classified into
a
, b, andc
typesaccording to their kinematic configurations. In general, the first two types are associated with high-temperature differential (HTD) variants, while the third type is associated with low- or medium-temperature differential (LTD) variants. HTD engines
have important edges on power, efficiency, and power-to-weight
ratio; and most of the industrial Stirling engines are
a
orbtypes[1,2]. The
c
-type engines, on the other hand, have attracted lessattention mainly due to their lower efficiency and
power-to-weight ratio compared with the other two types[3]. These
draw-backs are mainly rooted in low temperature difference between the hot and cold ends. Yet, low temperature difference can be a unique advantage because these engines can be easily powered by low-energy-intensity heat sources such as biomass, solar energy, geothermal energy, or even industrial waste heat. In
addi-tion,
c
-type engines are relatively simpler to construct, lessdemanding on heat-resisting quality of material, and producing less thermal stresses as well as heat-related issues than their high-temperature counterparts; hence the costs for manufacturing and maintenance are lower. These advantages make them attrac-tive to domestic applications, which could be potentially a huge market. They can serve as the prime movers in residential micro combined heat and power (CHP) systems, waste heat recovery systems for small businesses, or generators in agricultural areas where biomass waste is abundant.
Although Stirling engine industry is growing, for this technol-ogy to be adopted in even wider applications, engine performance, in terms of power output, efficiency, power-to-weight ratio, has to be continuously improved. Improvement on Stirling engine performance relies heavily on theoretical or numerical analyses.
http://dx.doi.org/10.1016/j.enconman.2015.10.007 0196-8904/Ó2015 Elsevier Ltd. All rights reserved.
⇑ Corresponding author.
E-mail address:wlchen@mail.ksu.edu.tw(W.-L. Chen).
Contents lists available atScienceDirect
Energy Conversion and Management
In classical thermodynamics analysis, the Stirling engine cycle is broken down into 4 processes, isothermal expansion, isometric heat removal to regenerator, isothermal compression, and isomet-ric heat absorption from regenerator. The analysis gives rise to equations of work and efficiency of the Stirling engine cycle as:
W¼mRðTHTLÞlnðVrÞ; ð1Þ
g
¼1THTL; ð
2Þ
wheremandRare respectively the mass and gas constant of
work-ing gas,THandTLare respectively the temperatures at the hot and
cold ends of the engine, andVris engine’s compression ratio. Both
equations are simple and yet powerful because they point out the
directions to improve Stirling engine’s work and efficiency. Eq.(1)
states that the work of a Stirling engine can be increased by
charg-ing the engine (increascharg-ingm), using hydrogen or helium as working
gas (highR), increasing the temperature difference between the hot
and cold ends, or increasing engine’s compression ratio. Eq. (2)
states that the efficiency of the engine can be improved by simply increasing the temperature difference between the hot and cold ends. Nevertheless, thermodynamics analysis is unable to predict any quantity regarding rate, such as power or heat transfer rate, of the engine, because it only deals with equilibrium states. Since heat is transferred into or out of a Stirling engine through the walls of the engine, the amount of heat involved in an engine cycle is dic-tated by rates of heat transfer on these walls. Therefore, some ‘‘rate” parameters are crucial for accurate prediction on engine perfor-mance. To predict such quantities, more sophisticated methods involving rate of change are required.
Many numerical Stirling engine models that are more advanced than thermodynamic analysis have been developed. A detailed
overview on this kind of models can be found in Mahkamov[4].
Based on their chronological hierarchy, these are generally catego-rized into the first-, second-, and third-order models. In these mod-els, the engine space is divided into 3, or 5, or more sections (control volumes) along the axial direction; therefore they are
practically zero- or one-dimensional models. The model proposed by Schmidt is the stereotype of this kind; and improved variants of Schmidt’s model are currently the most popular models for
studying Stirling engines[5–7]. When taking non-isothermal and
transient effects into account, they are able to predict the transient variations of volume, pressure, and heat transfer rate in each sec-tion, allowing the overall heat transfer rate and engine power to be calculated. In addition, they don’t require huge computer resources, in terms of memory space and CPU hours, to run, mak-ing them much more useful tools than thermodynamic analysis to study Stirling engines. However, they only resolve spatial varia-tions in the axial direction of the engine; and this means that any variation in the transverse direction that is important to pre-dict engine’s performance accurately will be neglected. In addition, they are unable to resolve the effects caused by geometrical changes in multi-dimensional components. Consequently, they are not ideal for performing optimization on the geometries and dimensions of individual components during the design of a new Stirling engine. Further, some models use simple practices such as constant convective heat transfer coefficients to account for heat transfer rates inside engine chambers, over-simplifying the com-plexity of the real heat transfer mechanism occurring inside these chambers. Combination of all these factors results in unsatisfactory predictive accuracy. It is common that they over-predict engine power and efficiency by margins from 30% to 100%, or even higher.
For example, Mahkamov[4]reported an over-estimation of engine
power by 250% by a second-order model.
The above review points out the need to use more elaborated models to improve predictions to facilitate the design of new engines. Computational fluid dynamics (CFD) has been widely used in automobile industries and is one of the most promising approaches to return more accurate predictions on Stirling engines performance. It is able to model multi-dimensional geometries and resolves the effects introduced by individual multi-dimensional engine components. Another important advantage of CFD model over the aforementioned numerical models is its general applicability to different Stirling engines. In first-, second-, or
Nomenclature
cp constant pressure specific heat (kJ kg1K1)
k thermal conductivity (W m1K1)
Lp length of power piston (m)
l1 length of the power piston linkage bar (m)
l2 length of the power piston connection rod (m)
l3 length of the displacer linkage bar (m)
l4 length of the displacer connection rod (m)
ld height of displacer (m)
m mass (kg)
p pressure (Pa)
Q heat transfer rate (W)
R gas constant (J kg1K1)
R1 outer radius of the power piston (m)
R2 inner radius of the displacer cylinder (m)
Rd outer radius of the displacer (m)
Rk thermal conductivity ratio between solid and gas
mate-rials
r1 crank radius of the power piston (m)
r2 crank radius of the displacer (m)
t time (s)
tp time period of a cycle (s)
T temperature (K)
ui velocity components respectively in xi-directions
(m s1)
~
ub
i local frame moving velocity components respectively in
xi-directions (m s1)
V volume (m3)
Vr compression ratio
W engine power (W)
xi components of Cartesian coordinate system (m)
Greeks
b crank angle of the displacer (rad or°)
q
density (kg m3)g
engine efficiency (%)h crank angle (rad or°)
l
viscosity (Pa s)third-order models, some empirical coefficients, for example heat-transfer coefficients and regenerator effectiveness, are required to close the models. These coefficients were often tuned according to experimental data of a particular Stirling engine; hence a model tuned this way would only return good prediction on that particu-lar engine, making the accuracy of such a model engine dependent. This lack of generality further hampers their usefulness in the design of completely new Stirling engines. In contrast, in Navier– Stokes equations, there is no coefficient to tune to fit experimental data; hence CFD can be applied to any kind of Stirling engine and retaining its high level of predictive accuracy.
There have been much fewer CFD studies on Stirling engines than other numerical studies, namely using first-, second-, or third-order models, in open literature, presumably due to the chal-lenges involved in CFD simulation on Stirling engines. In a CFD approach, the challenges lie on the complexity of coding, difficulty to converge, and huge demand on computer resources. Mahkamov
[4]reported a CFD study to investigate the working process of a
solar Stirling engine. A second-order model was used as a compar-ison. It was found that the two methods returned very different results in temperature distribution and engine performance, and the engine power predicted by CFD model was much more
accu-rate than the second-order model. Mahkamov[8]further applied
a three-dimensional CFD model to improve the performance of a prototype biomass Stirling engine. It was proven that CFD model is able to identify some geometrical features impeding engine per-formance, and engine performance can be improved by modifying
these features. Salazar and Chen[9]reported a CFD study on the
heat transfer characteristics of ab-type Stirling engine cycle. The
study aimed at understanding the complex heat transfer character-istics in the engine cycle; and impingement has been identified to be the major heat transfer mechanism. It was also found that tem-perature distribution is multi-dimensional and highly non-uniform across the entire domain at any given moment, implying that the simplification by adopting one-dimensional model could result in serious errors.
In Eq.(1), the only geometrical parameter is the compression
ratioVr. In a real Stirling engine, this parameter is actually
deter-mined by the combination of a number of geometrical parameters such as the strokes of displacer and power piston, the radii of dis-placer and power piston, and length of disdis-placer. The magnitudes of the impact produced by the individual parameters on engine performance could be different; hence engines designed with the same compression ratio but through different combinations of these parameters could perform differently. Only a three-dimensional CFD model is able to geometrically represent all these parameters and individually resolve their effects on engine perfor-mance. The objective of this study is to investigate the effects posed by some of the important geometrical and operational
parameters on the performance of a LTD
c
-type Stirling engineusing a three-dimensional CFD model. The Stirling engine in this
study is the twin-power piston
c
-type Stirling engine first reportedin Chen et al.[10,11], where the engine was experimentally
stud-ied and numerically analyzed by an improved variant of the
second-order model. Later, Chen et al.[12]conducted a CFD study
on this engine aiming at the understanding of the general physical processes in its engine cycle. This study is a follow-up study of
Chen et al.[12], and focuses on investigating the effects posed by
different geometrical and operational parameters.
2. Mathematical model
Fig. 1 shows the definition of geometrical parameters of the
engine. The displacements of the piston and displacer can be written as:
xp3ðhÞ ¼lc1 r1sinhþ
ffiffiffiffiffiffiffiffiffiffiffiffiffiffiffiffiffiffiffiffiffiffiffiffiffiffiffi
l21r21cos2h
q
þl2
; ð3Þ
xd
3ðbÞ ¼lc1 r2sinbþ
ffiffiffiffiffiffiffiffiffiffiffiffiffiffiffiffiffiffiffiffiffiffiffiffiffiffiffi
l23r22cos2b
q
þl4þld
; ð4Þ
whereb¼hp
2. The velocities of piston and displacer are:
up3ðhÞ ¼r1
x
coshr2
1
x
ffiffiffiffiffiffiffiffiffiffiffiffiffiffiffiffiffiffiffiffiffiffiffiffiffiffifficoshsinhl21r21cos2h
q ; ð5Þ
wd
3ðbÞ ¼r2
x
cosbr2
2
x
ffiffiffiffiffiffiffiffiffiffiffiffiffiffiffiffiffiffiffiffiffiffiffiffiffiffifficosbsinbl23r22cos2b
q : ð6Þ
The configuration of twin-power piston engine creates geometrical
symmetries with respect to bothx1andx2axes, allowing the engine
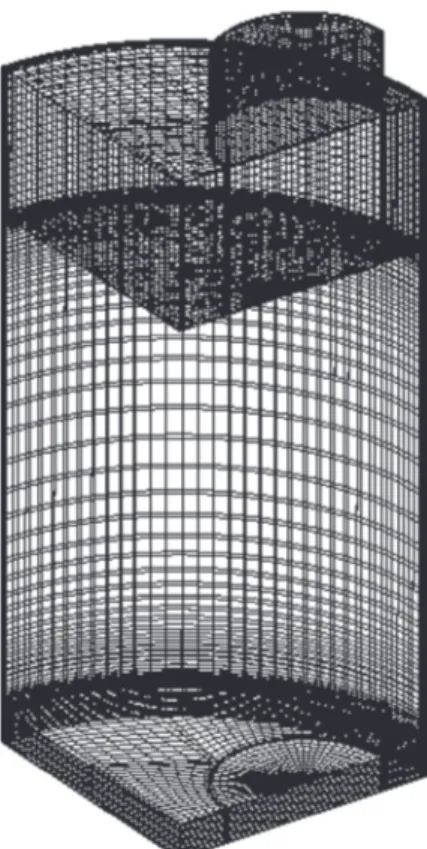
to be simulated by just a quarter of the entire domain as shown by
the computational mesh inFig. 2. The original engine in Chen’s[11]
experiment is large, which makes the flow inside the engine turbu-lent even at low engine speed. Here, the engine dimension is reduced by a factor of 2 to retain laminar flow inside the engine, thus there is no need to employ turbulence modeling. All turbu-lence models introduce some degree of modeling error into the solutions. Hence, without any involvement of turbulence modeling, the results will be modeling-error free. The engine doesn’t have a regenerator; instead, the solid material of the wall of displacer cylinder functions as the regenerator. Since the heat capacity of solid wall is much larger than that of the gas, it is further assumed that the temperatures of solid walls are either fixed at a constant
value (on the hot- or cold-end wall) or maintained at a constant profile along thex3-direction (on the displacer cylinder wall). This allows the temperature effect of solid domain to be replaced by specifying temperature boundary conditions. Because the tempera-ture difference between the hot and cold ends is not large for LTD Stirling engines, fluid viscosity and thermal properties of all mate-rials can be assumed constant. The working gas is air and assumed to follow ideal gas equation. Finally, mechanical friction, thermal radiation, and viscous dissipation effect are not taken into account. Under these assumptions, the engine cycle can be solved by three-dimensional transient laminar and compressible Navier–Stokes equations together with energy equation and ideal gas equation as follows:
nents between fluid and local moving frame which moves withub
i
inxidirections. The initial conditions are:
t¼0 s; ui¼0; i¼1;2;3; p¼101:0 kPa; T¼TL: ð11Þ
The surface of displacer is assumed adiabatic, thus the condi-tions on displacer surfaces are:
ui¼0; i¼1;2; ui¼ud3; i¼3;
@T
@n¼0; ð14Þ
wherenis the direction normal to the wall of displacer. The surface
of power piston is also assumed adiabatic, giving:
ui¼0; i¼1;2; ui¼up3; i¼3;
@T
@n¼0: ð15Þ
The temperature on the lateral wall of the displacer cylinder (the wall of regenerative channel) is assumed to maintain at a fixed linear profile as:
The numerical procedure in this study is the same as that used
in Chen et al.[12]. It is based on an in-house unstructured-mesh,
fully collocated, finite-volume code ‘USTREAM’ developed by the corresponding author. In this procedure, the number of cells in the computational domain is fixed, and the expansion or compres-sion of engine volume is achieved by moving the local boundaries of cells to increase or decrease the volumes of the cells, and collec-tively, they can simulate the expansion or compression of the engine volume just like the action of an accordion. The pressure–
velocity coupling scheme in Lebon et al.[13]is adopted to take into
account the variable density in compressible flows. Details of the numerical implementation of this procedure can be found in Chen
et al.[12]and will not be repeated here.
4. Results and discussion
Fig. 1shows the configuration and geometrical parameters. In
this study, the effects of some important geometrical parameters and operational parameters are investigated. The geometrical parameters are: stroke of displacer, stroke of power piston, and diameter of power piston; and the operational parameters are: temperature difference between the hot and cold ends and engine’s rotation speed. All of the three geometrical parameters affect engine’s compression ratio, and they can potentially pose significant impacts on engine performance. The engine in Chen
et al.[12]is used as the baseline engine, and the dimensions of
the engine are given inTable 1. In the following subsections, the
dimensions of those geometrical parameters are set to vary in the neighborhood of the dimensions of the baseline engine to investigate their effects. In addition, as the dimension of one metrical parameter is changed, the dimensions of the rest of geo-metrical parameters take the values of the baseline engine. In terms of the two operational parameters, they are also very influ-ential on engine’s power and efficiency. It is generally recognized that a LTD engine has maximum temperature difference between
the hot and cold ends less than 100 K[14]. Further, such an engine
normally runs at low engine speed. Hence the top limits on tem-perature difference and engine’s speed are set at 110 K (a bit larger
x
1X
2X
3than 100 K) and 120 rpm, respectively in this study.Table 2lists the values of the above parameters in all cases examined in this study.
Since the studied engine is a twin power-piston engine, the
engine geometry is symmetrical with respect tox1 and x2axes.
Therefore, only a quarter of the entire engine space is needed for CFD analysis. The computational mesh coving a quarter of the
engine space is shown in Fig. 2. The task of finding mesh size
and time-step length to obtain grid-independent and time-step-length independent solutions for the baseline engine has been
car-ried out and reported in Chen et al.[12], and will not be repeated
here. However, it was concluded that using a mesh (shown in
Fig. 2) with 84,579 cells and 200 time steps in a cycle are good
enough for the task. The same numbers of cells and time steps in a cycle are used in all cases in this study.
Since the detailed physical processes in this engine cycle have
been reported in Chen et al.[12], the focus in this study is on the
effects posed by different parameters on the overall engine perfor-mance, which is evaluated by engine power and efficiency. These values are derived by quantities that are calculated by integration of pressure or local heat transfer rates over an engine cycle. There-fore, the presentation of data will mostly through the variations of averaged or integrated quantities within an engine cycle.
4.1. The effects of power piston stroke
Cases 1–3 form this group of test cases. In this engine, the
power piton stroke is determined by r1 and is actually 2 times
the length of r1. Here, cases with r1= 0.0150, 0.0175, and
0.0200 m have been examined. The longer the power piston stroke, the larger the power piston’s swept volume; and the larger the power piston’s swept volume, the larger the engine’s compression
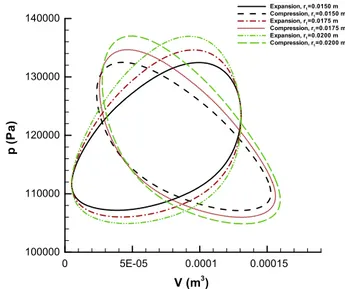
ratio. Consequently, a larger compression ratio creates larger pres-sure variations (larger differences between the maximum and min-imum pressures) in both the expansion and compression chambers
as can be seen in thep–Vdiagram shown inFig. 3. The diagram
indicates that pressure variations in case withr1= 0.0200 m are
the largest among the three cases. This also implies the work
out-put in cases with largerr1could also be larger because the areas
circled by theirp–Vloops are larger. The power and efficiency will
be discussed later.
Fig. 4shows the variations of averaged temperature and heat
transfer rates in the expansion and compression chambers within an engine cycle. Since most of the heat transfer phenomena occur on the walls of displacer, power piston stroke poses little impact on
heat transfer behaviors of the engine. This is demonstrated inFig. 4
as all cases return very similar variations of averaged temperature and heat transfer rates in both the expansion and compression chambers. As a result, the amounts of heat input and output in all cases are also in similar level.
The rates of heat input and output are calculated by integration along all solid boundaries:
Qin¼
In terms of the evaluation of output power, the focus is on the surface of the power piston because this is the exact place engine work is delivered. The power is calculated by:
W¼
x
where the negative sign on the right hand side of equation is to
account for the negative
x
in this study, and the circular integrationis from minimum xp
3 to maximum x
p
3 and back to minimum x
p
3.
Efficiency
g
is calculated by dividing the engine power by the rateof heat input.
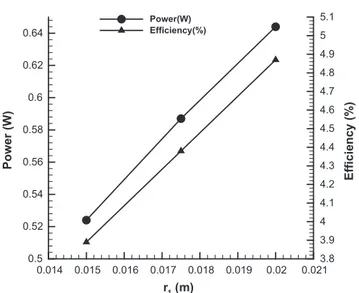
Fig. 5illustrates engine’s indicated power and efficiency versus
r1. It can be seen that both power and efficiency increase almost
linearly with an increase inr1. This confirms that the larger areas
circled by thep–Vloops in the cases of largerr1do produce higher
engine power. Since rates of heat input remain at similar level for all cases, engine efficiency increases as power increases.
Table 1
The values of the geometrical parameters of the baseline Stirling engine.
R1(m) 0.0125
The values of parameters investigated in the current study.
Case no. r1(m) r2(m) R1(m) DT(K) x(rad s1) Vr
1 0.0200 0.0125 0.01250 100 6.283 1.247
2 0.0175 0.0125 0.01250 100 6.283 1.216
3 0.0150 0.0125 0.01250 100 6.283 1.185
4 0.0200 0.0150 0.01250 100 6.283 1.214
5 0.0200 0.0100 0.01250 100 6.283 1.291
6 0.0200 0.0125 0.01000 100 6.283 1.160
7 0.0200 0.0125 0.01125 100 6.283 1.206
8 0.0200 0.0125 0.01250 30 6.283 1.247
9 0.0200 0.0125 0.01250 50 6.283 1.247
10 0.0200 0.0125 0.01250 80 6.283 1.247
11 0.0200 0.0125 0.01250 90 6.283 1.247
12 0.0200 0.0125 0.01250 110 6.283 1.247
13 0.0200 0.0125 0.01250 100 1.571 1.247
14 0.0200 0.0125 0.01250 100 3.141 1.247
15 0.0200 0.0125 0.01250 100 4.712 1.247
16 0.0200 0.0125 0.01250 100 5.497 1.247
V (m3)
p(
P
a
)
0 5E-05 0.0001 0.00015
100000
4.2. The effects of displacer stroke
Cases 1, 4, and 5 are in this group of test cases. The displacer
stroke is determined byr2, and is twice the length of r2. Under
the condition of fixed displacer cylinder length, as the stroke of dis-placer becomes longer, disdis-placer swept volume becomes larger, and the length of displacer has to be shortened to make room for the increased displacer swept volume. An increase in displacer swept volume also increases the total engine volume. However, as the swept volume of power piston remains the same, the com-pression ratio is actually decreased. Three differentr2with the val-ues of 0.0100, 0.0125, and 0.0150 m, respectively have been tested, and the corresponding displacer cylinder lengths are 0.079, 0.074,
and 0.069 m, respectively.Fig. 6shows thep–Vdiagram. As
men-tioned earlier, an increase in displacer stroke increases the dis-placer swept volume; this in turn increases the maximum volumes of both expansion and compression chambers which is
demonstrated by the right shift of curves inFig. 5. However, due
to the decrease in compression ratio, the difference between the maximum and minimum pressure decreases. Consequently, the
areas circled by thep–Vcurves are only slightly increased.
The variations of averaged temperature and heat transfer rates are shown inFig. 7. InFig. 7(a), asr2increases, temperature level in the expansion chamber becomes lower, and that in the compres-sion chamber becomes higher. This is due to the increase in dis-placer swept volume that moves more amount of working gas forwards and backwards between the expansion and compression chambers, promoting convective heat transfer between the hot and
cold ends.Fig. 7(a) also implies that the temperature gradients
near the walls of hot and cold ends become larger, yielding higher rates of heat transfer in both chambers. This is confirmed by the
variations of heat transfer rates shown inFig. 7(b).
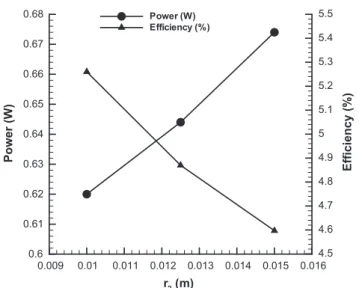
The effects posed byr2on engine’s power and efficiency can be
seen in Fig. 8. It shows that while power has increased as r2
increases, efficiency has decreased. Here, engine power is observed to increase slightly from 0.62 to 0.67 W, whereas efficiency
decreases from 5.26% to 4.59%. Although an increase inr2increases
both engine’s work and heat input, this phenomenon indicates that the increase in heat input is more pronounced than that in work, resulting in a decrease in efficiency.
(a)
Expansion, r1=0.0150 m Compresion, r1=0.0150 m Expansion, r1=0.0175 m Compression, r1=0.0175 m Expansion, r1=0.0200 m Compression, r1=0.0200 m
θ (0)
Expansion, r1=0.0150 m Compression, r1=0.0150 m Expansion, r1=0.0175 m Compression, r1=0.0175 m Expansion, r1=0.0200 m Compression, r1=0.0200 m
Fig. 4.Variations of averaged temperature and heat transfer rates in expansion and compression chambers of three cases with three differentr1, namelyr1= 0.0150, 0.0175, and 0.0200 m, respectively; (a) temperature variations and (b) heat transfer rate variations.
r1(m)
Power (W)
Efficiency (%)
0.014 0.015 0.016 0.017 0.018 0.019 0.02 0.021 0.5
Fig. 5.Variations of engine power and efficiency versusr1.
V (m3)
p (Pa)
0 5E-05 0.0001 0.00015
100000
4.3. The effects of power-piston radius
Cases 1, 6, and 7 are in this group of test cases. Three different
power-piston radii, namelyR1= 0.0100, 0.01125, and 0.01250 m,
have been examined. Since power piston swept volume is
propor-tional to the square ofR1given other geometrical parameters being
fixed, this parameter affects greatly on compression ratio and sub-sequently the performance of engine. However, this parameter only affects power piston swept volume; therefore its effects
should be similar to those of r1 discussed in Section 4.1.Fig. 9
showsp–Vdiagrams. Compared with thep–Vdiagrams inFig. 3,
the behaviors ofp–Vloops due to the increase inR1are indeed very
similar to those due to the increase inr1. Here, higherR1also
pro-ducesp–Vloops that circle larger areas, but the enlargement of
cir-cled area is more sensitive toR1than tor1. This is because power
piston swept volume only increases linearly withr1but does so
with the square ofR1.
For the same reasons discussed in Section 4.1, R1 has little
impact on variations of averaged temperature and heat transfer rates in the expansion and compression chambers. The variations in these two quantities are very similar to those depicted in
Fig. 4, hence will not be shown here.
Overall, the effects ofR1on engine performance are very similar
to those posed by r1. The only difference is that the engine
responds more sensitively to the increase inR1than that inr1. This
can be seen inFig. 10, where the variations of power and efficiency
versus compression ratio for all cases in Sections4.1 and 4.3are
shown. Note that in this plot, the last data on the right is shared by both groups of test cases. The plot indicates that data from both groups of test cases almost fall on the same power and efficiency curves. The data also suggest that in these two groups of test cases, engine performance only depends on compression ratio. Neverthe-less, in reality these two parameters can compensate each other during the design of new engines. For example, if somehow the stroke of power piston is limited, the same compression ratio can be achieved by adjusting the radius of power piston, and vice versa.
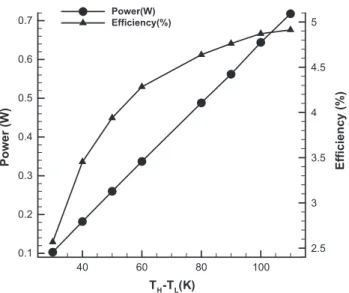
4.4. The effects of temperature difference between the hot and cold ends
Cases 1, 8, 9, 10, 11, and 12 are in this group of test cases.Fig. 11
depicts variations of engine’s power and efficiency versus
(a)
Fig. 7.Variations of averaged temperature and heat transfer rates in expansion and compression chambers of three cases with three differentr2, namelyr2= 0.0100, 0.0125, and 0.0150 m, respectively; (a) temperature variations and (b) heat transfer rate variations.
r2(m)
Power (W)
Efficiency (%)
0.009 0.01 0.011 0.012 0.013 0.014 0.015 0.016 0.6
Fig. 8.Variations of engine power and efficiency versusr2.
V (m3)
p (Pa)
0 5E-05 0.0001 0.00015
100000
temperature difference in the hot and cold ends, (TH–TL). As
expected, both power and efficiency increase as (TH–TL) increases;
however, their behaviors against the increase in (TH–TL) are
differ-ent. Power increases almost linearly with the increase of (TH–TL);
whereas efficiency increases more rapidly at lower value of (TH–TL), but its increase rate slows down dramatically at high value
of (TH–TL).
4.5. The effects of engine speed
Cases 1, 13, 14, 15, and 16 are in this group of test cases.Fig. 12
shows the variations of averaged temperature and heat transfer rates at three different engine speeds, 30, 60, and 120 rpm. At lower engine speed, the time for heat transfer between working gas and hot- or cold-end wall is longer. This longer heat transfer time allows working gas to be heated to a higher temperature level in the expansion chamber or to be cooled to a lower temperature level in the compression chamber. Such tendency can be seen in
Fig. 12(a), where the case with engine speed of 30 rpm has the
highest expansion chamber temperature and the lowest compres-sion chamber temperature. This phenomenon produces smaller temperature gradients in both chambers, which, in turn, results
Vr
Power (W) Efficiency (%)
1.16 1.18 1.2 1.22 1.24
Fig. 10.Variations of engine power and efficiency versusVr.
TH-TL(K)
Power (W) Efficiency (%)
40 60 80 100
Fig. 11.Variations of engine power and efficiency versus (TH–TL).
(a)
Fig. 12.Variations of averaged temperature and heat transfer rates in expansion and compression chambers of three cases with three different engine speeds, namelyx= 30, 60, and 120 rpm, respectively; (a) temperature variations and (b) heat transfer rate variations.
Engine speed (rpm)
in smaller heat transfer rates as shown inFig. 12(b). However, even though the heat transfer rates in the case of 30 rpm are the small-est in both chambers, the case still produces the largsmall-est amount of heat transfer within an engine cycle due to the longer time for heat transfer within a cycle.
The variations of engine’s power and efficiency versus engine
speed are shown inFig. 13. It is noticeable that engine speed poses
strong impact on engine power, and the latter is seen to increase monotonically with the increase of the former. Here, engine power increases from 0.234 to 0.644 W as engine speed increases from 30 to 120 rpm. On the other hand, engine speed only has mild effect on efficiency as the efficiency only varies from 4.82% to 5.04% within the same rage of variation in engine speed.
5. Conclusions
An in-house three-dimensional CFD code has been used to investigate the effects of several geometrical and operational parameters on the performance of a low-temperature-differential
c
-type Stirling engine. These parameters are strokes of powerpis-ton and displacer, radius of power pispis-ton, temperature difference between the hot and cold ends, and engine speed. The results
includep–Vdiagrams, variations of averaged temperature and heat
transfer rates in expansion and compression chambers, and varia-tions of engine power and efficiency versus these parameters. Some conclusions drawn from the results are as follows:
1. Power piston stroke affects strongly on engine power but weakly on heat transfer rates. Both engine power and efficiency are seen to increase as power piston stroke increases.
2. Both engine power and heat transfer rates increase as displacer stroke increases. However, this parameter poses much stronger effects on heat transfer rates than on engine power. Conse-quently, an increase in displacer stroke slightly increases engine power but decreases efficiency due to the rapid increase in rate of heat input.
3. Power-piston radius affects engine performance in a very simi-lar manner as power piston stroke does. Nevertheless, it is a more sensitive parameter affecting engine performance than power piston stroke because power piston swept volume is pro-portional to the square of this parameter. In fact, the effects of both parameters on engine performance can be represented by the effects posed by a single parameter, engine’s compres-sion ratioVr.
4. As expected, engine power and efficiency increase as the tem-perature difference between the hot and cold ends increases.
5. Engine power is strongly influenced by engine speed. It increases almost linearly with engine speed. Efficiency, on the other hand, is less sensitive to engine speed.
Acknowledgement
This work was supported by the Ministry of Science and Tech-nology, Taiwan, Republic of China, under the grant number MOST 103-2622-E-168-006-CC3. The authors are very grateful for the financial support.
References
[1]Toghyani S, Kasaeian A, Hashemabadi SH, Salimi M. Multi-objective optimization of GPU3 Stirling engine using third order analysis. Energy Convers Manage 2014;87:521–9.
[2]Lia T, Tang DW, Lia Z, Du J, Zhou T, Jia Y. Development and test of a Stirling engine driven by waste gases for the micro-CHP system. Appl Therm Eng 2012;33–34:119–23.
[3]Kongtragool B, Wongwises S. A review of solar-powered Stirling engines and low temperature differential Stirling engine. Renew Sustain Energy Rev 2003;7:131–54.
[4]Mahkamov K. An axisymmetric computational fluid dynamics approach to the analysis of the working process of a solar Stirling engine. J Sol Energy Eng 2006;128:45–53.
[5]Parlak N, Wanger A, Elsner M, Soyhan HS. Thermodynamic analysis of a gamma type Stirling engine in non-ideal adiabatic conditions. Renew Energy 2009;34:266–73.
[6]Karabulut H, Aksoy F, Qzturk E. Thermodynamic analysis of abtype Stirling engine with a displacer driving mechanism by means of a lever. Renew Energy 2009;34:202–8.
[7]Timoumi Y, Tlili I, Nasrallah SB. Design and performance optimization of GPU-3 Stirling engines. Energy 2008;GPU-3GPU-3:1100–14.
[8]Mahkamov K. Design improvements to a biomass Stirling engine using mathematical analysis and 3D CFD modeling. J Sol Energy Eng 2006;128:203–15.
[9]Salazar JL, Chen WL. A computational fluid dynamics study on the heat transfer characteristics of the working cycle of ab-type Stirling engine. Energy Convers Manage 2014;88:177–88.
[10] Chen WL, Wong KL, Po LW. A numerical analysis on the performance of a pressurized twin power piston gamma-type Stirling engine. Energy Convers Manage 2012;62:84–92.
[11]Chen WL, Wong KL, Chen HE. An experimental study on the performance of the moving regenerator for ac-type twin power piston Stirling engine. Energy Convers Manage 2014;77:118–28.
[12]Chen WL, Wong KL, Chang YF. A computational fluid dynamics study on the heat transfer characteristics of the working cycle of a low-temperature-differentialc-type Stirling engine. Int J Heat Mass Transf 2014;75:145–55. [13]Lebon GSB, Patel MK, Djambazov G, Pericleous KA. Mathematical modelling of
a compressible oxygen jet entering a hot environment using a pressure-based finite volume code. Comput Fluids 2012;59:91–100.