Human resources planning and management in the Instituto Colombiano Agropecuario
48
0
0
Texto completo
(2) The Internationa1 Service for National Agricultural Research (ISNAR) began operating at its headquarters inThe H4gue, Netherlands on September 1, 1980. It was establishedby th~ Consultative Group on International Agricultural Researeh (CGIAR), on the basis of recommendations from an international task force, for the purpose of assisting governments of developing oountries to strengthen their agricultural researeh. It is a non-profit autonomous agency, international in character, and non-politica~ in management, staffing and operations. Of the thirteen centers in the CGlAR network, ISNAR is the only one which focuses primarily on national a9ricult~ral research issues. It provides advice to governments, upon request, on organization, planning, manpower development, staff requiremente, financial and infnstructure requirements, and related matters, thus compliementing the activities ef other assistance agencies. Additionally, ISN~R has an active training and communications program which cooperates wlith national agricultural research programs in developing countries. ISNAR also plays an active role in assist~ng these national programs to establish links with both the internationa~ agricultural research centers and donors. ISNAR is supported by a number of the members of CGIAR, an informal group of approximately 30 donors; it includeslcountries, development banks, international organizations, and foundations. In 1985, funding for ISNAR's core program waS provided by: Australiill Belgiu. Canillda European Economía Community Federal Repub1ic of Germany Ford Foundation France Ire1and Ita1y. Nether1ands i'bilippines Spain Sweden Switzerland United 1109dom United States Agency for lnternational Development World Bank Citation: Internationa1 Service for Nationa1 Agricultural Research. Report to Government of Colombia, Ministry ef ¡Agriculture, Colombian Institute of Agriculture, Human Resources Planníng and Management in the Colombian lnstitute ef Agriculture, Colombia. 1985. The Hague, NetherlandS..
(3) ",,'":""",. "',_O". ¡. vHUMAN RESOURCES PLANNING. ANO MANAGEMENT IN THE INSTITUTO COLOMBIANO AGROPECUARIO. December 1985. lsnar IntemaHanal Service tar Natlanal Agricultural Research.
(4) 1. Table of Contents CHAPTER l.. INTRODUCTION. 1. 2.. A HtJMAN RESOURCES DATA BASE Data Sources and Collection Instruments Data Analysis and Dissemination. 3 3. 3.. 4.. PROFESSIONAL EVALUATION The General Administrative Questionnaire The Technical Premium Points Scheme Reforming the Professional Evaluation System CAREER STRUCTURE AND REMUNERATION Grade and Basic Sa1ary The Technical Premium Allowance The Level of Remuneration Designing A New Conditions of Service Scheme Improving Professional Income Levels. 6. 9 9. la 17 21 21. 27 30. 41 42.
(5) ii. LIST OF TABLES. Table 1. Existing and proposed descriptors of the professional personnel data base.. 4. Table 2. Propased disciplinary research specializations for professional personnel data base.. s. Table 3. Frequency distributions of publication points for first degree only and postgraduate vesearchers, 1985.. 10. Table 4. Number and percentage distribution of technieal premium points, 1985.. 12. Table S. Frequeney distribution of achievement points for first degree only and postgraduate researehers, 1985.. 14. Table 6. Frequeney distribution of distinction points for first degree only and postgraduate researchers, 1985.. 16. Table 7. Frequeney distribution of responsibility points for first degree only and postgraduate researchers, 1985.. 17. Table 8. Grades and salary sca1es for professiona1 personnel, lCA, 1985.. 22. Table 9. Professional qualifieation points awarded for qualifications and years of experience, 1985.. 21. Table'10. Relationship between professional qualifieation (pq) and teehnieal premium (tp) points and technieal premium as pereentage of basie sa1ary 1985.. 29. Table 11. Relationship between professional qualifieation and teehnieal premium points and amount of technica1 premium ($'000), 1985.. 29. Table 12. Percentage frequeneies of the techniea1 premium (expressed as pereentage of basie salary) by qualifieation group, 1985.. 30. Table 13. Techniea1 premium of basie salary for thirty randomly se1ected lCA researchers with more than ten years experience, 1975-76 and 1984-85.. 31. I.
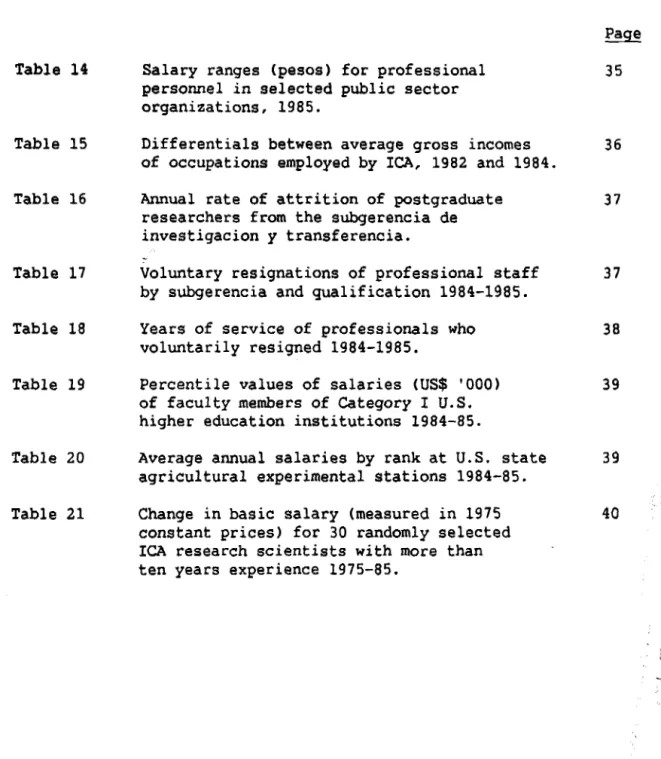
(6) Ei. Table 14. Sa1ary ranges (pesos) for professiona1 personnel in selected public sector organizations, 1985.. 35. Table 15. Differentia1s between average gross incomes of occupations emp10yed by lCA, 1982 and 1984.. 36. Tab1e 16. Annua1 rate of attrition of postgraduate researchers from the subgerencia de investigacion y transferencia.. 37. Tabla 17. Voluntary resignations of professional staff by subgerencia and qualifieation 1984-1985.. 37. Tabla 18. Years of service of professionals who voluntarily resigned 1984-1985.. 38. Table 19. Percentile values of salaries (US$ '000) of faculty members of Category l U.S. higher education institutions 1984-85.. 39. Table 20. Average annua1 salaries by rank at U.S. state agricultural experimental stations 1984-85.. 39. Table 21. Change in basie salary (measured in 1975 constant prices> for 30 random1y se1ected lCA research scientists with more than ten years experience 1975-85.. 40.
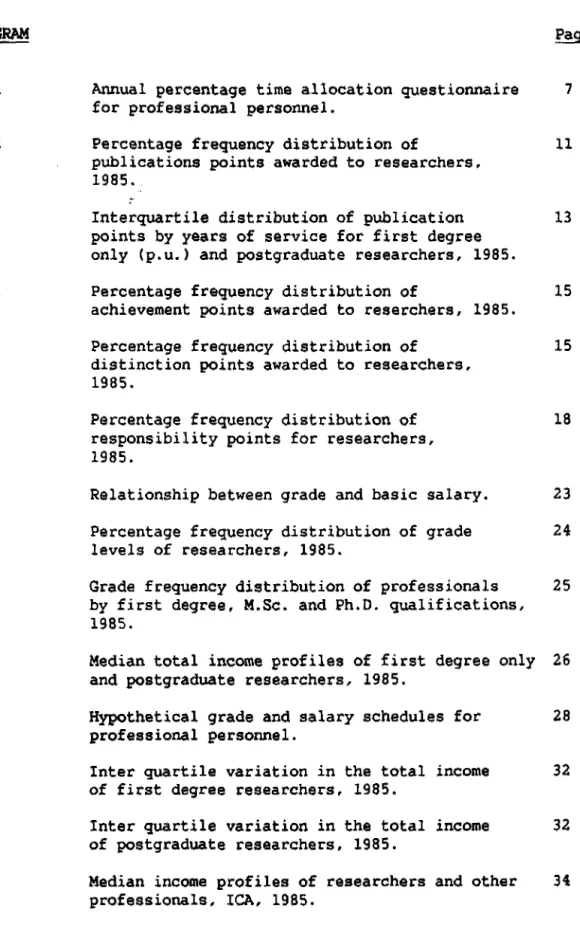
(7) iv. DIAGRAMS DIAGRAM 1. Annual percentage time allocation questionnaire for professiona1 personne1.. 2. Percentage frequency distribution of pub1ications points awarded to researchers. 1985.. 11. 3. Interquartile distribution of pub1icatian pointa by years af service for first degree only (p.u.) and pastgraduate researchers, 1985.. 13. 4. Percentage frequency distribution of achievement paints awarded to reserchers, 1985.. 15. 5. Percentage frequency distribution af distinetion painta awarded to researchers. 1985.. 15. 6. Percentage frequency distribution of responsibility points for researchers, 1985.. 18. 7. Relationship between grade and basie salary.. 23. 8. Percentage frequeney distribution of grade levels of researchers, 1985.. 24. 9. Grade frequency distribution of professionals by first degree, M.Sc. and Ph.O. qualifications, 1985.. 25. 7. 10. Median total income profiles of first degree only 26 and postgraduate researchers, 1985.. 11. Hypothetical grade and salary schedules for professional personnel.. 28. 12. Inter quartile variation in the total income of first degree researchers, 1985.. 32. 13. Inter quartile variation in the total income af postgraduate researchers, 1985.. 32. 14. Median income profi1es of researchers and other professiona1s, rCA, 1985.. 34.
(8) CHAPTER 1. INTRODUCTION This review forms part of the on-going program of assistance by the International Service for National Agricultural Research (ISNAR) to the Instituto Colombiano Agropecuaria (ICA). The program, which was formally initiated in April 1983, is intended to assist lCA in improving the planning and management of the organization. Four main subject areas have been identified as being of particular concern, name1y pIanning and programming, human resources development, organizational structure and management trairiing. The general objective of this review is to provide a preliminary analysis and, where appropriate, make recommendations concerning the planning and management of human resources in lCA. At the request of lCA, the review focused on three specific areas: • • •. the development of a human resources data base the evaluation of professional personnel promotion. remuneration and other conditions of service policies, procedures and practices.. In addition, particular attention was devoted to professionals working as agricultural scientists as opposed to those engaged in control and service activities. The review was undertaken by Dr. Paul Bennell. Research Fellow, ISNAR, with the assistance of his lCA counterpart Dr. Miguel Cerda, Head, Personnel Departroent, and Dr. Jorge Ardila Vasquez, Subgerente de Investigacion y Transferencia. Dr. Bennell visited Colombia froro 13-27 Qctober. During his stay, he had discussions with senior managers at ICA's head office in Bogota and also interviewed representative groups of managers and researchers and extension professionals at three institutions, LIMV, Palmira and Tibaitata..
(9) CHAPTER 2 AHUMAN RESOURCES. D~T~. BASE. Ihe development of a comprehensive and up-to-date computerized human resource data base ls a prereguisite for effective human resource planning and management in an organization as large and complex as lCA. Ihis data base can be used for both administrative and analytical purposes. Ihe Personal Department at lCA have already a well established computer syste,,; As can be seen from Table 1, a large number of individual descriptors have been computerized and are up-dated on a regular basis. The most important function of this data base at present is in relation to salary administration and this is reflected in the kinds of data which are inputted on an on-going basis. The performance of lCA as an agricultural research, extension and services organization is determined first and foremost by its professional personnel. lt is recommended therefore that the existing computerized data set for this key group of personnel is developed still further so that it contains all essential information concerning the personal characteristics and work activities of each memher of the professional cadre. The additional variables which it is suggested are included in this professional personal data base (PPDB) are listed in Tables 1 and 2. Since the PPDB is to be used both for analytical and administrative purposes, the data should exist in two basic forms: (i). a scripted personal "file" for each individual reguiring a conventional word processor software package. (ii) numerically coded as part of a unified data set for the purposes of guantitative analysis.. Data Sources and Collection Instruments There are a numher of institutional sources from which the additional descriptors for the PPOB can be obtained, most notably the Off ice of Education and Training and, for career history and remuneration, the individual files of professional personnel. lt is also recommended that each professional in lCA is required to complete a standard curriculum vitae (CV) from which would contain comprehensive information on the career of each individual up until the present time. This baseline CV can be used to obtain data whichmay well not be contained in the records kept by lCA Head Off ice in Bogota. Once this curriculum vitae has been completed, it will be necessary to ensure that it is up-dated every year. It ls recomrnended therefore that an appropriately designed "annual professional questionnaire" is completed by a11 professional personnel every year. The first part of this guestionnaire would request each professional to specify any changes in his personal and professional situation which have occurred during the last twelve months (e.g. training courses attended, new publications). In addition, however the annual questionnaire return would be used to collect two other types of data (i) annual task time allocations by main activities which, in the case oí research scientists, would be broken down by division, program and project (ii) in servioe training needs in terms of area/subject priorities, possible institutions, dates of attendance and sponsors..
(10) Table 1:. Existing and proposed descriptors of the professional personnel data base.. Data Area. o:::r. Existing Computerized Descriptors. Proposed Additional Computerized Descriptors. Background lnfonmation. Hame, identiftcation number. marital status, sex, birthdate. Nunber children. First degree training. Subject. Dates commencement and completlon faculty and un;verSity country, grade. Graduate-level recruitment (l.e. direct from university). Date of recruitment. Recruitment examination results. Professional recruitment (of experienced personnel). Date of recruitment. Grade(s}, previous employer(s). Postgraduate degree training. level and subject. Institution(s). country(ies), date(s) of commencement and completion (actual and expected), overall grade(s), sponsor(s). Career history ICA. Previous positton(s), statton(s)/institute(s), dates of promotions and institutidn transfers. Current position ICA. ·Cargo funct10na1", ·cargo escalafon", 10cation and region. More detailed specialization data (see Tab1e 2). Attrition. Date of departure, reason. New employer. Evaluatlon. Current publications, realizacionces and responSibility points for technical premiun. Previous year end technical premium pOints. Remuneration. Grade, salary, "gastos de representación-, technical premium and seniority allowances. Previous year end bastc salary and % technical premium. l.. In service tratning undertaken/expected. Activity title(s). institution(s), country(ies), date(s), qualificatton(s), sponsor(s). In service training needs. Area/subject priorities. possible ;nstitut;on5, dates, sponsors. Professional activlties Publtcations. Division program and project. Task-time al1ocatlons by maio activities (dlvisions and programs and projects, where appropriate) Ha;n details (title, publication, date).
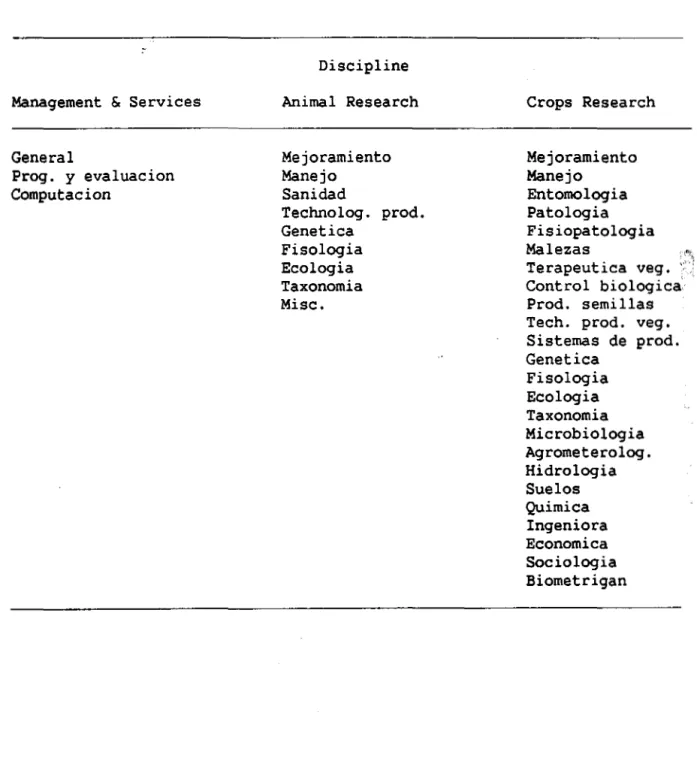
(11) 5. Table 2: Proposed disciplinary research specializations for professional personnel data base.. Discipline Management & Services. Animal Research. Crops Research. General Prog. y evaluacion Computacion. Mejoramiento Manejo Sanidad Technolog. prod. Genetica Fisologia Ecologia Taxonomia Misc.. Mejoramiento Manejo Entomologia Patologia Fisiopatologia Malezas r.,., Terapeutica veg. \ í Control biologica: Prod. semillas Tech. prod. veg. Sistemas de prod. Genetica Fisologia Ecologia Taxonomia Microbiologia Agrometerolog. Hidrologia Suelos Quimica Ingeniora Economica Socio logia Biometrigan I,;tf.
(12) 6. Sectiona 2 and 3 of the annual proíeasional questionnaire would focus on the collection of these two sets of data. An example of the kind of form that can be used to obtain time allocation data is presented in Diagram l. Such data are particularly important for the planning and programming processes in an orqanization such as lCA. Finally, it ia recommended that a simple appointment and resiqnation questionnaire is completed annually by all institution/unit heads in ICA. The main objective of this questionnaire is to gather systematica11y information concerning the sources oE recruitment of experienced professional staff (i.e. not qraduates straight from university) anql; more important still, the destinations of those who have resigned to take up appointments elsewhere.. Data Analysis and Dissemination with the ful1y developed PPDB described above, it will be possible to undertake quantitative analyses of al1 major aspects of the deployment and utilization of professional personnel in lCA. The most important areas oí analysis inc1ude: •. Stock characteristics: years of service and experience, qualification and age profiles broken down (cross-tabulated) according to geographical location, grade, specialization, division, program and project (where appropriate, using "full-time equiva1ent" units of measurement).. •. Flow characteriatics: subdivided into the three major areas of recruitment, attrition and intra-institutional transfers and analysed using the same set of factors as described above.. *. Training and other skill upgrading activities.. *. Conditions of service: grading and remuneration profiles.. lt is important that this human resources analysis ls made available to professional personnel, and particularly those in management positiona, throuqhout ICA. lt ia recornmended therefore that an annual human reaources report ls produced by the Personal Department and widely distributed..
(13) 7. Diagram 1; Annual percentage time allocation questionnaire for professional personnel.. Annual Percentage Time Alloeation Questionnaire 1985 Name:. Personal No.:. Location and Dept.: PROGRAM ANO PROJECT ACTIVITIES. Project. Program. ·· ·· ·· ·· ·· ··. % Total Time Research. · ··· - ···· - ···· - · ·· · - · ·· · - ····. -. ··· • .. • ·· ·· · ··· ···. ··· • ·· ··• ··· · ·· · ... -Extenslon7 Services. ··· • .. ··· ··· ··· ···. Coordination. ·· · ··· ··· ··· ··· ···. OTHER ACTIVITIES % Total Time. 1.. 2.. 111. 111. * •. ..... 3. Education and Training Management and Administration. Signature Offieer Signature Station/Unit Head Date. .. .. I .. I ...
(14) CHAPTER 3 PROFESSIONAL EVALUATION At various times during the last fifteen years, ICA managernent has attempted to evaluate the performance of professional personnel using two distinct and unrelated types of schernes. For expositional convenience, these can be called the general administrativa and the technical premium point schernes.. The General. A~inistrative. Questionnaire. Since 1970 there has be en a succession of different types of annual evaluation questionnaires in ICA. It is generally agreed that al1 of these were inadequate instruments for meaningfully assessing the performance of ICA personnel and, in particular, members of the professional cadre. While there were considerable variations in the design of these evaluation questionnaires for professional personnel, a11 are subject to similar sets of criticisms. The most serious of these include:. *. No real attempt was made to obtain precise technical assessments of the actual performance of individual professionals. Instead reliance was placed on assigning grades or marks to lists of performance factors (up to ten in most questionnaires) which were exeessively general and often had little direet relevanee as indieators of actual performance (e.g. "spirit of collaboration", "interpersonal relations"). Very limited participatioin in the evaluation process by the evaluee. Excessive relianee was placed on the written questionnaire which was completed by managernent and merely signed by the evaluee. Only in cases of a negative assessment did any serious interaction take place between the two parties. This absence of participation was symptomatic of the strong underlying sense of anxiety among most ICA managers about the personnel evaluation process.. *. The evaluation was simply concerned with past performance with no attempt to use the evaluation process as a basis for the formulation of specifie plans for individual performance improvement during the following year.. *. The evaluation had no impact on the individuals grade or level of remuneration. The primary purpose of the evaluation was merely to identify individuals who were performing unsatisfactorily. This excessively negative approach tended to undermine consistently the potential value of personnel evaluation as a powerful management tool.. Faced with these deep seated problems, the use of the annual written evaluation questionnaire among professional personnel was effectively abandoned in 1980..
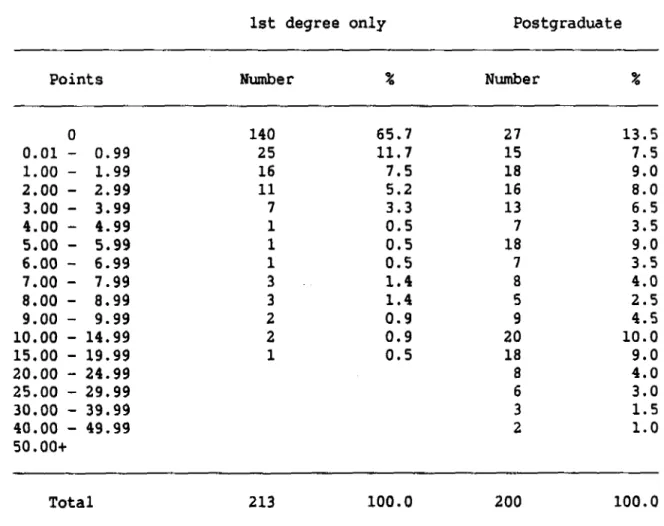
(15) la. The Technical Premium Point Scheme Ihe technical premium, which was introduced in the early 1970s, was originally intended as an important monetary incentive for professional personnel. Ihe siza of the technica1 premium ia based on an annual evaluation of individual output with respect to three separate performance indicators namely publications. achievements. (realizacionces) and distinctions. Evaluation points systems have been devised in order to asaess levels of performance for each of theae aspects of technica1 output. Additional paints are also awarded for the level of manag~rial responsibility. The following diseussion will consider the design and operation of ea eh of these points ayatems. Publications The overall frequency distribution of publication points awarded to lCA researchers in 1985 ia shown in Diagram 2 and Table 3. Slightly over 40% did not obtain any publieations points and only 29.0% reeeived five or more paints i.e. the equivalent of sole authorship of 2.5 seientific articles per annum. Further disaggregation reveals that the bulk of publieations points (over 87.1%> were awarded to researehers with postgraduate degree qualifications (see Table 4 and Diagram 3). Table 3: Frequency distributions of publications pointa for first degree on1y and postgraduate researchers, 1985.. 1st degree on1y. Postgraduate. Pointa. Number. %. Number. O. 140 25 16. 65.7 11.7 7.5 5.2 3.3 0.5 0.5 0.5 1.4 1.4 0.9 0.9 0.5. 27 15 18 16. 0.01 1.00 2.00 3.00 4.00 5.00 6.00 7.00 8.00 9.00 10.00 15.00 20.00 25.00 30.00 40.00 50.00+. 0.99 1. 99 2.99 3.99 4.99 5.99 6.99 7.99 8.99 9.99 14.99 19.99 24.99 29.99 39.99 49.99. Total. 11. 7 1 1 1 3 3. 2 2 1. 213. 100.0. 3 2. 13.5 7.5 9.0 8.0 6.5 3.5 9.0 3.5 4.0 2.5 4.5 10.0 9.0 4.0 3.0 1.5 1.0. 200. 100.0. 13 7. 18 7 8 5. 9 20 18 8 6. Source: Tables 3-7 have be en compiled using data provided by the Personnel Department, lCA..
(16) 11. Diagram 2: Percentage frequency distribution of publications points awarded to researchers, 1985.. 40. 30 25. 20. 15 10. :. ~ -r- :-:'~~~ -i'-' ~~.M~,~,~.~.r:"'~.-o:--~, ' o. 0.01- 1.0~ 0.99 1.99. 2.0- 3.0~ 2.1' 3.19. 4.0'.99. a.o-. 5.99. ,. 6.0~. 7.0- 8.06.99 7.99 8.99. Poiot Illtervah. 9.0- 10.0~ 15.0- 20.0- 25.0- 30.0~ 40.0- SO O. 9.91 14.99 19.99 2 •. 9929.99 39.99 49.99 ..
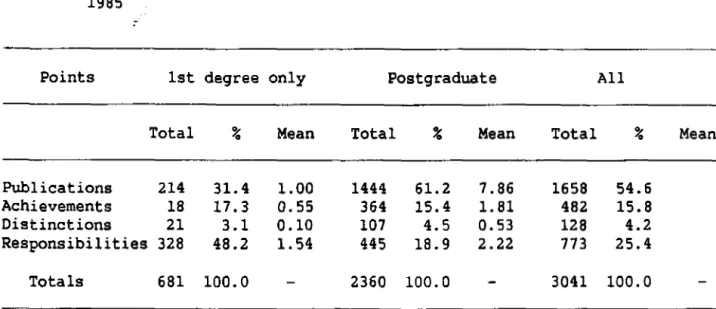
(17) 12 There is no simple linear re1ationship between pub1ications points obtained and the years of service of the individual (the coefficient of determination is on1y 0.05). As can be observed in Diagram 3, there ia a high degree of interquarti1e variation in publicationa points, controlling for years of service (particular1y among the poatgraduate group). Publications peinta account for 54.6% of all the four types of points awarded to researchers under the technical premium acherne and thia rises to 61.2% among the postgraduate group. (See Table 4). Table 4: Number and percentage distribution of technical premium points, 1985 :". Points. 1st degree only Total. Publications 214 Achievements 18 Distinctions 21 Responaibilities 328 Totals. 681. Postgraduate. %. Mean. Total. 31.4 17.3 3.1 48.2. 1.00 0.55 0.10 1. 54. 100.0. All. %. Mean. Total. 1444 364 107 445. 61.2 15.4 4.5 18.9. 7.86 1.81 0.53 2.22. 1658 482 128 773. 54.6 15.8 4.2 25.4. 2360. 100.0. 3041. 100.0. %. A majar factor in the introduction of the technical premium was the nead to provide additional incentives for researchers and other professional personnel to publish. It ia generally agreed that this has facilitated the publication process. However, a number of apecific complaints are commonly levelled at the publication evaluation system by both professionals and managers in ICA. First, there ia a strong perception that the publication criterion favours certain groups of reaearchers and discriminates against others (i.e. it ia inequitable). Most notably, crop geneticists and agronomists engaged on annual crops research are believed to be able to publish relatively more compared say with the same disciplinary groups working in perennial crops or researchers in most areas of livestock production and veterinary research. This is confirmed both by the interview responses of these groups af researchers to questions about the role of publications in the evaluation process and also by the results of multivariate analysis using dummy variables to test for theimpact of discip1inary and commodity specializations. Second, there is a related criticism that the present pub1ication evaluation system distorts research priorities by encouraging researchers to facus on areas of research which are more pub1ishab1e and fosters a short rather than the usually more appropriate long term assessment of a researcher's publication output. Third, the procedures for the evaluation of written material for "internal" publication by ICA (which constitute the bulk of the publications output of ICA's professional personnel) are generally considered to be excessively slaw thus resulting in very long waiting periOds before publication. Finally, the recently adopted rule that, for the purposes af calculating the technical premium, the points awarded for each publication shauld be divided equally by the number of authors is seen as being excessively stringent and may also discourage collaborative cross-discipli~ry research.. Mean.
(18) 13. Diagram: 3.. Interquartile distribution of publication points by years of service for first degree only (p.u.) and postgraduate researchers, 1985. 40.0+ 30.0-39.99. Legend:. 25.0-29.99. rmmm. tilli Postgraduate. [l]] First Oeg~ee (p.U.). 20.0-24.99 15.0-19.99 10.0-14.99 11). c:: o. a... rn. c:: o as. -. 9.0-9.99 B.0-B.99. 7.0-7.99 6.0-6.99. (J. .c. 5.0-5.99. a... 4.0-4.99. ::1. 3.0-3.99 2.0-2.99 1.0-1.99 0.01-0.99 O. 0-3. 4-6. 7-9. 10-1.2. 13-15. 16-18. Years of Service. 19-21. 22-24. 25-27.
(19) l4. Achievement and Distinction Points The percentage frequency distributions of achievement (realizacionces) and distinction points obtained by ICA researchers in 1985 are presented in Diagrams 4 and 5 and Tables 5 and 6. It can be readily observed that these two types of points are awarded to on1y a minority of researchers and that. even among this group, they are generally of much less importance compared with publications points. In aggregate terms, achievement and distinction points accounted for only 15.8% and 4.2% respectively of the total number of technical premium points awarded in 1985 (see Table 4). It can also be observed that there is a three-five fold difference in the mean level of these points obtained by re~earchers with postgraduate and first degree only qualifications. There are two main criticisms of the achievement and distinction evaluation point systems. First, as with publications, it is widely believed that researchers in a small range of "high visibility" disciplines (most notably crop geneticists) are the primary beneficiaries and that this is inequitable. And secondly, while the award of achievements and distinction points is supposed to be directly related to the successful generation of agricultural technology, assessment is normally mada prior to the dissemination of this technology to agricultural producers and before, therefore, it is possible to determine its actual long term impact on production. Table 5: Frequency distribution of achievement points for first degree only and postgraduate researchers, 1985.. 1st degree only. Postgraduate. Points. Nwnber. %. Number. %. O. 181 3 12 8 4. 85.0 1.4 5.6 3.8 1.9. ll5. 1 1. 0.5 0.5. 57.5 3.0 10.5 8.5 7.0 2.0 3.5. 0.01 1.00 2.00 3.00 4.00 5.00 6.00 7.00 8.00 9.00 10.00 15.00 20.00 25.00 30.00 40.00 50.00+. 0.99 1. 99 2.99 3.99 4.99 5.99 6.99 7.99 8.99 9.99 14.99 19.99 24.99 29.99 39.99 49.99. Total. 1. 0.5. 1. 0.5 0.5. 1. 213. 100.0. 6. 21 17 14. 4 7 3 2 1 8 1. 1.0 0.5 4.0 0.5. 1. 0.5. 200. 100.0. 1.5.
(20) 15. Oiagram 4: Percentage frequency distribution of achievement points awarded to researchers, 1985.. eo~------------------------------------------------I. o. ,. ,. I. 0.1)1- 1.'0- 2:0- 1.0- .:0- 5:0-. '.0-. T.0- 8.0-. ,0.11. •• U. 7.11 8.9'. 1.'9. 2.11 3.11. •• 91. 1i.1I. .:010'.0- U'.O- 20.0- 21'.0- ao·.o- 40'.0- 10.0. '.91 14.'9 111.11 24.91 U." 31.11 .,.". Pobt IDU",a". Oiagram 5: Percentage frequency distribution of distinction points awarded to researchers, 1985.. 90. d.;,. eo 70. ~. eo. fQ. f. e ~ >. 50. ¿o. SO 20 10. o~~~/~~~~~~~~~r-~~--~-r-¡r-~,--.--r-.~~~ o. 0.01- LO0.99 1.99. 2.0- 3.02.99 3.99. •. 04.91. 5.05.99. 8.0- 7.0- 8.0'.9' 7.91 e.99. '01.* IDtlr.a¡.. '.0- 10.0- 15.0- 20.0- 25.0- 30.0- .0.0- 50.0. •• " U.99 19.99 24.9929.99 39.99 "9.89. '". "{.
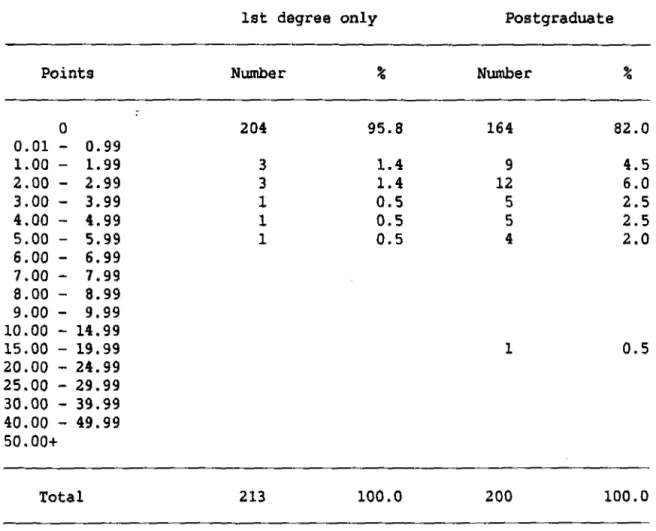
(21) 16 Table 6: Prequency distribution of distinction points for first degree only and postgraduate researchers. 1985.. 1st degree only Points O. 0.01 1.00 2.00 3.00 4.00 5.00 6.00 7.00 8.00 9.00 10.00 15.00 20.00 25.00 30.00 40.00 50.00+. 0.99 1.99 2.99 3.99 4.99 5.99 6.99 7.99 8.99 9.99 14.99 19.99 24.99 29.99 39.99 49.99. Total. Postgraduate. Nwnber. %. Number. %. 204. 95.8. 164. 82.0. 3 3 1 1. 1.4 1.4 0.5 0.5 0.5. 9 12 5 5 4. 4.5 6.0 2.5 2.5 2.0. 1. 0.5. 200. 100.0. 1. 213. 100.0. Responsibility Ihe percentage frequency distribution of responsibility paints in 1985 ia shown in Diagram 6. Theya are awarded on the basis of position only regardless of actual managerial performance. It can be observad in Table 7 that in 1985 all researchers received at least one responsibility point and that most of the positions enjoying the highest responsibilities (4-5 points) were occupied by individuals with postgraduate qualifications. In aggregate terms, respansibility paints are relatively more important for first degree on1y researchers compared with the postgraduate group (48.2% as opposed to 25.4% of the total paints received by each qualification group). There appear to be no major criticisms of the responsibility paints system among professionals in the research division of ¡CA..
(22) 17. Table 7: Frequency distributíon of responsíbílity points for first degree on1y and postgraduate researchers, 1985.. 1st degree on1y POlnts. 0.01 1.00 2.00 3.00 4.00 5.00. O -. Total. 0.99 1.99 2.99 3.99 4.99 5.99. Postgraduate. Number. %. Number. %. 124. 87. 3 2. 58.2 36.2 3.3 1.4 0.9. 58 5 45 5. 43.5 29.0 2.5 22.5 2.5. 213. 100.0. 200. 100.0. 77 7. Reforming the Professional Evaluation System Having briefly analysed the separate cornponents of the technical premium scheme, it is now possible to draw some general conclusions about the nature of the evaluation process of professional personnel, and researchers in particular, in lCA and, where appropriate. indicate possible improvements. In a fundamental sense, the technical premium does not provide the basís for a comprehensíve and thorough evaluation process of professíonal personnel. There are a number of deep seated reasons for this. First, because the technícal prerníum has become to be synonomous with professional evaluatíon, the evaluatíon process itseIf has tended to become overly bureaucratized and centralized and genera1ly does not serve as a key managernent tool for generating motivation and cornmitment among professíonals. In part, this has been because the majoríty of lCA managers feel uncomfortable about evaluating their professíonal personne1. This ís manifested ín common1y expressed anxieties about the inherent subjectivity of the evaluation process and the ínter-personal conflícts that are 1ikely to arise. With this strong degree of managerial aversion to professional eva1uation. the tendency has been to try to externalise the evaluation process via the adoptíon of allegedly more objective evaluation criteria and the displacement of responsibility leadinq to excessive centralízation..
(23) 18. Diaqram 6: Percentaqe frequency distribution of responsibility points for researchers, 1985.. 50 40 30. 20. 10. o. •. o. •. 0.01- 1.0O.U 1.JI. •. •. 2.0- 3.02.,9 3.U. •. 4.04.U. •. 1.01.99. •. i. I. 1.0- '1.0- 8.01.99 1.99 8.98. VALUES. I. I. I. •. •. t. i. i. 9.0- 10.0- 15.0- 20.0- 25.0- 30.0- 40.0- 50.0. 9.99 14.119 19.99 24.99 29.99 31.91 49.99.
(24) 19. Secondly, and closely related to the previous point, for the large majority of professionals (including researchers), the technical premium normally represents only a small proportion (less than 15%) of total income. In practice, formal qualifications and experience are the two key determinants of remuneration, so that an individua1's grade and salary bear no direct relationship to current performance (i.e. they are not based on meritocratic factors). In short, the evaluation system in tCA ia poorly integrated with the grading and salary systems and is, as a consequence, regarded as being of relatively periphera1 importance by both managers and professiona1s. Finally, asan attempt to assess the performance of researchers, the technical premium scheme is based mainly on ex ante as opposed to ex post evaluation criteria. Part of the reaaon for this is that the technical premium is ca1culated ann0811y. With such a high degree of frequency, it ia difficult to derive a more meaningfu1, longer term assessment of the actual impact of the technology generation process in lCA on agricultura1 production in the country. Given the relatively little attention that has been devoted to measuring research impact, primary reliance has been placed on incremental intermediate products (e.g. publications, pre-release varieties) of the research process which, for the reasons discussed earlier, may be poor proxies of research effectiveness. Greater emphasis on impact in the evaluation process would require more involvement by lCA's clients in the direct evaluation of research and extension activities and thus, indirectly, of researchers themselves. Finally, the technical premium is. as its name indicates, geared towards the assessment of technical performance. However. management performance is also of critical importance in determining the overall effectiveness of the research system and as such shou1d be forma1ly incorporated into the evaluation system. Attitudes towards personne1 eva1uation are a combination of lCAls own institutional culture and the general cultural values which are characteristic of Colombian society. Because these values are deeply engrained, it is not surprising tht the majority of professionals and managers in lCA are pessimistic about the prospects for reforming the evaluation scheme. lt is abundantly clear however that any overall management strategy to improve scientific performance in lCA will founder unless significant changes are made to in the professiona1 eva1uation scheme. While the "room for manoeuvre" may be fairly limited in the short terro, with strong and consistent support from senior lCA management it should be possible in the longer term to carry through these necessary reforms. The following discussion will consider the most important characteristics of an effective personnel evaluation system for professional staff in lCA. The evaluation system must comprehensively and accurately assess the performance of professional personnel throughout their careers in lCA. Wherever possible, this assessment should be based on a single performance criterion, namely the actual impact of the technology generated and dissemminated on the welfare of lCA's clientele, the.
(25) 20. producers and consumera of agricultural products in Colombia. Determining in a precise manner the extent and form of impact is complex and should therefore be regarded as an integral part of ICA's overall research procesa with an appropriate cornmitment of human and financial resources. Io then ascertain the precise contributions of research, extenaion and other professionals in achieving welfare improvements is more complicated still but can be accomplished with well developed monitoring and evaluation management systems. Ihere are clear implications for the design of a personnel evaluation system if this fundamental orientation is adopted. First, meaningful evaluations areonly likely to be feasible every three-five years for the majority of professional personnel. Second, given that the evaluation system will be based on performance, the importance of formal qualifications and experience per se should be minimal. Furthermore, while publications output should continue to be an important measure of performance, given the preeminence of the impact factor, publications per ~ should play a much reduced role in the evaluation process and more attention should be devoted to ascertaining more precisely the relative value of publications vis-a-vis one another (for example, by greater emphasis on the publication of research findings in external (non-ICA) publications and the use of publications citation analysis). Ihird, there should be active participation by all the major groups of actors in the evaluation process namely, managers, clients, peers and the individual him/herself. Managers most intimately involved with the researcher's work should playa major role. In particular, program leaders should be central figures. Ihe evaluation process should be decentralized and responsibility given to specially convened evaluation cornmittees comprised of members with proven technical and administrative competence. Ihe professional's colleagues (peers) should play an important, indirect evaluation role vía theír regular assessments of his/her work as part of the annual planning, prograrnming and evaluation processes. And finally, the individual should also be expected to demonstrate how his/her activities have contributed to the increased welfare of clientele and, on the basis of a series of interviews with the appropriate manager, reach clear agreements on past performance and develop appropriate performance targets for the future. Finally, the evaluation process must become an integral and fundamental component of the corresponding grading and salary structures. More specifically, the outcome of the evaluation process should be the primary determinant of individual career progression and remuneration. Ihis will be discussed further in the next chapter..
(26) CHAPTER 4. CAREER STRUCTURE Mm mERATION Grade and Basic Salary The grades and corresponding basic salaries for professional personnel employed by ICA in 1985 are presented in Table 8. There are no formal job titles associated with these grades (e.g. researcherl extensionist, senior researcher/extensionist, etc.) nor are there any specifie 'pro~ion points' which must be successfully negotiated before progressing to higher grades. As can be observed in Diagram 7, the relationship between grade and basie salary is strietly linear. The top-bottom income differential is 3.67 which is fairly typical for agricultural research organizations in both developed and developing countries. The percentage frequency distribution of researchers by grades in 1985 is shown in Diagram 8. In theory, it is possible for a researcher entering with a Ph.D. to reach the maximum grade after 24 years. An individual grade is equal te the number of "professional qualifications" points awarded each year divided by three. These points are based on just two factors, formal academic qualifications and the years of recognized experience. As can be seen from Table 9, the qualification factor is of paramount importance in determining grade and basic salary. A Ph.D. holder receives three points for every year of experience as opposed to only one for a professional with a first degree only. This segmentation of the grading structure according to qualification is clearly revealed in Diagram 9.. Table 9: Professional qualificatien points awarded for qualifications and years of experience, 1985. Qualification (fixed). P.U. M.Sc. Ph.D.. 7.5 - 9.0 10.0 13.0. Experience (points per year experience) 1.0 2.0 3.0. Source: As Table 8. There are a number of major advantages of this system of grading. First, it is simple and thus easily understood by employees and relatively straightforward to administer. Second, it provides a major incentive for professionals to obtain postgraduate qualifications. This can be clearly seen in Diagram la which shows the median income profiles for first degree only and postgraduate researchers controlling for years of service. The average inter-qroup income differential is approximately 20% in the 5-10 years range and continues to increase rapidly thereafter reaching approximately 50% after 20 years of service. And thirdly, this grading system ensures that the most productive research professionals, namely those with postgraduate qualifications, are appropriately rewarded..
(27) 22. Tabla 8: Grades and salary seales for professional personnel lCA, 1985.. Grade. Basie Salary. Absolute Annual Inerease. Annual % Inerease. 2420 3355 3630 3300 3178 3325 3324 3107 3161 3270 1738 3210 3852 3103 3478 3210 2942 3531 3050 3417 3478 3417 3371 3370 3371 3156 3157 3049 2782 2675 272-9 2461 2407 2247. 6.1 8.0 8.0 6.8 6.1 6.0 5.7 5.0 4.9 4.8 2.4 4.4 5.0 3.9 4.2 3.7 3.3 3.8 3.2 3.5 3.4 3.3 3.1 3.0 2.9 2.6 2.6 2.4 2.1 2.0 2.0 1.8 1.7 1.6. lndex. ~. 1 2 3 4 5 6 7 8 9 10 11. 12 13. 14 15 16 17 18 19 20 21 22 23 24 25 26 27 28 29 30 31 32 33. 34 35. 39,380 41,800 45,155 48,785 52,085 55,263 58,588 61.912 65,019 68,180 71,450 73,188 76,398 80,250 83,353 86,831 90,041 92,983 96,514 99,564 103,041 106,519 109,996 113,367 116,731 120,708 123,264 126,421 129,410 132,252 134,927 137,656 140,117 142,524 144,771. 100 106 114 123 132 140 148 157 165 173 1B1 185 194 203 211 220 228 236 245 252 261 270 279 287 296 306 313 321 328 335 342 349 355 361 367. Souree: Sistema de Clasificacion y Rernuneraeion del Personal Teenieo Cientifieo, Division de Personal, lCA, OCtober 1985..
(28) 23. Diagram 7: Relationship between grade and basic salary.. o. 10 .,... o .o(") .,... o('11. ..,. ....... .... o o o. ¡-. >ca. -; (1). Q) !I). tU. ID. -. o.... .o o.,... o m oU). ,...o o. <D. o. 2. 4. 6. 18. 20. Grade. 22 24 26 28 30 32 34.
(29) 24. Diagram 8: Percentage frequency distribution of grade levels of researchers, 1985.. 15 14. 13 12. U. 10 9. e 7 8. S. " 3. Z 1. O O. 3. 5. 7. 9. 11. 13 le 17. Grade. 18 21. Z3 2S Z1 30 33.
(30) 25 f-. , j. Diagram 9: Grade frequency distribution of professionals by first degree, M.Sc. and ph.D. qualifications, 1985.. Legend:. "'. f'/\ /1 . I '1 \. /lO. ~. I~~. ., ., 00. ~. 'o. e o. .,. I I. 60. I. ". U) U). 'O .... ... " '0. :::1. .,. z. \. ,I. Q). E. I. I. a... ..Q. \. --- - -- Ph.O.. I i I. '0. Q). \ i. !V. I~O. ca. _ .. - .. - First Oegre6 Master. I I. 40. ". I. '0. i. ". I I. to. ". ~. 10 .. •. t. J. ". •. •. ,. •. •. '.. 11. .e .. ,. .,. '1. ". '1. l.. Grade. lO.1. 11". .... 11 l.. ., ... ". 10. il. 11. J!'. .... n.
(31) 26. Diagram 10: Median total income profiles of f1rst degree only and postgraduate researchers, 1985.. /.. 140-14~--------------------------------------------------------------/t. 130-13. Legend:. 120-12. -o o o. ... O. Median First Degree. +. Median Postgraduates. 110-11 100-10. ...... el). E o. (). c::. /. -. "'iü o. 1-. e. 50-59~--~~---e. 04---~---'----~-----'----r------.---¡r---~--.---~-----~ 0-3. 4-6. 7-9. 10-1213-1516-1819-2122-24 25-27 28-30 31-33. Year-a of Service.
(32) 27. There are however important deficiencies in this type of grading and salary structure.. *. With the absence of job titles and major promotions points, professionals have little sense of career progression. This has a potentially serious dampening effect on personal motivation.. *. It is not based on the actual performance of the professional. Thus, within each qualification group, there is limited dispersion of basic salary levels controlling for years of experience. This should be contrasted ~ith the relatively high degree of dispersion in the value of technicBi premium points awarded to professionals which are based to a much greater extent on current performance. While it is dangerous to generalize on the basis of only a single year's data, it ia probably not unreasonable to as sume that there are aignificant performance differences among members of each major qualification group over long time perioda and that these should therefore be reflected to a much greater extent than ia the case at present by the grade and income of the professional.. *. Undue emphasis ia placed on postgraduate qualifications thus rendering the grading structure excessively reaearch biased. The acquisition of postgraduate degrees by the 60% of ICA's profesaionals who are engaged in extension and service activities is likely to be of much less importance than in the research area. In fact, there may be no systematic relationship between qualification level and productivity among these non-research professionals.. *. The linear income-grade and service relationships do not correspond to the underlying age/experience productivity profile of most professional personnel. These profiles are more likely to be 'S' shaped, as shown in Diagram 11, with slow productivity growth during the early years of basic skill and knowledge acquisition fol1owed by a mid-career period of accelerating productivity growth and a third phase of progressively slower productivity during the final atages of an individual's career.. The Technical Premium Allowance The second component of the ICA professional remuneration package is the technical premiurn. The four main points components of the technical premium have already been considered in relation to the evaluation of professionals in ICA. It is now necessary to analyze how these points are translated into rnonetary rewards. The technical premium (tp) is expressed as a percentaqe of the basic salary and is calculated using the following equation: %tp. =. tp points prof. qual. (pq) points + 30. The percentaqe values of the technical premium for given values of professional qualification and technical premium points are presentad in Table la. It can be observed that, for any given number of technical pointa obtained by an individual. the technical premium payment expressed as a percentaqe of basic salary falls progressively as the professional qualification points increase. In rnonetary terms. however. a technical premium point is worth approximately $1000 regardless of the professional qualification level of the individual (see Table 11)..
(33) 28. Olagram 11 :. Hypothetlcal grade and salary schedules for professlonal personnel. -;.2. ~CIII. ~i ~gQl~ I-C:. - - - - - - •• dl .. luo •• protll. IIlu, nlltd"li for .tela po,ltloa. Grades.
(34) 29 Tab1e 10: Re1ationship between professional qualification (pq) and technical premium (tp) points and technical premium as pereentage of basie salary, 1985.. 20 4 8 12 16 20 24 38 32. 5 la 15 20 25 30 35 40. 2 4 6 8 10 12 14 16. 30. 40. 50. 60. 70. 3.3 6.6 10.0 13.3 16.6 20.0 23.3 26.6. 2.8 5.7 8.6 11.4 14.3 17.1 20.0 22.8. 2.5 5.0 7.5 10.0 12.5 13.0 17.5 20.0. 2.2 4.4 6.6 8.9 11.1 13.3 13.5 17.8. 2.0 4.0 6.0 8.0 10.0 12.0 14.0 16.0. Table 11: Relationship between professiona1 qualification and technica1 premium pointa and amount of technica1 premium ($'000), 1985.. 2 4 6 8 10 12 14 16. 3. 7. 10. 20. 10 30. 13 40. 17 50. 20 60. 23 70. 2.0 4.0 6.0 8.0 10.0 12.0 14.0 16.0. 2.3 4.7 7.0 9.4 11.7 14.1 16.4 18.7. 2.25 4.50 1.12 9.07 11.30 13.6.4 15.99 18.14. 2.14 4.35 6.57 8.71 10.92 13.06 15.28 17.41. 2.25 4.50 6.75 9.00 11.25 13.50 15.75 18.00. 2.19 4.38 6.57 8.86 11.05 13.24 15.44 17.72. 2.2 4.4 6.6 8.8 11.0 13.2 15.4 17 .6. Source: Compiled using data provided by Personne1 Department, lCA.. :.~L.
(35) The importanee of the teehnieal premium expressed as a pereentage of basie salary is relati~ely small for most research professionals in ICA. In Table 12 it can be observed that only 10% of the first degree on1y group reeeived a technica1 premium which was more than 10% of their basic salary. Although the pereentage teehnical premium values are eonsiderably higher for postgraduate degree holders, nevertheless fewer than 15% and 30% of M.Se. and Ph.D. holders respectively received teehnical premiums greater than 25% of their base salary. Furthermore, it is widely believed by professional personne1 that the va1ue of the teehnical premium has been fal1ing in reeent years. Certainly, the new joint authorship regulation for calculating publieations pointa will tend to depress its;,,'Í;ralue. During the period 1975-1983, however, there doea not appear to have been any aystematie decline in the pereentage va1ue of the technical premium (see Table 13). The relatively minor importance of the technieal premium is a1so indicated by the limited inter-quarti1e dispersion of total income among researchers (see Diagrams 12 and 13). This is particularly the case for first degree only researchers. Table 12: Percentage frequeneies of the techniea1 premium (expressed as pereentage of basie salary) by qualifieation group, 1985.. % basie sa1ary. O -. 4.0 7.0 10.0 13.0 16.0 19.0 22.0 25.0 28.0 30.0 33+. -. 3.99 6.99 9.99 12.99 15.99 18.99 21. 99 24.99 27.99 29.99 33.99. First degree on1y Cum. % % 68.0 15.8 5.7 1.3 3.1 1.3 1.7 0.4 0.9 0.4 0.0 1.3. 68.0 83.8 89.5 90.8 93.9 95.2 96.9 97.4 98.2 98.7 98.7 100.0. M.Se. Cum. % % 22.5 19.5 10.7 14.2 7.7 4.1 3.6 2.4 7.1 2.4 0.6 5.3. 22.5 42.0 52.7 66.9 74.6 78.7 82.2 84.6 91. 7 94.1 94.7 100.0. Ph.D. Cum. % % 0.0 9.8 12.2 7.3 14.6 7.3 4.9 7.3 9.8 4.9 2.4 19.5. 0.0 9.8 22.0 29.3 43.9 51.2 56.1 63.4 73.2 78.0 80.5 100.0. The Level of Remuneration Whi1e the structure and leve1 of remuneration are inextricab1y interrelated, it is usefu1 to treat them separately. In practice, any discussion about the 1evel of remuneration will inevitably focua on the need to improve the conditions of serviee, both monetary and non-monetary, of the occupationa1 group(s) in question. Thua, for professiona1 personne1 employed by ICA, it is necessary to consider in a systematic and objective manner a11 the various arguments (both those in favour and those against) eoneerning the need to improve their eonditions of servíce. It is possible to identify four sets of arguments with.
(36) 31. Tabla 13: Teehnieal premiums as pereentage of basie sa1ary for thirty random1y seleeted lCA researehers with more than ten years experience, 1975-76 and 1984-85.. Individual. 1975. 1983. Change. 1 2 3 4 5 6. 12.04 0.0 32.40 9.40 4.34 12.72 5.0 2.5 0.0 26.10 0.0 0.0 2.78 6.24 0.0 6.11 6.81 12.50 7.12 2.86 0.0 24.42 5.12 10.52 2.70 7.14 7.12 28.00 8.16 2.63. 15.43 5.65 39.10 10.92 3.02 24.75 2.81 7.01 8.37 20.12 9.05 2.59 5.84 4.26 3.87 15.4l 11.89 3.66 6.25 2.08 15.51 15.72 4.40 30.18 1.59 4.07 1.26 35.28 4.78 2.32. + + + +. 7. 8 9 10 11. 12 13 14. 15 16 17 18 19 20 21 22 23 24 25 26 27 28 29 30. Souree: Individual Personne1 Files, Personnel Department, lCA.. ~. ; .... + + + + + + + + +. + +. +.
(37) 32. Diagram 12: Inter quartile variation in the total income of first degree researchers, 1985.. 100-109 Legend: O. +. 90-99. Lower Quartlle Median. O Upper Ouartile. --e o. o o. al. o. 80-89. :'. 70-79. o. .s 'i. o. t-. 60-69. 50-59. e 0-3. 4-6. 7-9. 10-1213-15 16-18 19-21 22-24 25-27 28-30 31-33 Years of Service. Diagram 13: Inter quartile variation in the total income of postqraduate researchers, 1985. 160-169. 150-159~ Legend:. 140-149. o. Lower Ouartlle. .¡... Median. 130-139. O Upper Ouartlle. ..... o. ...... o o. 120-129 110-119. Q). 100-109. E o(,). 90-99. .s. dJ. 80-89. o. t-. 70-79 60-69 SO-S9l. e. j. 0-3. 4-6. 7-9. 10-12 13-15 16-18 19-21 22-24 25-27 28-30 31-33. Years of Service.
(38) \. .. . { ~3. regard to this issue: The intrinsic value of the activity, equity considerations, labour market conditions and trends in the cost of living. The following discussion will deal briefly with each of these in turn for professional researchers in lCA. lntrinsic Valuations The most popular arguments for improved conditions of service focus on the absolute intrinsic value of the activities undertaken. Thus, it must be shown conclusively that agricultural researchers, as a result of their specializ~d technical skills and cornmitment to their assignments, have been respensible for major increases in agricultural productivity which have signficantly improved the welfare of both producers and consumers and enhanced the long term viability of the development process. These valuations of agricultural researchers are particularly important when they are employed by public sector organizations such as lCA because the relevant labour market is influenced more by government policies and practices than market economic forces. In other worda, with 'administered' labour markets of this kind, it is essential that agricultural researchers are able to demonstrate clearly the precise long and short terro impacts of their activities. As noted earlier, lCA needs to do considerably more in the future to assess the on-going technical and economic impact of its research and other activities. Until this is done, 'the intrinsic value' argument for higher pay for agricultural researchers will remain weak and relatively ineffectual. Equity Concerns The second set of argumenta focua on equity issues. With regard to agricultural professionals. there are at least three equity comparisons which need to be taken into account. The potentially most important comparison is to show that the levels of income of other professional groups employed by public sector organizations (who are considered to be of at least egual status) are generally higher than those received by agricultural professionals. lt is essential therefore that the Personnel Department in lCA regularly collects detailed information on the grading and remuneration of professional personnel eroployed by the main public sector organizations. From the limited amount of data that are currently available (see Table 14), it appeara that lCA professionals are paid at least as much and, in some cases, more than other public sector professionala. lf this is the case, then it will be necessary to put additional emphasis on the other sets of arguments in favour of improved conditions of service. [i.e. intrinsic value and market conditions]. The second equity comparison ia between professionals employed by the same organization. Given the importance attached to postgraduate qualifications in determining the grade and thus basic salary of a professional in lCA, the concentration of professionals with these qualifications in the research division means that there are sizeable income differentiala between the main professional groups employed by lCA. This is clearly shown in Diagram 14 which shows the median income values of research and non-research (i.e. extenaion and service) profeasionals in lCA. Not surprisingly, the existence of such sizeable incoroe differences has generated considerable friction among the main professional groupings in lCA which has further exacerbated the creation of effective 'research-extension' linkages and genera11y had a negative.
(39) t:I. f-.a.. 111. IQ. 11 111. El. .c:.. 'ti 3:. .,. a ¡g, Hlf-.a.. ro. Researchers. 160-169. o ::1 ::1 n 111 o. 150-159. I-'EI. .. 111. _ 140-149. o o. ... ID. HI1. no. .. ro. E. 1Il0. H!. =. .Al. 100-10. a. a. • Extenslon/Servlces. 111 11. 90-99. n. ::t ro 11. 80-89. 111. 70-79. 111 ::1. a.. 60-69. o. ~. 50-59. e. 11. ro ro. 111. ID. ~. ..... 1-'. -ro ~III. 120-129. 8110-119 e. (1). 'ti. )::oH!. ? 130-139 -. 111. In ::1 In ..... f-.a.. ro. 11. 0-3. 4-6. 7-9. 10-1213-1516-18. 19-21. Years of Service. 22-24. 25-27 28-30. 31-33. w. ,¡:,..
(40) 35 impact on morale. Consequently, any proposal which would further widen these inter-professional income differentia1s should be treated with extreme caution. On1y under exceptional circumstances, ia such a move 1ike1y to be justified. Table 14: Sa1ary ranges (pesos) for professional personnel in selected pubIic sector organizations, 1985. Instituto de Seguros. Medical Specia1ized Medical General Accts., Lawyers, Pharmacists etc.. 99,403 - 121,231 105,930 15,524 - 82,497. Admin. Lawyers, Acets., Computer Profs.. 63,656 -. ECOPETROL. All Professionals. 81,141 - 113,391+. Banco de la Republica. All Professionals. 44,928 -. Universidad de Los Andes. AlI Professionals. 70,000 - 180,000. I~. AlI Professionals. 70,000 - 180,000. 88,222. 95,000. Souree: Personne1 Department, ICA The third equity comparison is between the income of the occupational group under investigation and the incomes of other groups both within the organization and within society at large. For most governments, particuIarly in deveIoping countries, the need to create a more equitabIe pattern of income distribution is of critica! political and economic importance. In Table 15 it can be observed that there is a fivefold income differential between the average gross income of a professional and unskilled worker employed by I~ and that, if anything, this differential has increased slightly during the last few years. In more general terms, the lCA professional eams four-nine times per eapita income in Colombia. Comparisons of this order of magnitude, which are eommonplace in the developing country context, reveal the severity of the dilemma facing both the agricultural profession itsel! and the government in achieving a reward structure which corresponds with the productivity of the profesaion but is also equitable given the prevailing standards of living of the mass of the population. The challenge for the agricultural profession ia to provide the arguments and the evidence to show that, while increasing theír levels of remuneration may well worsen income inequality, it is an essential prerequisite for the transformation of the agriculture sector which, in the longer te~, will allow for significant improvements in income distribution. These issues must be squarely faced in any serious presentation for improved conditions of service..
(41) 36. Table 15: Differentials between average gross incomes of occupations employed by lCA. 1982 and 1984.. Professional ATe Auxiliar de ténico Secretario Mecanógrafo Operario. 1982. 1984. 1.0 2.8 3.2 4.3 4.9. 1.0. 3.0 3.2. 4.5 5.0. Labour Market Considerations The third set of arguments focus on the state of the labour market for the occupational group under analysis. The main concern is to make an assessment of the appropriateness of the level of income received by an occupational group by analysing the net effect of the interaction of the supply of and demand for these personnel. For agricultural researchers. it is necessary therefore to provide evidence that shows as conclusively as possible that. not only is there a high level of demand for their skills, both nationally and international1y, but that, in relative terms, the level of this demand is higher than for other professional occupations. The 'tightness' of a labour market can be gauged using a number of proxies. At the organization level, the most important demand proxies are the rates of attrition and recuruitment and, where there is an approved establishemnt, the relative number of vacancies. Available attrition data for professional personnel are summarized in Tables 16, 17 and 18. It would appear that the rate of voluntary attrition of postgraduate research personnel has fallen considerably during the last ten years and is now no higher than the rate of attrition among extension and service professionals employed by lCA. Similar1y, vacancies in the professional research and services establishemnts were only 1.9% and 2.2% in Ju1y 1985.* At a general leve1, these data are indicative of the growing surplus of ingenier agronomos and other relevant agricultural science graduates in Colombia. (Sorne 3000-4000 ingenier agronomos were estimated to be unemployed in 1985). While it is true that there are sizeable income differentiala between public and prívate incomes of agricultural scientists, the higher salaries of the latter group are not so much the consequence of a general condition of high demand but rather the simple ability of private companies to pay higher salaries for top quality individuals. In short, therefore, a convincing demand based case for higher pay for all agricultural researchers cannot be seriously advanced on the basia of prevailing national labour market conditions. However, such a case can probably be sustained for Ph.D. level researchers whose attrition ia already fairly high (probably over 10% by the end of 1985) and with stronq expectations that it will increase still further in the future. The danger that this poses to the viability of poetgraduate training programe currently being pursued under the World Bank program is particularly serious. * These lCA attrition and vacancy data for professional personnel should also be compared with corresponding data from other public sector organizations.
(42) 37 Tab1e 16: Annua1 rata of attrition of postgraduate researchers from the subgerencia de investigacion y transferencia.. Year. Stock Number. Attrition. Attrition % stock. 1972 1975 1978 1981 1984. 98 144 179 194 227. 16 47 16 16 5. 16.3 32.6 9.2 8.2 2.2. :'. Source: ICA files and reports. E. Trigo, M. Piniero and J. Ardila, Organizacion de la investigacion Agropecuaria en America Latina, lICA, 1982. Tab1e 17:. Voluntaryl resignations of professional staff by subgerencia and qualification 1984-1985.. lnvest. y Transf.. M.S.. Ph.D.. Total. 5 2. 4 2. la 7. 6. o. 1 3 O. 13. 6. 4. P.U. 1984 1985 2 73. Tota1s. Servicio y Formento P.U.. M.S.. Ph.D.. Total. 6. 1. O. O. 6. 18 12. 2. 2 2. 7 20 16. 23. 36. 3. 4. 43. Where no specific reason for departure ia given in the computer data, it has been assumed that the individual in question 1eft voluntari1y. 2. Up unti1 September on1y.. 3. Listed as resigning durinq the period 1984-1985 but no specific data given..
(43) 38 Table 18: Years of service of professionals who voluntarily resigned 1984-1985.. Invest. y Transf. Years Service 0-5 6-10 11-15 16-20 21+. ~. Servicio y Formento. All. No.. %. No.. %. No.. %. 10 7 4. 43.5 30.4 17.5 4.3 4.3. 17 13. 39.5 30.3 18.6 4.6 7.0. 27 20 12 3 4. 40.9 30.3 18.2 4.5 6.1. 1 1. 8. 2 3. Souree: Unpublished computer data, Personnel Oepartment, ICA. A similar set of conelusions can also be drawn with regard to the demand conditions prevailing in the so-called international labour market for agricultural researchers. In reality, the degree of integration of Colombian agricultural researchers into an international labour market is very limited, being confined to a small group of scientists with at least doctoral level training. And, in relative terms, the actual and potential ability to migrate overseas is likely to be lower among agricultural researehers than among other professional groups (most notably, doctors and engineers), thus putting them in a relatively weaker bargaining position.* Salaries currently paid to agricultural researchers in the United States, which is the most common (subjective) reference point among lCA professionals, are many times higher than those paid in ICA (see Tables 19 and 20), However, the inclusion of these types of comparison in formal salary review submissions to governrnent is unlikely to be helpful (and, may in fact prove to be counterproductive) unless they are strictly confined to those groups of agricultural personne1 where it can be shown that there has been significant international migration in the past and where it can be realistically expected that such migration will continue (and/or commence) in the future.. *. Available data on the international migration of professionals from Colombia are fragrnentary. However, a reeent survey study conducted by COLCENCIAS showed that, in absolute terms, aqriculturists as a qroup comprised the smallest number of professionals returning to Colombia from employment overseas in recent years..
(44) 39. Table 19:. Percentile values of salaries (US$ '000) of faculty members of Category I* U.S. higher education institutions 1984-85.. Percentile:. 95. 80. 60. 40. 20. Professor Associate Assistant Instructor. 53.3 37.0 29.9 25.7. 47.8 34.2 28.0 22.6. 44.8 32.7 26.7 20.8. 40.8 31.1 25.7 19.7. 37.8 29.2 24.5 18.7. *. :-. defined as "institutions characterized by a significant level and breadth of activity in and commitment to doctoral-level education as measured by the number of doctorate recipients and the diversity in doctoral-level program offerings".. Source:. The Annual Report on the Economic Status of the Profession 1984-85, Academe, American Association of University Professors, ~ March - April 1985 Special Issue.. 1". Cost of Living The fourth and final set of arguments concentrate on changes in the cost of living. It is widely argued among professionals in lCA that they: have suffered considerable reductions in the real value of their incomes during the last 10-15 years and that therefore corresponding upward adjustments should be made to their salaries to compensate fully for this. However, as can be observed in Table 21, in a strict sense, this assertion is not supported empirically since all but one of the thirty researchers in the random sample had higher real incomes in 1983 than in 1975. Clearly, therefore, simple cost of living arguments need to be refined in order to demonstrate that, even though there have been sorne real increases in income, these are much less than would be expected as part of the normal career progression of an agricultural professional. Table 20: Average annual salaries by rank at U.S. state agricultural experimental stations 1984-85. US$ '000 Department Head Professor Associate Professor Assistant Professor Instructor. 52,050 47,599 37,287 31,352 22,714. Source: United States Oepartment of Agriculture, Cooperative State Research Service, 1984-1985 Salary Analysis for State Agricultural Experimental Stations, Forestry Schools, Colleges ~t l~~~ !USleqee !nstitute, and Schools of Veterinary. a.ud. Medicine, USDA, July 1~8S.. l~.
(45) 40. Tab1e 21:. Change in basie sa1ary (measured in 1975 eenstant priees) fer 30 randemly seleeted lCA researeh seientists with more than ten years experienee 1975-1985.. Individual. 1975. 1983. 11.4 7.2 16.8 10.8 9.0 9.6 7.8 7.8 9.0 13.8 16.8 8.4 7.2 7.8 7.8 9.0 9.0 7.8 11.4 7.2 12.6 18.0 7.8 7.8 7.2 8.4 11.4 10.2 9.6 7.8. 15.9 9.7 18.3 10.6 10.8 11. 6 8.3 9.7 12.0 14.0 18.3 8.3 9.3 11.1 8.3 12.5 8.8 10.6 14.4 7.3 16.4 19.5 8.3 10.8 9.7 8.8 12.0 11.6 11.0 8.3. %. :'. 1 2 3 4 5 6 7 8 9 10 11. 12 13 14. 15 16 17. 18 19 20 21 22 23 24 25 26 27 28 29 30. 4.5 2.5 1.5 -0.2 1.8 2.0 0.5 1.9 3.0 0.2 1.5 -0.1 2.1 3.3 0.5 3.6 -0.2 2.8 3.0 0.1 3.8 1.5 0.5 2.8 2.5 0.4 0.6 1.4 1.4 0.5. Seuree: Individual Perennel Files, Persenne1 Department, lCA.. 39.5 34.4 8.0 -0.1 20.0 20.8 6.7 24.1 33.9 1.5 8.9 1.2 2.8 41.7 6.7 39.5 2.2 35.9 26.3 1.4 3.0 8.4 6.4 35.9 34.7 4.6 5.7 13.7 15.1 6.7.
(46) 41. Designing a New Conditions of Service Scheme There is an urgent need to introduce new grade and salary structures for professional personnel employed by lCA. While it is recognized that there are likely to be serious political. legal and economic constraints that will have to be surmounted. with s~fficient managerial commitment, it should be feasible to imp1ement gra,~lly over a 5-10 year period the propased changes. It must"'be'emphasfzEflf"that what is being proposed is not new and revolutionary but will merely bring lCA's system of career advancement into line with the prevailing systems in the large majority of agricu1turalresearch organizations in both deve10ped and developing countries. The first prerequisite ia to establiah a hierarchy of c1early demarcated professional employment positions. Each position would have a designated tit1e which wou1d convey unambiguously the incumbents seniority in the hierarchy. A similar system existed in lCA during the 1960s when the professional cadre was fairly homogeneous. being compased mainly of researchers. With the subsequent inclusion of extension and service professiona1s, it was felt that the professiona1 cad re had become too heterogeneous to have a system of position titles and therefore the present numerica1 grade scale was introduced. However. there ia no reason why lCA cannot, on the basis of the present institutional model, have parallel hierarchies of employment positions for the two or three main types of professional personnel which could be linked to a common grade and salary structure. The great advantage of such a syatem is that is provides the basis for an effective system of career advancement which satisfies both the needs of the individual emplOyee and the organization. Progression up the career hierarchy would be from one employment position to another. These promotions would provide the professional with a strong sense of advancement which is at present lacking. Promotion to a higher employment position would be dependent on the fulfillment of certain minimum condítions l.e. years of servíce and/or experience and acquisition of certain types of training and qualifications but. equally important. the candidate would be subject to the comprehensive evaluation procedures discussed earlier. The ability to design the characteristics of each position in the career hierarchy in this way allows an organization much greater scope and flexibility in creating an effective career structure in contrast to the rigidity and inefficiency of an across-the-board points system. It is recommended that a two track career structure is adopted for professional personnel. Ihe basic features of such a structure are shown in Diagram 15. Ihe accelerated career track positions are intended for the most able professionals who should comprise probably no more than 30-35% of the full professional cadre. The main career track is designed for the majority of professional peraonne1. Although the rate of growth of salaries among main track professionals should be markedly lower than their colleagues on the acce1erated track. nonetheless it should be sufficiently high as to offer an attractive career progression. There should a160 be a weU structured period of "professioinal apprenticeship" which. for researchers. would include at least two-three years of on-the-job training with expert supervlslon followed by specialized formal postgraduate training normally to the masters level..
(47) .r. ,'" ,":,,~--=-.f"'»'". 42 Tba íirst year oí the apprenticeship sould be regarded as strictly probationary. Ooly those who will be able to complete postgraduate training programs should be retained. As stated earlier, major career advancernents should be based on periodic, performance based evaluations. lt is clear from the analysis of the technical prerniurn points scheme that there ia a high correlation between performance and qualification. Ihis highlights the need to ensure that all researchers have at least masters level postgraduate training as a prereguisite for entry into the full professional cadre. Similarly, accelerated track researchers should normally have undertaken doctoral level:-training. However, given that the advancement system should be predominantly based on performance criteria, there should no longer be the simple direct association between qualifications and grade and salary which curretly prevails. Instead, as indicated aboye, the incentive to obtain postgraduate training should be incorporated directly into the position hierarchy by stipulating that these qualifications will be required for major promotions in the early stages of the career of a researcher. An attractive one-off financial payment can be incorporated into the salary structure ior obtaining postgraduate training but, thereafter, there should be no automatic, preferential rewards for possession of these qualifications. Successful promotion frorn one employrnent position to another should result in a sizeable percentage increase in income. Within each position there should exist much smaller annual salary increments which would normally be awarded as long as individual performance has been satisfactory. This irnplies that the present technical premium scheme would be gradually phased out since, under the new scheme, evaluation would be concentrated at promotion points. Finally, the new grade and salary structure should be specifically designed to create 'S' shaped income-experience profiles. As was argued earlier, these profiles have been shown to correspond to the underlying changes in the productiveness of researc~ers during their careers.. Improvinq Professional Income Levels An irnportant conclusion to emerge from the foregoing discussion is that, given the prevailing conditions, it will be difficult for lCA to present a strong case for large, across-the-board inereases in the incomes of all professional personnel employed by the organization. The essential precondition for achievinq this will hinge on the ability to demonstrate effectively the outstanding contribution which is being made by lCA profassionals. However, this is a task which will require probably five years of sustained activity. In the meantime, therefore, ~he proposed "scientific bonus" ('bono eientiEieo') represents the most lmportant opportunity to improve the income levels of researchers.. Tha scientific bonus, whieh amounts to US$ 4.7 million over a 4-5 year period, is an integral part of lCA's current loan arranqement with the wo:ld Bank. As such, it has be en approved by the Government of Colombla and sh~uld.t~erefore be implemented as soon as possible. Althouqh th~ SClentlflc bonus is, in all probability, a one-off ad hoc rneas~re (WhlCh should not therefore, be formally incorporated into the gradlng and reward structures of researchers), it could provide an.
(48) 43. exceIIent opportunity to impIement on a trial basis some of the proposals concerning the evaIuation, grading and remuneration of professional personnel which have been proposed in this reporto It is recommended therefore that the scientific bonus should be administered according to the following principIes:. *. It should be awarded only for exceptional technical and/or managerial performance. Therefore. the total amount allotted for the scientific bonus should be regarded as the maximum potentially available with payments being made strictly on the basis of demonstrated performance. This implies that the scientific bonus should not be paid auto~ically on the basis of an individual's level of --qualifications (e.g. postgraduate) or some other non-performance indicator. It may be appropriate therefore to change the name of the scherne from "scientific bonus" to aterro such as "outstanding scientific performance premium". .. *. The evaluation process should be undertaken periodically. In practice, a meaningful evaluation of exceptional performance can probably only be made once every two-three years so it would be desirable if the scheme could be extended to cover a period oí at least five-six years so that each researcher has the opportunity to benfit from at least two evaluations. Clear performance criteria will need to be established with probably four-five distinct levels of monetary reward in order to ensure an appropriate incentive structure and generate a healthy level of competition among the professional community. Payrnent of the award should be spread out evenly during the intervening period befo re the next scheduled evaluation.. *. Individual researchers or teama of researchers will be required to demonstrate in a comprehensive and systematic manner the impact of their technology on agricultura1 production. Submissions will be reviewed by specially convened evaluation committees in each of the major disciplinary areas e.g. genetics. soil science, general agonomy, plant protection, social science etc. There should be at 1east one "externa1" member of the committee who has a record of outstanding research in the disciplinary area. Serious consideration should be given to using lBRO project resources to finance the costs oí using these external evaluators.. •. In order to meet understandable concerns about the payment of such an award 901e1y to research professionals and, in recognition of the integral part played by extension professionals in both the technology generation and dissemination process, the scheme should be broadened in scope to include non-research professionals who have performed exceptionally well in facilitating the adoption of high-impact lCA technology..
(49)
Figure

+7


Documento similar