Academic performance of public university students in Argentina
36
0
0
Texto completo
(2)
(3) WELL-BEING AND SOCIAL POLICY VOL 3, NUM. 2, pp. 67-100. ACADEMIC PERFORMANCE OF PUBLIC UNIVERSITY STUDENTS IN ARGENTINA Luciano Di Gresia National University of La Plata [email protected]. Maria-Victoria Fazio Internatioanl Monetary Fund [email protected]. Alberto Porto National University of La Plata [email protected]. Laura Ripani Inter-American Development Bank [email protected]. Walter Sosa Escudero University of San Andres [email protected]. Abstract esigning educational policies under limited budgets requires a thorough analysis of the D impact of alternative factors on student performance. This work aims at providing an analysis of the relationship between university performance and its explanatory factors. The analysis Will focus on the Argentinean case, using the 1994 Census of Students in National Universities, which includes data on all students enrolled in public universities in Argentina. The theoretical framework chosen for the empirical analysis is based on a production function, where education is seen as a process through which a set of inputs (student skills and characteristics and environment) is transformed into an educational product valued by individuals and society. Methodological limitations are mainly associated with the heterogeneity in the data. Different strategies are used to focusing on small groups and leading to accuracy in the results. It is important to underline that this paper makes a number of contributions, both thematically and methodologically. As previously mentioned, this study contributes to the discussion on the factors that impact educational performance in university students in Argentina, a relevant issue in public policy decision making. Possibly one of the most significant contributions of this study is to establish a clear methodological foundation that can be used as a starting point for more sophisticated studies and reproduced in different countries or periods. --Key words: Academic performance, quantile regression, higher education, university, Argentina, Latin America, students. Classification JEL: 100, 120,121, 122, 123, 128.. 67.
(4) ACADEMIC PERFORMANCE OF PUBLIC UNIVERSITY STUDENTS IN ARGENTINA. Introduction esigning educational policies under limited budgets requires a thorough analysis of the impact of alternative factors on student performance. This paper presents several qualitative and quantitative outcomes, thus providing important information for decision making. Three stages in the student/university relationship are relevant to the design of university policies. The first, which is one of the most highly debated topics in universities, is the admission or the entry mechanisms. The second stage concems the life of university students. Some of the issues that arise in this stage are how to measure student performance and to find its determinants. The third stage is the end of the student's university life, either because they dropped out or because they graduated. This paper addresses the second stage, that is, the transition from admission to graduation (or desertion). The empirical analysis is based on the 1994 Census of Students in National Universities, which includes data on all students enrolled in public universities in Argentina. The theoretical framework chosen for the empirical analysis focuses on production, where education is seen as a process through which a set of inputs (student skills and characteristics and environment) is transformed into an educational product valued by individuals and society. It is important to underline that the framework for the analysis was chosen for purely methodological reasons without establishing priorities with respect to other options and/or complementary approaches. A significant problem in studying the determinants of student performance is selecting an appropriate unit of analysis. As in most empirical problems, this selection is subject to trade-offs between accuracy and relevance. Considering a universe of students including every bachelor's degree discipline in every region and university significantly increases the number of available observations but poses a risk of adding aspects which, due to their nature, are not deemed convenient. On the contrary, focusing on small groups, (for example, analyzing bachelor's degree programs in one particular school), might imply ignoring common elements that would provide increased accuracy. This is a complex topic that needs to be analyzed in detall. It is important to underline that this paper makes a number of contributions, both thematically and methodologically. As previously mentioned, this study contributes to the discussion on factors that impact educational performance of university students in Argentina, a relevant issue in public policy decision making. Methodological contributions, certainly, are not less important. Perhaps one of the most significant contributions of this study is to establish a clear methodological foundation that can be used as a starting point for more sophisticated studies and reproduced in different countries or periods. A comprehensive and virtually unexplored data base is used in this paper. Homogenizing, classifying and accurately defining a comprehensive set ofrelevant variables is in itself a significant step. In addition, this study provides a detailed description of the different technical difficulties inherent in the analysis, which can be used as a guide in future studies. The paper is organized as follows. Section 1 explores the production function approach, which is the methodological framework used in the rest of this paper. It includes a brief review of the existing literature, the main methodological limitations and several relevant issues that can be analyzed with this approach. Section 2 provides a detailed description of the characteristics of public universities in Argentina and their students. Section 3 describes how the data utilized suits for the empirical test of the model of education as a production function. Sections 4 and 5 present. D. 68.
(5) WELL-BEING ANO SOCIAL POLICY VOL 3, NUM. 2, pp. 67-100. the estimates and results for several relevant econometric models. Section 4 studies the impact of individual and family factors and factors related to the bachelor's degree discipline and the university, on the university student performance, using ordinary least squares. This section complements the general analysis with a disaggregated analysis by university. Section 5 measures the effects of observable individual characteristics on the conditional distribution of performance, using quantile regressions instead of traditional simple regression methods. Section 6 presents several conclusions and areas for future research. Additionally, a series of Appendices provide more detailed information on data used.. 1. Academic Performance and Productivity: the Economic Approach Most empirical literature on the determinants of the educational achievement of students uses the education production function to analyze the effects of different types of factors on the measure used as product. The mode) is based on the microeconomic theory of firm in order to explain the "product" as a function of the "inputs" used in the education process. The studies by Hanushek (1986 and 1993) are general and comprehensive references of this approach, while a critical approach can be found in Pritchett and Filmer (1997). One of the first and most controversia) studies on education production functions in the United States is the Coleman report (1966), which concluded that schools do not have a significant effect on student achievement and that families and peer groups are the main determinants of differences in academic performance. In applying the education production function approach, a first issue is to select one explanatory variable from the set of multiple products that the education process generates. Among the alternative options used to measure the academie achievement, there are indicators such as the present value of future income; the choice of a certain way of life (for example, marital status, children, etc.); the academie achievement (duration of the bachelor's degree program, years of education, number of passed courses per year, academie average, the results of standardized tests on language and mathematics, among others); and the students' exerted effort. For example, Card and Krueger (1992) use the present value of future income as the dependent variable; Betts and Morell (1999) study the determinants of performance as measured by academic average; Natriello and Mc Dill (1986) analyze children's efforts in terms of hours of study. A second step in these studies is to identify the explanatory factors related to the selected measure of achievement. In this stage, the main complexity lies in the fact that is difficult to measure the factors inherent to the key actors in the education process, such as student motivation, their innate skills, or teacher quality. These restrictions show in most empirical studies as a large percentage of unexplained changes in the dependent variable that is being analyzed. The set of explanatory variables of the academie performance that is available in the literature can be classified into four main categories: (i) variables related to the student's family environment; (ii) individual variables; (iii) variables related to school and equipment resources and institutional factors; and (iv) regional variables. With respect to the econometric methods, Ordinary Least Squares (OLS) has been one of the most widely used approaches in the literature to estimate education production functions. However, the specifications of the models estimated by OLS have left a high percentage of academic. 69.
(6) ACADEMIC PERFORMANCE OF PUBLIC UNIVERSITY STUDENTS IN ARGENTINA. performance variability unexplained.' Therefore, subsequent studies have applied alternative methods in order to address the explanatory power of the models. Several theoretically and practically relevant empirical questions have been analyzed from the perspective of education production functions. In general, all models used in these studies include variables for the four groups (individual, family, institutional and regional) and assess the impact of specific factors. For instance, the evidence found refers to specific issues such as class size effect and peer group effect. We also find evidence of efficiency frontier estimates in the education process and the relationship between student effort and academic performance. Several studies for Argentina address issues related to the academic performance of students. Delfino (1989) reviews the determinants of learning using the education production function by applying the methodology using a sample of schools in Cordoba for 1983. The dependent variables in this case are the results of a multiple choice test in Mathematics, Language and Social Science. The main results of these estimates are that private school students get higher grades, the same as in urban compared to rural schools. The gender variable is found to have no significant impact, age has a negative impact and the region's economic status has a positive impact on performance. School size has a positive impact (perhaps due to available school materials, exchange of teaching experiences and organizational advantages), while class size has a negative influence. Another interesting result is that new teachers succeed in making students perform better. Piffano (1972), based on the 1968 census of 2,100 students in the Faculty of Economic Science of the National University of La Plata, supports the introduction of a student salary (scholarship) due to its positive impact on student productivity (measured as the number of passed courses per year). Porto and Di Gresia (2001), based on a sample of 2,500 students in this same Faculty in 1999, finds that girls, younger students and students whose parents have higher education perform better (number of courses per year and average). The secondary school and student's place of origin do not a have significant influence. Academic performance decreases with number of hours worked although the effect is small. And it increases as students approach graduation. Finally, Giovagnoli (2002), based on a panel of students seeking a bachelor 's degree in Public Accounting in the Faculty of Economic Science of the National University of Rosariocohort of students admitted in 1991, followed until the year 2001—studies the explanatory factors associated with the likelihood of graduating or deserting. Parents' education and occupation, type of secondary school, employment status and demographic and personal characteristics (place of residence, marital status, sex, and age) are some of the statistically significant explanatory factors. Specifically, this study finds that a student whose father did not finish primary is 70% less likely to graduate than a student whose father has a university degree; the risk of dropout is 27% lower for students whose parents are directors or bosses, compared to those whose parents are blue collar workers or employees; also the dropout risk is 1.36 times higher for boys than for girls.. ' Some issues to be taken into account when using OLS are: (i) potential endogeneity problems, where some explanatory variables are simultaneously determined with the variable we are trying to explain; (ii) non observable heterogeneity problems that cast doubt on estimates based on conditional means as a summary of the conditional distribution of academic achievement; (iii) issues regarding the aggregation of heterogeneous populations, which make it difficult to capture the effect of certain variables that may potentially impact education outcomes; and (iv) issues associated to selection bias, as estimate results may be influenced by the non-random distribution of students among faculties.. 70.
(7) WELL-BEING AND SOCIAL POLICY VOL 3, NUM. 2, pp. 67-100. 2. Characteristics of Public Uníversities and their Students This work focuses on an analytical review of the relationship between university performance and its explanatory factors, within the context of the production approach discussed in the previous section. As implied in that section, identifying a set of factors that encompasses the entire spectrum of potential determinants of the education process is a complex task. Since the analysis will focus on the Argentinean case, it is important to describe certain specific aspects of the Argentine university system in order to accurately understand the extent to which the results can be extrapolated in terms of the general problem. The next section presents this descriptive analysis. The education production function approach requires using data where both performance and determinants can be observed and this information is not easily available through time. The analysis will focus on the 1994 Census of Students in National Universities that was developed by the Secretariat of University Policies (SPU) Census of Students in National Universities. Its main objective was to collect and compile updated and reliable information on the number and distribution of undergraduate students, type of bachelor's degree and their academie progress =de,' and their social and demographic characteristics. Even though certain universities have made regular surveys, this was the first nationwide effort (and the only one to date). The appendix 2 provides further details on the Survey. According to the 1998 Yearbook of University Statistics, there are 36 public universities in Argentina? Public universities are not a homogeneous group; on the contrary, there have significant differences in several aspects. The 1994 student Census did not include all 36 public universities included in the 1998 Yearbook because some of these universities had not begun operations when the Census was made. Thus, from now on, the universe of public universities will include 31 universities. This group of 31 universities includes 319 faculties offering bachelor's degrees in 1,357 disciplines. With respect to size, the National University of Buenos Aires, with 226,000 students, is the largest, followed by the universities of Cordoba, La Plata, Rosario and Technologic; these five universities concentrate 57.5% of the students. On the other end of the scale we find the University of San Martin, with only 234 students suryeyed. Other eight universities have less than five thousand students. The characteristics of the productive process also differ significantly between universities. One of the measures is the equivalent teacher/student ratio,4 which ranges from 94 equivalent teachers for every one thousand students (San Juan) to 21 (Lomas de Zamora). The expenditure measured in thousands of pesos per student per year, which can be an indicator of quality, inefficiency and/or economies or diseconomies of scale, váries significantly, not only between the most recent and the most traditional universities. Other characteristics, such as years of service of the teaching staff, number of categorized teachers and researchers and the level they. The objective of undergraduate studies is to acquire thorough knowledge of one or more disciplines, their principies, theories, laws and methods. It Ieads to eaming a bachelor's degree, a teaching degree or its equivalent. 3 1998 Yearbook of University Statistics, Ministry of Education, Secretariat of Higher Education, 2000. Equivalent teacher is a measure used to group the different weighted teacher categories. Conversions are made applying the following coefficients: full time teachers (40 hours a week) = I, part time teachers (20 hours a week) = 0.5, teachers who work 9 hours a week = 0.25.. 71.
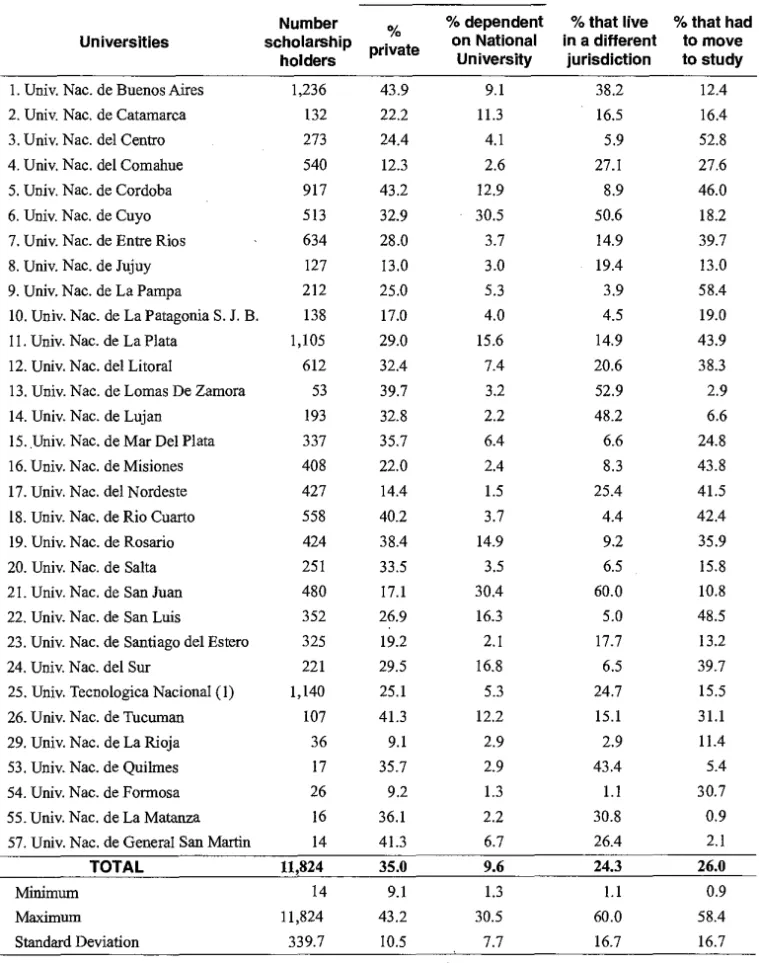
(8) ACADEMIC PERFORMANCE OF PUBLIC UNIVERSITY STUDENTS IN ARGENTINA. achieved in the framework of the Regime of incentives or for teachers/researchers, provide interesting information.' Table 1 shows the main characteristics of the student and of their socioeconomic environment. The following sections will focus on certain particular student characteristics as well as on certain universities (for the analysis using quantile regressions). Keeping this in mirad, we can highlight the following information: the average age of the students is 24, similar to the average age in the University of Buenos Aires and the University of Cordoba, the two largest universities in the country. As expected, there are significant differences in parents' education between universities. While the highest averages (12 years of education for both parents in both universities) are observed for Buenos Aires and Cordoba (the two universities analyzed later in the analysis using quantile regression), the lowest are observed in universities located far from the country's capital, such as Formosa (8 years of education on average for both parents). As for the percentage of students who work, the University of Buenos Aires differs from Cordoba, with a high percentage of working students (67%). With respect to working hours, the average number of hours worked is 31, leading us to conjecture that students work part time to finance their university studies. Another interesting fact is that 43% of students who work do so in activities related to their field of study. Regarding secondary schools, 35% of students come from private institutions, and there is high dispersion among universities. For universities studied in section 5, in the University of Buenos Aires and the University of Cordoba around 43% of students come from private secondary schools. The number of passed courses per year is 2.5 on average, with a minimum in La Rioja (1.5 courses per year) anda maximum in Quihnes (3.6 courses per year). As for hours of study time (number of hours per week), the universities studied in section 5 (Buenos Aires and Cordoba) show similar values to the national average (an average of 29 hours per week), while for Buenos Aires, the average is 26 hours and 29 hours for Cordoba. As we can see in Table 1, there are additional variables that might be of interest to the reader, such as students' sources of finance, students' migratory characteristics, average permanence (years elapsed since admission), and number of passed courses per year, among other.. 3. Measuring Academic Performance and its Determinants Measuring students' performance at any educational level has been the concem of researchers in different disciplines. In all cases, it is a complex task. In general, it is considered that the results of knowledge tests or grade point averages in passed courses can be a first indicator. If the test scores of two otherwise similar students are different, this difference might be indicating that the student with the higher score incorporated more human capital. It is assumed that the higher the grade, the greater the amount of human capital incorporated and the higher the expected future. This Regime allows teachers and researchers to receive a salary increase for the projects approved and assessed by internal and externa! evaluations. Initially the categories were established from A (max) to D; then it was modified from I (max) to V.. 72.
(9) WELL-BEING AND SOCIAL POLICY VOL 3, NUM. 2, pp. 67-100. income.6 It can also be assumed that in the case of education as a consumable good, higher scores may provide higher indirect utility. One of the potential problems in this type of measurement is that the different courses in a bachelor 's degree program and/or in different bachelor 's degree programs and/or in different universities may use different test grading methods. This would contaminate performance measurements.7 However imperfect this measurement might be, it is commonly used and can be considered an initial approximation.s Other measures can also be significant, either by complementing or substituting the average. A simple measure is considering that the "product" of the education process is the number of passed courses per year. This is the student's mean productivity indicator, where the total product is equal to the number of passed courses and the input is the number of years elapsed since student's admission into the Faculty. The student with the largest number of passed courses per year is more productive or performs better. The notion is that the student incorporates human capital in less time and this will allow him to obtain higher income more rapidly. The total cost to society is lower because the student remains in the Faculty for a shorter period of time. The risk of the acquired knowledge becoming obsolete is also lower. This physical measure can be complemented with the previous one to obtain a value of the student's mean productivity. It can be assumed that if the mean productivity of two students is equal, the one with the highest average will perform better. Thus, productivity or performance indicators are: Perfl = average = total score in all passed courses including failed courses / number of passed courses Perf2 = mean productivity = number of passed courses since admission / years since admission Perf3 = Perf 1 * Perf 2 = value of mean productivity All of these student performance measures consider only their performance in the Faculty. For students who work, performance measures of this type might not be adequate since in addition to knowledge acquired at the Faculty, they would have also acquired certain economically valuable skills and work experience. There is another approach to defining student performance (Card and Krueger, 1996), where measures based on students' higher future income due to the incorporation. 6 There is evidence, both national and international, of the positive effects of education on the future income of individuals. "Education is an investment that creates economic values by increasing student's skills and future earning power. Impressive ernpirical evidence supports this point" (Flyer and Rosen, 1996). Empirical evidence on the relationship between different assessment test results or score averages and future income is not so clear. This suggests that averages do not represent a good measurement of economically valuable knowledge acquired (Card and Krueger, 1996). However, several studies have found a positive and significant relationship between averaged (and related measurements) and future income (Betts and Morell, 1999). McGuckin and Winkler (1979), in a study applied to the United States, consider that averages (GPA o Grade Point Average) are not a good measurement due to variations in grading methods among Departments. To obtain a more objective measure of education quality this study believes that, ideally, we should consider GRE (Graduate Record Examination) scores, a test where students are assessed by a single entity (ETS or Educational Testing Services, Princeton, USA). In addition, since the following analysis will be based on simple regressions, it is valid to underline that measurement errors in the explained variable only affect estimate accuracy, unlike measurement errors in explanatory variables, which affect unbiased estimates.. 73.
(10) ACADEMIC PERFORMANCE OF PUBLIC UNIVERSITY STUDENTS IN ARGENTINA. of human capital at the Faculty, among other factors, are most important. The main advantage of this measure is that it is based on the market value of knowledge acquired. A disadvantage is that the consumption component of education has no monetary expression. Even if the monetary measurement were adequate, there is still the issue of determining when to start computing retums to education since the life cycle is not clearly divided between leaming years and working years and available empirical results are very sensitive to date selection (Light, 1998). In this paper, dueto data availability limitations, only the Perf2 measurement will be used. In addition to the reasons previously discussed, the significante or Perf2 arises from the fact that Argentinean legislation establishes that university students must meet certain minimum requirements to be considered regular students. 9 Moreover, the performance measures are also associated to the admission of students and the financing mechanisms of their education. A widely accepted goal of education policy is that students should have access to universities based on merits, regardless of personal or family monetary income. But this objective may be threatened if public financing for universities decreases. One of the proposais to address this dilemma is implementing direct student aid (scholarships) programs allocated based on student performance. Once again, the measurement of performance and its determinante appears relevant and of interest to university policy. For example, the requirements to apply for a scholarship in the General Scholarship Regulation of the Nation's Ministry of Education include passing the minimum number of courses required by the Higher Education Law to be considered a regular student (Perf2) and at least a seven points (out of 10) average grade (Perfl), including failed courses. The second step is identifying the explanatory factors of student's academie performance, in either of the aboye mentioned measures or other possible ones. At this point, it is important to establish a critical distinction to interpret the results. On one hand, an "explanatory factor" is to be understood as any variable that varies simultaneously with performance, for example, the hours allocated to study, whether the student works or not, parents' education, etc. On the other hand, the "causal factors" that determine performance are the variables that are exogenous to the academie performance and that could cause it are more difficult to identify. Even though in certain cases it is relatively easy to identify the effect of there exogenous variables (for example, sex or nationality), it becomes more complicated to do so when one variable is jointly determined with the academie performance, such as, for example, hours of study. Although an exogenous increase in hours of study time should translate finto improved performance, observational data (not obtained through a controlled experiment) might reflect the opposite causality: poor academic performance leads to more hours of study. In this study, the explanatory variables refer to the concept of "explanatory factors", in that sense regression results should be seen as a descriptive tool to calculate partial correlations rather than as a strategy to measure the causal effect on education, which would require a more detailed specification as well as a more restrictive analysis of the available sample.. "Each institution shall set standards establishing the minimum academie performance required, contemplating that students should pass at least two courses per year, except for the cases in which the study plan includes leas than four subjects per year; in this case, they should pass at least one course. In universities with more than fifty thousand students, students' admission, permanente and promotion shall be defined by each faculty or equivalent academie unit." (Art. 50 of law 24521/95). The universities that have over 50,000 students are the following: National University of Buenos Aires, National University of La Plata, National University of Córdoba, National University of Rosario and National Technologic University.. 9. 74.
(11) WELL-BEING AND SOCIAL POLICY VOL 3, NUM. 2, pp. 67-100. The following five sets of explanatory variables are included in the academic performance function: 1.The first set includes the university attended by the student and his bachelor's degree discipline. The university per se can influence performance for several reasons. The "University environment", the size and the geographic location and the learning techniques are factors that vary among universities. Besides, the student's motivation could be different among different programs, depending on the characteristics of the labor markets associated to each field. The labor market might weigh different attributes of the students according to their field of study. For example, in a more theoretical field oriented towards academic work, Grade Point Averages and program duration could be valued more highly than in fields where working experience as a student is viewed positively. In addition, the degree of difficulty might not be the same in every program. In this study, due to the fact that surveyed students are enrolled in 899 different programs, they have been grouped according to similarities in fields and disciplines. For example, if the student is studying Law, the Field is Social Science and the Discipline is Law, Political Science and Diplomatic Science.'° 2. A second group includes the variables that represent the individual characteristics of the student and family. This group includes, among other factors: sex, nationality, marital status, parents' education, living conditions, employment status (whether the student works or not) and the income sources of the student income sources (from work, family contributions, scholarship and a combination of these sources). Parents' education is generally considered an important factor in explaining student performance. The notion is that the higher the educational attainment of the parents, the greater the amount of time devoted to helping the student, and, in addition, the better the quality of supervision of the student." With respect to the choice of city to live in, we consider, on one hand, whether the student had to move away from his hometown to attend college. This variable can have diverse effects on performance. Moving can generate a feeling ofuprooting and of homesickness and have a negative impact. Or it can generate more free time and allow them to integrate faster to the "university environment", with a positive impact. On the other hand, students who have to commute between distant jurisdictions to attend the Faculty are in a different situation. The students who travel from one jurisdiction to another have transportation costs, and more importantly for their performance, the. See Appendix 3 for details on Fields and Disciplines. An interaction variable is built between the variable Field and the variable Discipline. Owing to technology related issues (the statistics program did not accept such a large number of explanatory variables), it has not been possible to include bachelor's degree disciplines as dichotomous variables in this version of the study. This next step represents our immediate objective in a future version of this papen " For example, Murnane, Maynard and Ohls (1981) argue that mother's education should have a positive impact on the education of her child since previous studies have found that the higher the mother's education, the greater the amount of time dedicated to her children's studies and the quality of support provided to the student. They also argue that mother's educational attainment is more strongly correlated to student performance than father's educational attainment.. 75.
(12) ACADEMIC PERFORMANCE OF PUBLIC UNIVERSITY STUDENTS IN ARGENTINA. opportunity cost of the time traveling and the effort. The academie performance of this group of students is thus expected to be poorer. 3. A third group includes the type of secondary school attended by the student. Due to limitations in data availability, we only differentiate between private and public secondary schools.12 4.A fourth group comprises two variables included in the performance production function. On one hand, the variable "years elapsed since admission", which is considered to be an input of the productive process; on the other hand, "the year attended by the student", which represents the temporary stage in the student's production process.13 5 Finally, we include the number of hours allocated to studying as a variable that represents the effort and the motivation of the student. 4. Econometric Study of the Determinants of Academic Performance One of the key characteristics of this research is the large number of the data that utilizes, approximately 409,000 individual observations," which has certain obvious advantages regarding the number of degrees of freedom, as well as certain disadvantages associated to the heterogeneity of the referred population. More specifically, an increase in the number of observations translates into an increase in available data as long as these observations relate to the referred population and do not introduce new heterogeneity. The sample includes students from different programs, universities, regions, cohorts, etc. As in any statistical problem, this implies a trade-off between bias and accuracy. Aggregating heterogeneous unit data implies considerably reducing degrees of freedom but poses the risk of deceitfully simplifying the problem by producing estimates that are not representative of any referred population (for example, estimating a mean when there are actually two or more). On the contrary, making estimates for each potential heterogeneity aspect allows us to avoid these simplifications without exploiting any of the potential advantages of grouping. Faced with this dilemma, this paper presents aggregate information and information by university.'5 Some stratification options that could allow us to take full advantage of available data will be discus sed later.. For example, Willms (1985) estimates that the effect of having attended private secondary school vs. public secondary school on student performance in universities is positive. ° Even though it would have been preferable to include both variables, this paper will only include the variable years elapsed since admission because the variable representing the year that the student is attending is unavailable in the 1994 Census questionnaire " The different number of observations between the different estimates and in the number of total students surveyed is due to the incomplete responses in the Censusforms. Formally, available data can be seen as a hierarchic or embedded structure (individuals in a certain degree program, in a certain faculty, in a certain university, etc.). See Antweiler (2001) or Baltagi et. al. (2001) for statistical models for these structures; they could represent an interesting estimation strategy for future research.. 76.
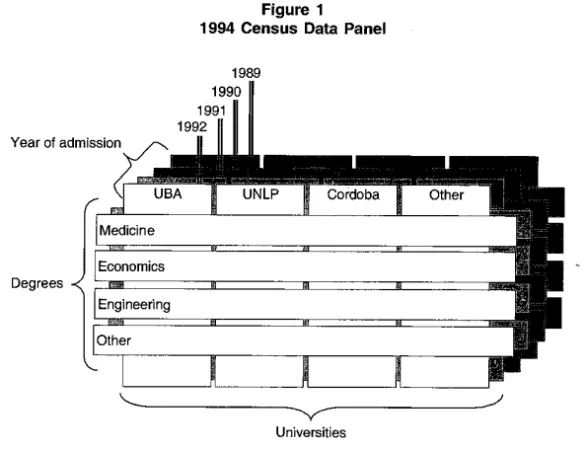
(13) WELL-BEING AND SOCIAL POLICY VOL 3, NUM. 2, pp. 67-100. 4.1. Aggregating units of analysis and academic performance The available data set is structured as a panel with the following dimensions: (i) universities, (ii) the different bachelor 's degrees disciplines and (iii) the year the student was admitted to the university, which identifies his cohort. Figure 1 presents a diagram of this panel: Figure 1 1994 Census Data Panel 1989 1990 1991 1992 Year of admission. "/-11.‘BA. Universities. In addition, we have individual information for each student regarding sex, marital status, employment status, academie performance (e.g. number of passed courses), housing, etc. Adl this information makes up a data base that includes around 615 thousand entries, of which about 409 thousand entries from complete forms were used to analyze the factors that influence student performance. The variables described in the previous section will help us identify the factors influencing academie performance. Thus, we present the following simplified model:. R1 = f(X,,, X 2i ,..., XK „U i ) Where • i is an index that identifies each student. • R. is a measurement of the academie performance of student i. • X X2e represent K observable factors influencing the academie performance of student i. • u are non observable factors.. 77.
(14) ACADEMIC PERFORMANCE OF PUBLIC UNIVERSITY STUDENTS IN ARGENTINA. A first approach to address the issue would be to observe the results of a regression model that tries to establish relationships among variables using all available data. In terms of a scheme, it is comparable to the situation in Figure 2, which represents the relationship between two variables (Rin terms of X). Figure 2 A Model for AH the Observations R. f (X, all). o o 9-o O. 0 oo. o. °. O. 0. o o o o. o. o. We used all the observations based on the assumption that they all correspond to the same underlying model. Nevertheless, if we assumed that there are different models for different data sub-sets, then the situation (using the same data) would be similar to the one in Figure 3.. Figure 3 Disaggregation of Observations in Three Models. RA. o f (X, A). O. f (X, C) o. f (X, B). X. 78.
(15) WELL-BEING AND SOCIAL POLICY VOL 3, NUM. 2, pp. 67-100. In this case, it is assumed that there are three models that explain the relationship 12-1(A9 in a different way. Observations can be divided into groups A, B and C, and each correspond to its respective model. Note that if the latter is correct, making a single estimate allows to have a larger number of observations available, but that generate unsatisfactory results since they are not related to a particular model.' The paradox in this case is that when they are not associated to a specific model, more available observations do not result in more available data. "Appropriate" information segmentation would result in more valid results to approximate the underlying models. In this sense, the problem lies in determining how to adequately segment the data, that is, how to disaggregate data to obtain data sub-sets associated to unique models. The objective of the following section will be to provide tips on how to disaggregate the available data to achieve better results. One possible way to address this problem could be using dummy variables. In this case, to take into consideration the differential characteristics between models, we would have to incorporate all the interaction effects. Di Gresia, L, Fazio, M., Porto, A., Ripani, L. and Sosa Escudero, W. (2005) presents estimates disaggregating the sample by bachelor's degree discipline and cohort. This disaggregation (by cohort and bachelor 's degree program) allows us to obtain better results in the model for academic performance determinants than when using all the aggregated data. The model leaves a large share of performance variability unexplained, but the explanatory power increases significantly. The next part of this section (4.2) presents the estimates for the group ofuniversities obtained from applying the method of OLS. Section 5 will present a quantile regression approach in the analysis of the subject.. 4.2. OLS Estimate Results The estimates were obtained using the following variables from the Census of National Universities (their name is shown in bold and in parenthesis). The dependent variable is the number of passed courses divided by the number of years elapsed since student's admission (perf). Factors influencing academic performance: the following variables were used: age (age); sex: 1 mate and O female (sex); nationality: O Argentinean and 1 not Argentinean (nat_narg); marital status: O not single and 1 single (single); secondary school: O public institution and 1 private institution (sec_pri); place of residence while studying: O same jurisdiction and 1 different jurisdiction (rws); changed place of residence to study: O did not move and 1 moved (ch_residen); years elapsed since student's admission (years); hours of study per week (study_h); father's educational attaintnent (f edue); mother's educational attainment (m_educ); and employment status: O does not work and 1 works (work). Initially, we make five estimates: (1) not including dummy variables for universities and bachelor's degree discipline, nor the variable years elapsed since student's admission (years); (2) including dummy variables for universities; (3) including dummy variables for universities; (4) including dummy variables for bachelor's degree discipline and years elapsed since admission and (5) including dummy variables for universities, bachelor's degree discipline and years elapsed since admission.. 16. Adding observations is useful when they are associated to the same empirical model.. 79.
(16) ACADEMIC PERFORMANCE OF PUBLIC UNIVERSITY STUDENTS IN ARGENTINA. The results are shown in Table 2. We can see that all the variables included are significant in at least one of the models (most, in all models). The inclusion of the variable years elapsed since admission (which identifies the cohort) is highly significant. Adding dummy variables to discriminate between universities increases the model's explanatory power (the adjusted R squared moves from 0.05 to 0.08). The same is true when discriminating among bachelor's degree disciplines (the adjusted R square moves from 0.05 to 0.08). The addition of the distinction between both bachelor's degree disciplines and universities results in an adjusted R squared value of 0.12. The results for- the set of surveyed universities taken as a whole reveal that girls perform better than boys. Also, that the Argentinean students perform better than foreign students. The Marital status is found as a statistically significant explanatory factor. Moreover, the type of secondary school is a statistically significant explanatory factor of academic performance: students from private schools complete 0.10 subjects more per year than those from public schools. If the student moves to go to college, moving has a positive effect on performance. On the contrary, having to travel between jurisdictions (for example, municipalities) to attend the Faculty has a negative impact. The number of years attending to college is negatively associated to the academic performance. Students who devote more hours to studying, including classes, are found to perform better. Performance improves as both parents' level of education increases. Moreover, the students who work perform better on average. This unexpected result could be attributable to different factors associated to the student's job (observable and unobservable) captured by the binary variable (works 1, does not work 0), which have a positive impact on performance. For example, in a model with the same Census data, Fazio (2004) finds that if the model includes also a dummy variable indicating if the job is associated to the student's discipline, then the sign of the coefficient of the binary variable (works 1, does not work, 0) is negative." As expected, the sources of finance are statistically significant variables: the top performers tend to be those students receiving scholarships and family contributions, followed by the ones who only receive scholarships, followed by the students who are financed with personal income from work and family contributions and, finally, family contributions. In each case, results are obtained by comparing the different financing sources with personal income from work. With respect to quality variables (indirectly) for each university, no statistically significant relationships with performance has been found. The R square in the regression is relatively low (0.12). Aprevious study (Di Gresia, L, Fazio, M., Porto, A., Ripani, L. and Sosa Escudero, W. (2005)), includes estimates with different disaggregation: by university, by bachelor's degree discipline and by cohort. Results from this disaggregation show that dividing the sample by university increases the explanatory power of the model. The same procedure was followed discriminating between observations by bachelor's degree discipline; in this case, the explanatory power of the regression varíes significantly among bachelor's degree programs. For example, programs that require admission tests present a more homogeneous population and this has a negative effect on the estimates. In the case of disaggregation by cohort, no clear systematic pattern is observed in the explanatory power of the model based on years elapsed since admission. The paper also finds that the relationship between the number of hours worked by students and performance can be positive only when the job involves working a limited number of hours (5 hours a day) and when the working tasks are related to the students' study program. On the other hand, when the working hours exceed the limit of 5 hours or when the job and the study program are not related, the relationship between the number of hours worked and performance is negative.. 80.
(17) WELL-BEING AND SOCIAL POLICY VOL 3, NUM. 2, pp. 67-100. The impact of the sources of finance on performance is particularly significant regarding the economic policies for university education, As previously mentioned, students who receive scholarships and family contributions are the best performers. In this sense, helping low income students so that they can have the same opportunities as their high income peers (in terms of economic support to study), is essential. In addition, the fact that improved student performance is associated to parents' level of education reflects high levels of intra-generational inequity, since there is a circie where the success of different generations is perpetuated through education and education outcomes (quality of education received measured by the academie performance).. 5. Heterogeneous Effects of the Observed Determinants of Academic Performance in Universities In social and humanistic sciences there has been considerable interest given to the issue of how individual characteristics affect students' performance. Quantifying how a certain factor, father's education for example, can affect a child's academie performance is critical in explaining differences in student achievement or, for example, in designing and assessing specific actions to encourage social mobility by promoting education. This requires accurate empirical models that associate the academic performance with its observable determinants. As documented, despite providing information on a number of different aspects of the education process the available models are still far from achieving this objective, mainly owing to the complexity of this issue. This is usually reflected in their particularly poor goodness of fit, which means that even after conditioning on a number of observable determinants of performance, there are still substantial differences among individuals due to the unobservable factors in the education process. As a result, the correct way to explain the effects of observable factors on student performance is by taking into consideration how changes in one specific factor could affect the conditional distribution of performance. For example, when we examine the impact of the education of the father on academie performance, the distribution of performance conditioned on observable factors, including parents' education, still shows great variability due to the non trivial role of unobservable factors. So even within a group of individuals with similar observed characteristics, there could be poor, average or top performers. It would be natural to expect that the whole conditional distribution of performance would shift to the right when, all else equal, students whose parents have a high education level are being considered. In extreme cases where father's additional education shifts the entire conditional distribution to the right in the same proportion, the effect of the father's higher education on mean performance would capture all we need to know. In this context, and based on certain simplifying assumptions, a standard regression model could provide the desired answer: in a linear regression, the coefficient of the father's education would capture the effect on expected performance and, under these particular circumstances, on performance in general. This would occur in cases where the education of the father is totally independent from the unobservable factors, thus, changes in father's education result in shifts in the conditional distribution of performance. But due to the non-trivial role of the unobservable factors, it would be convenient to consider cases where changes in father's education interact in some unobvious way with other factors not included in the model. As an extreme example, the education of the father could play an important role in the academic performance of children with a natural tendency to study, and have a moderate impact on children that are fess interested in studying. In any case, "the average effect". 81.
(18) ACADEMIC PERFORMANCE OF PUBLIC UNIVERSITY STUDENTS IN ARGENTINA. of the education of the father is positive, but does not represent the population in general: it overestimates the effect on children not prone to studying and underestimates the situation of motivated children. For an even more hypothetical example, we could consider the effects of age on academie performance. A group of older students might include more concentrated and mature individuals, mixed with fess motivated students, whose progress in the education process is slower. Unless you could control for unobservable factors, such as "concentration", "maturity" and "motivation", given the rest of the factors, academie performance for the group of older students could be rated average and be similar to the group of younger students, even if performance dispersion were higher among the former. In this case, the conclusion that, "in average", age has no effects, could lead to the obviously wrong conclusion that age has no effects on performance, which ignores the fact that it has effect on performance's dispersion. The main objective of this part of the paper is, in this sense, to measure the effects of observable individual characteristics on the entire conditional distribution of performance. The study is based on a sample of 10,000 students using the 1994 Census, where performance is measurable and many of its determinants can be observed. Using quantile regressions instead of the more traditional simple regression methodology (OLS) suggests that many commonly studied observable factors affect performance in heterogeneous ways, while the OLS approach roughly summarizes the coefficients in one specific coefficient for each factor. For example, and providing empirical results of this study in advance, more hours of study have a positive effect on academie performance, but the quantile regression methodology reveals that this result simply summarizes the fact that there effects range from monotonically small effects for high-performing students to strong effects for low-performers. Therefore, the "average" effect inadequately summarizes the actual heterogeneous effects of additional hours of study. The effect of age on performance is similar to the previous example: the average effect is null, even though age has a strong impact on academic performance dispersion. This part of the paper first provides additional details on the methodology used to capture the effects of the variables observed in the conditional distributions, instead of the means, and at the same time, it links this study to previous literature on this topic. Then it presents data used in the empirical part, followed by econometric results and, finally, it concludes. The most widely used approach to study the determinants of student performance is based on regressions of the following form: R=Áx,u) where R. is a measure of the academic performance of student i, x is a vector K of observable determinants of performance and u is a random variable representing unobservable determinants. Formulations such as this are consistent with the production function approach, where performance is seen as the product of using x and u as inputs in a "production" process from which learning outcomes are obtained. Under the usual assumption of linearity, R=x '13 +u, and if E(ux)=0, 13 can i=1,...,n of n be consistently estimated using Ordinary Least Squares based on a sample (y individuals. As usual, 13 measures the effect of adjusting the kth observable factor associated with expected performance.. 82.
(19) WELL-BEING AND SOCIAL POLICY VOL 3, NUM. 2, pp. 67-100. As mentioned in the previous paragraph, the role of unobservable factors is also important. For example, in most estimates, the R2 does not exceed 15% using samples of considerable size and a large set of observable factors, so 85% of the variability of academie performance relates to unobservable components. This implies that even after controlling for observables, there is still significant heterogeneity among individuals, and this raises doubts on how representative is the conditional probability as the summary of the conditional distribution of performance. In particular, we could question whether explanatory variables have homogeneous effects that can be captured by the effect on conditional probability. A natural way to adjust heterogeneous effects is provided by the linear quantile regression method developed by Koenker and Basset (1978).18 Q,(yx)=x'f3 where Q,(yx) refers to the tth quantile of the distribution of y conditioned on x. It is in terms of the fact that 13, may differ across the different quantiles of the conditional distribution that we will speak of the heterogeneous effects of x, compared to the homogeneous case of R = R. In this case, vector r3 can be consistently estimated using standard OLS and these simple regression coefficients adequately summarize the effect ofx on the conditional distribution of [3. In any other cases, p, will have to be estimated for different quantiles. Before we describe the statistical model used to estimate pi, we will consider some examples relevant to this case. When we estimate the effect of hours of study, the regression coefficient is 0.025, and the classical interpretation is that when other factors are held constant, one additional hour of study per week increases expected performance by 0.025. This result is representative for individuals with average unobserved characteristics. But in view of the possible unobservable heterogeneity, we need to wonder whether the estimated effect of more hours of study can be extrapolated to individuals with unobservable characteristics different from the average. The results of this paper show that far from being homogeneous, the effect increases in the conditional performance quantiles. This means that, after controlling for observable factors, low performers benefit more from one additional hour of study than the rest of the students, to the extent that increasing the number of hours of study has a very small effect on student performance for those on the top quantiles of the conditional distribution. Therefore, the positive effect on conditional probability is not an accurate measure of the fact that the effect is positive for everyone but also increases in the conditional distribution of performance. It is in this sense that the effects of one variable are heterogeneous across conditional quantiles. In contrast, the effects of mother's education are homogeneous across different quantiles so, in this case, the coefficients of the simple regression provide an accurate summary of the effect on the conditional distribution of performance.. 18. A simple and formal introduction to conditional quantiles can be found in Koenker and Hallock (2001).. 83.
(20) ACADEMIC PERFORMANCE OF PUBLIC UNIVERSITY STUDENTS IN ARGENTINA. As in previous sections, we use data from the 1994 Census. As a measure of academic performance we use, as before, the number of passed courses by students since they started studies at the university divided by the number of years elapsed since the student started his/her program. Explanatory factors are those used in the previous sections: sex (1 if male, O otherwise), age (in years), f.educ (father's education, in years), m.educ (mother's education in years), work (1 works, O does not work), h.study (hours of study per week), and sec.pri (1 if student attended private secondary school, o if public). The same issue of sample size discussed previously arises in this case. Choosing a specific sub-sample is based on the trade-off between the advantage of having a larger amount of information and the problems of dealing with heterogeneity. In particular, using several bachelor degree programs requires controlling for differences among Faculties19 that can affect academic performance. In this sense, the analysis focuses on the sample of Economic Sciences' students, which includes the disciplines ofAccountancy, Economics, Administration andActuarial techniques. This set covers a significant share of the total population. In addition, observed performance in Faculties shows wide variance, implying that the structure of the Bachelor's degree program leaves ample space for individual characteristics to actas determinants of performance. For example, due to both explicit and personal selection, most hard science students (such as mathematics or physics) study full time and faculties set strict academic progress requirements, implying that, at any given time, if measured as number of passed courses, most students have similar performances. In contrast, the Economics programs provide great freedom to students for accommodating their professional or personal interests, so the performance measure used is more highly correlated to individual characteristics. We use the cohort of students that were admitted to the university in 1990. These are 5-year bachelor's degree programs so, at the time of the survey, top performers in this cohort were in their fourth year. The more recent cohorts (those admitted after 1990) have fewer passed courses right after starting, so their performance measure is a less accurate indicator of their performance. Taken to the extreme, the 1994 cohort has just the first few courses passed, so the average of passed courses is a very poor predictor of general performance. In contrast, older cohorts are likely to be under-represented in the survey. For example, the cohort admitted to the university in 1988 excludes top performers who completed their studies in the expected five-year period. As a result, to balance accuracy and bias, the analysis will focus on the cohort admitted in 1990, whose performance measure is the average of a larger number of subjects and is well represented in the sample. Moreover, to avoid model differences among Faculties, we use the cases of the two largest universities in the sample: Buenos Aires and Cordoba. Table 4 presents joint results for the case of Buenos Aires and Cordoba." It presents estimates of the coefficients of performance using quantile regressions, for the conditional distribution quantiles from 0.1 to 0.9 in intervals of 0.1. Each column shows the estimates for each quantile. For. In other countries, Faculties are called Departments, units that group Bachelor degree programs thematically. The first comment refers to the fact that when these two universities were analyzed separately, we found noticeable similarities between Buenos Aires and Cordoba. Both qualitatively as well as quantitatively, they exhibit a series of similarities, using more accurate estimates in the case of Buenos Aires. Thus, we decided to combine the data on both universities and this is the only case that will be discussed.. 20. 84.
(21) WELL-BEING AND SOCIAL POLICY VOL 3, NUM. 2, pp. 67-100. comparison purposes, OLS estimators were included in the last column. Figure 4 presents a diagram of results. Each small figure presents the effects of an explanatory variable on the óth conditional distribution quantile. The solid line shows the effect for each quantile and the shadowed area represents a 90% confidence interval. The dotted horizontal line represents the OLS estimate. The solid horizontal line indicates zero. The homogeneity assumption is strongly rejected in several cases. The homogeneous case would be associated to quantile estimates represented by a constant horizontal line. This is not the case for many of the variables. The effect of hours of study time is particularly relevant. The "mean" OLS estimate implies that one additional hour of study increases performance by 0.025. In contrast, the quantile regression results show that this effect decreases sharply across the quantiles of the conditional distribution of performance. More specifically, for individuals in the lower quantile the effect is 0.032 and it monotonously decreases to one third (0.012) in the top quantile. Mean estimates are clearly not representative of the conditional performance; the effect of additional hours of study is stronger in the lower tail. Thus, as hours of study increase, the distribution of academic performance becomes more homogeneous. Another interesting case is the effect of age on performance. The OLS estimate is not significant, indicating that age does not modify expected performance. The results for the quantile regression suggest a significant effect that moves monotonically from negative to positive across quantiles. This is consistent with a strong scale effect on performance. As indicated at the beginning of this section, this means that the group of older students has a similar expected performance than the younger group, but with higher dispersion. Therefore, to conclude that age does not affect performance would undoubtedly be a mistake. Mother's education represents a contrasting example. The OLS estimate is positive and significant (0.042). Quantile regression estimates are also positive and significant, but they are also constant, with values close to the average effect. In this case, therefore, the effect on the average provides a representative summary of the effect of mother's education on the entire conditional distribution: it seems to cause a shift in the distribution of performance. The effect of having attended private secondary school follows an interesting pattern. It starts as significant and positive and monotonously decreases until it stops being significant in quantiles aboye 0.4. This suggests that previous private education is a relevant factor only for those students in the lower end of the distribution. Many issues have been left unanswered so far in this part of the study. Specifically, choosing a more accurate relevant sample, perhaps one that includes more bachelor 's degree programs and universities should be addressed in first place. In addition, improved specifications for the set of explanatory variables that incorporate a larger number of available aspects in the sample, seems to be the natural path to continue this research. Including specific Faculty variables might be particularly enlightening. Despite these limitations, all the results point to strong heterogeneous effects that are not adequately captured using simple regression analysis. In conclusion, the heterogeneities suggest that the stronger effects show up in the lower part of the distribution, meaning that the explanatory factors contribute very little in differentiating among good students and that they are relevant in explaining differences in performance among relatively poor performers. Even though preliminary, this suggests that there is more space for the "university policy" interventions to be targeted towards improving the performance of low performing students.. 85.
(22) ACADEMIC PERFORMANCE OF PUBLIC UNIVERSITY STUDENTS IN ARGENTINA. 6. Conclusions This paper addresses the transitional period between the time university students are admitted to the university and the time they finish their studies, either because they drop out or because they graduate. Specifically, it studies several explanatory factors associated to academic performance based on the data from the 1994 Census of National Universities students.. We considered the number of passed courses per year by the students as the measure of academic performance and we used five groups of explanatory variables: the university and the bachelor's degree discipline; student and his/her family characteristics; type of secondary school (public/private) attended by student; student's academic progression (years elapsed since admission); and hours of study. In general, results reveal that girls perform better than boys. Ceteris paribus, being a foreigner, single or having attended private secondary schools, having moved to go to the university, having more educated parents, or spending more time studying are factors associated with better performance. Having to travel to another jurisdiction to attend college is associated with poorer performance. Estimate results show that working students perform better. As expected, the sources of financing are a statistically significant variable; students financed through scholarships and family contributions are the top performers, followed by those fmanced only through scholarships, followed by students who work and receive family contributions and, finally, the students that only receive family contributions. In each case, results are obtained by comparing other fmancing sources to self-financing. With respect to variables that indirectly represent the quality of the university, there has been no statistically significant relationship with performance found. Regarding the policy implications associated to the results found in this paper, the effects that could be more relevant for addressing concerns about equity in the university education system in Argentina are: the impact of parents' education, of fmancing sources and of attendance to a private secondary school. These factors should be taken into account when designing policies aimed at providing access and encouraging the permanence of the university students regardless of their socio-economic background. Clearly, these policies deserve a careful discussion, but a scholarship program for low income students should be included in the list of essential interventions. The poor explanatory power of the estimates is an indicator of the complexity of the topic and of the potential relevance of aggregating heterogeneous populations. With respect to the former, the list of explanatory factors considered is far from being comprehensive and excludes certain potentially relevant issues that are difficult (or impossible) to quantify, associated to the family environment or to the individual's psychological characteristics, among other. Attempting to measure these phenomena or to quantify the severity of these omissions seems to be the logical path for future research. With respect to the second potential reason for the poor explanatory power, future research should explore in detail the advantages and disadvantages of defining homogeneous reference populations or, alternatively, suggest models that allow controlling for and taking advantage of these heterogeneities. References like Antweiler (2001) or Baltagi et al (2001) could be an interesting methodological line to consider. A simple strategy consists of making estimates for more specific groups (certain bachelor's degree disciplines, cohorts, regions, etc.) to quantify potential disparities in the process that determines academic performance. Obviously, in addition to the previously mentioned cost in terms of losing degrees of liberty, this leads to a constrained analysis, since certain relevant factors are not identified in homogeneous samples. For example, a critical variable in academic performance refers to the distribution of. 86.
(23) WELL-BEING AND SOCIAL POLICY VOL 3, NUM. 2, pp. 67-100. education resources (teachers, installations, etc.), so it is important to exploit regional variability and this is automatically eliminated when the analysis, in the pursuit of homogeneity, is based on a specific university. Certain homogeneity aspects are relevant, particularly the one referring to the temporality of the problem. Clearly, the sample of "active" students at the time of the Census is not a random sample of the reference population As an example, in a Five year bachelor's degree program, the cohort admitted in 1989 is potentially under-represented in the 1994 Census because the top performers in this cohort had probably completed their studies by that year and are therefore not included in the survey. This self-selection problem could have non-trivial consequences in the analysis and should be taken finto account. This study also uses an innovative approach to explore the role of the unobservable heterogeneities and their potential interaction with observable factors. The effect of several performance determinants varíes according to where it is measured. As an example, if we take the effect of hours of study on performance, although the effect is positive in afi quantiles in the conditional distribution of performance, the effect of additional time is stronger in the lower tafi. Thus, as hours of study increase, the distribution of performance becomes more homogeneous. Several paths for future research emerge from this study. A more in-depth analysis that separates individual from regional factors could be a significant contribution to defining how regional and national policies should interact. The results presented suggest that this is a delicate task that requires accurately defining the degree of aggregation relevant to the analysis. Another important future contribution could be to adopt a production frontier approach, which implies exploring more sophisticated analytical methods. Alternatively, it is essential to reduce the role of unobservable heterogeneities in order to be able to isolate more accurately the role of the factors discussed in this study. This requires extending the available data base to have specific information on several dimensions, such as regional information, detailed information on students, their bachelor's degree discipline and their university.. 87.
(24) ACADEMIC PERFORMANCE OF PUBLIC UNIVERSITY STUDENTS IN ARGENTINA. Annex 1: Tablas and Figures Tabla 1 Characteristics of Public University Students According to the 1994 Census Universities. Surveyed students. Age. male. Father's education in years. Mother's education in years. single. 173,149. 24.2. 42.9. 11.7. 11.3. 82.7. 2. Univ. Nac. de Catamarca. 3,243. 25.9. 41.4. 10.0. 10.6. 74.7. 3. Univ. Nac. del Centro 4. Univ. Nac. del Comahue. 4,853. 23.6. 53.6. 9.5. 9.9. 86.7. 8,785. 24.2. 38.7. 9.1. 9.2. 76.6. 68,867. 23.6. 44.4. 11.7. 11.7. 85.5. 14,709. 23.2. 40.5. 11.3. 11.0. 87.4. 23.5. 43.2. 9.9. 10.2. 82.0 78.0. 1.Univ. Nac. de Buenos Aires. 5. Univ. Nac. de Cordoba 6. Univ. Nac. de Cuyo 7. Univ. Nac. de Entre Rios 8. Univ. Nac. de Jujuy 9. Univ. Nac. de La Pampa 10.Univ. Nac. de La Patagonia S. J. B.. 5,682 2,976. 25.5. 45.4. 8.3. 8.3. 3,163. 22.4. 48.2. 8.9. 9.5. 86.3 73.9 87.1. 4,264. 25.2. 42.1. 9.1. 9.1. 11.Univ. Nac. de La Plata 12.Univ. Nac. del Litoral. 47,690 13,793. 23.4 23.6. 48.8 49.5. 9.5 11.2. 9.4 11.3. 13.Univ. Nac. de Lomas De Zamora. 18,479. 26.1. 46.2. 9.5. 9.2. 70.6 81.6. 84.2. 6,587. 24.1. 43.0. 9.0. 9.1. 17,584. 24.0. 41.8. 10.5. 10.6. 81.7. 16.Univ. Nac. de Misiones. 6,104. 24.0. 43.3. 9.0. 9.4. 80.9. 17.Univ. Nac. del Nordeste. 32,083. 24.4. 48.0. 10.9. 11.1. 80.9. 6,874. 22.8. 46.8. 9.5. 9.9. 85.9. 41,922. 14.Univ. Nac. de Lujan 15.Univ. Nac. de Mar Del Plata. 18.Univ. Nac. de Rio Cuarto. 23.9. 43.9. 11.5. 11.3. 84.6. 20. Univ. Nac. de Salta 21. Univ. Nac. de San Juan. 8,439. 24.3. 45.2. 9.2. 9.3. 83.6. 7,525. 24.1. 47.7. 10.0. 10.1. 84.9. 22. Univ. Nac. de San Luis 23. Univ. Nac. de Santiago del Estero. 5,920 2,240. 24.7. 37.2. 9.7. 10.2. 78.5. 23.7. 48.8. 9.9. 10.4. 85.1. 24. Univ. Nac. del Sur 25. Univ. Tecnologica Nacional (1). 6,467. 22.6. 49.8. 10.8. 10.7. 89.2. 55,333. 23.3. 84.9. 26. Univ. Nac. de Tucuman 29. Univ. Nac. de La Rioja. 23.9 27.2. 10.3 11.6 10.2. 10.1. 31,248 5,286. 79.7 44.2 46.8. 11.6 10.5. 85.5 62.8. 53. Univ. Nac. de Quilmes. 1,407. 23.8. 42.6. 10.1. 10.0. 84.7. 39.9. 8.0. 8.1. 77.7. 9.0. 88.7. 19.Univ. Nac. de Rosario. 54. Univ. Nac. de Formosa 55. Univ. Nac. de La Matanza. 1,428. 24.4. 7,965. 22.4. 45.2. 9.2. 234. 23.6. 47.0. 9.6. 9.3. 79.6. TOTAL. 614,299. 24.0. 46.0. 10.0. 10.0. 81.8. 234. 22.4. 37.2. 614,299 33,326.9. 27.2. 79.7. 8.0 11.7. 8.1 11.7. 62.8. Maximum Standard Deviation. 1.1. 7.2. 1.0. 0.9. 57. Univ. Nac. de General San Martin Minimum. 88. 89.2 5.7.
(25) WELL-BEING AND SOCIAL POLICY VOL 3, NUM. 2, pp. 67-100 Table 1 (continued) Secondary school. Universities. 1.Univ. Nac. de Buenos Aires 2. Univ. Nac. de Catamarca 3. Univ. Nac. del Centro 4. Univ. Nac. del Comahue. Number scholarship holders. 1,236 132 273 540. prívate. 43.9 22.2 24.4 12.3 43.2. 5. Univ. Nac. de Cordoba. 917. 6. Univ. Nac. de Cuyo 7. Univ. Nac. de Entre Rios 8. Univ. Nac. de Jujuy 9. Univ. Nac. de La Pampa 10.Univ. Nac. de La Patagonia S. J. B.. 513 634 127 212 138. 28.0 13.0 25.0 17.0. 1,105 612. 29.0 32.4. 53 193 337. 39.7. 11.Univ. Nac. de La Plata 12.Univ. Nac. del Litoral 13.Univ. Nac. de Lomas De Zamora 14.Univ. Nac. de Lujan 15.Univ. Nac. de Mar Del Plata 16.Univ. Nac. de Misiones 17.Univ. Nac. del Nordeste 18.Univ. Nac. de Rio Cuarto 19.Univ. Nac. de Rosario 20. Univ. Nac. de Salta 21. Univ. Nac. de San Juan 22. Univ. Nac. de San Luis 23. Univ. Nac. de Santiago del Estero 24. Univ. Nac. del Sur 25. Univ. Tecnologica Nacional (1) 26. Univ. Nac. de Tucuman 29. Univ. Nac. de La Rioja 53. Univ. Nac. de Quilmes 54. Univ. Nac. de Formosa 55. Univ. Nac. de La Matanza 57. Univ. Nac. de General San Martin TOTAL. Minimum Maximum Standard Deviation. 32.9. % dependent on National University. % that live in a different jurisdiction. % that had to move to study. 9.1 11.3. 38.2 16.5. 12.4 16.4. 4.1 2.6 12.9. 5.9 27.1. 52.8 27.6. 8.9 50.6 14.9 19.4 3.9. 46.0 18.2 39.7 13.0 58.4 19.0. 30.5 3.7 3.0 5.3 4.0 15.6 7.4 3.2 2.2 6.4. 4.5 14.9 20.6 52.9 48.2 6.6. 408 427. 32.8 35.7 22.0 14.4. 2.4 1.5. 8.3 25.4. 558 424. 40.2 38.4. 3.7 14.9. 4.4 9.2. 251 480 352 325. 33.5 17.1 26.9 19.2 29.5 25.1. 3.5 30.4 16.3 2.1. 6.5 60.0 5.0. 221 1,140 107 36. 41.3 9.1 35.7. 16.8 5.3 12.2. 2.9 6.6 24.8 43.8 41.5 42.4 35.9 15.8 10.8 48.5 13.2 39.7 15.5 31.1 11.4 5.4. 16 14. 9.2 36.1 41.3. 2.2 6.7. 2.9 43.4 1.1 30.8 26.4. 11,824. 35.0. 9.6. 24.3. 26.0. 14 11,824. 9.1 43.2. 1.3 30.5. 339.7. 10.5. 7.7. 1.1 60.0 16.7. 0.9 58.4 16.7. 17 26. 89. 2.9 2.9 1.3. 17.7 6.5 24.7 15.1. 43.9 38.3. 30.7 0.9 2.1.
Figure
Documento similar
In the “big picture” perspective of the recent years that we have described in Brazil, Spain, Portugal and Puerto Rico there are some similarities and important differences,
The aim of the Academic Activity Index (AAI) is to measure in a single value the different activities of teaching, research and management of teachers in a Spanish university,
In the previous sections we have shown how astronomical alignments and solar hierophanies – with a common interest in the solstices − were substantiated in the
What is perhaps most striking from a historical point of view is the university’s lengthy history as an exclusively male community.. The question of gender obviously has a major role
Bausseron [60] underscore the modulating role of self-efficacy in the relationship between emotional intelligence and academic performance in secondary school students; finally,
The Dwellers in the Garden of Allah 109... The Dwellers in the Garden of Allah
that when looking at the formal and informal linguistic environments in language acquisition and learning it is necessary to consider the role of the type of
Safety and performance of the drug-eluting absorbable metal scaffold (DREAMS) in patients with de-novo coronary lesions: 12 month results of the prospective, multicentre,
