Bioelectrochemical System with a Proton Exchange Membrane for Wastewater Treatment
12
0
0
Texto completo
(2) ____________________________________________________________________________. 1. Introduction 1.1 Energy Demand. The use of fossil fuels in recent years has brought with it many problems of high environmental impact. According to the IEA, fossil fuels represent 86% of global energy consumption [1]. However, the use of energy from petroleum has serious disadvantages, the main one of which is that they are finite sources, which means they will eventually be terminated. According to some predictions [2], crude oil reserves will last at least 50 years at the current rate of consumption. In addition to this, the burning of hydrocarbons is directly related to the emission of gases to promote the greenhouse effect, mainly by the emission of carbon dioxide (CO2) [3]. Increasing the concentration of greenhouse gases (GHG), different phenomena have been observed such as: increased of the global average temperature, consequently, the melting of the polar caps and changes in the precipitation pattern. Energy consumption today is estimated at 22 trillion kWh by 2020 [4].. 1.2 Hydrogen as an energy carrier. Hydrogen (H2) is known to be an energy carrier, since it needs to be produced through some method and then used in other process. Hydrogen has become the central axis of new technologies for the generation of energy due to the characteristics it presents, mainly the energy density. It is reported that the energy released in the case of H2 is 120 MJ/kg, which far exceeds hydrocarbons such as 50 MJ/kg of natural gas, 44 MJ/kg of oil and 20 MJ/kg of methane [1]. The biological production is considered the most efficient and friendly with the environment process, compared to the electrolysis and thermal processes. Some microorganisms possess the ability to produced hydrogen by means of enzymes such as dehydrogenase and nitrogenase [5]. Although there is a wide variety of methods for producing hydrogen, not all are fully sustainable. Currently, more than 96% of the production of hydrogen is produced by using fossil fuels. Therefore, despite the benefits of hydrogen, its production by these processes does not solve the problem of the emissions of GHG.. 1.3 Microbial Electrochemical Systems. Microbial electrochemical systems (MES) use microorganisms to convert the chemical energy stored in biodegradable materials to direct electric current and chemicals. Compared to traditional methods, these technologies offer a new solution for integrated waste treatment and energy and resource recovery. An example of this technologies is the microbial fuel cells (MFC) which can use carbon sources present in different wastewater (municipal and industrial wastewater) as fuel to produce electricity, also these devices can be used to treat wastewater. A conventional MFC consists of an anodic chamber and a 508 | P á g i n a.
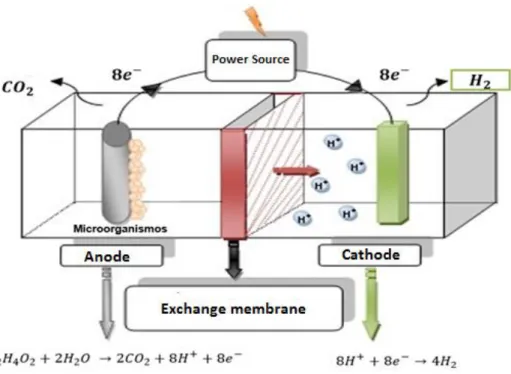
(3) cathodic chamber which are separated by a membrane, usually a protonic exchange membrane. The anodic chamber is under anaerobic conditions, while the cathode has an oxygen inlet. Inside the anodic chamber, the oxidation of the organic matter is carried out releasing protons, electrons and CO2. Electrons travel through an external circuit from the anode to the cathode, while protons migrate through the solution and reach the cathode chamber to combine with oxygen and form water. A new technology to produce hydrogen from biomass is the microbial electrolysis cell (MEC), which are a modification of the MFC that offers a viable option for the sustainable generation of an energy carrier from a wide variety of substrates such as wastewater [4]. Compared to conventional processes for producing hydrogen (dark fermentation, biomass gasification, etc.), MECs have several advantages, one of them and the most attractive is that the energy requirements are low approximately 0.6 - 1 kWh/m3H2, which is less than the traditional water electrolysis (4.5 – 50.6 kWh/m3H2) [5]. Traditionally, the components of a MEC consist of: anodic chamber, cathodic chamber, an ion exchange membrane, electrochemically active microorganisms and a power source. Microorganisms colonize the anode and oxidize organic matter by decomposing into CO2, electrons (e-) and protons (H+) as part of its metabolism. Electrons are released from the microbial cell pass to the anode where they travel through an external circuit to the cathode, while protons migrate through the solution and the membrane to finally recombine with the electrons and form hydrogen. Figure 1 schematize the operation of a MEC.. Figure 12. Diagram of the operation of an MEC.. 1.3.1 Ion Exchange Membranes.. 509 | P á g i n a.
(4) The use of an ion exchange membrane is used in two-chamber systems and presents the advantage that the hydrogen produced has a high purity, also the presence of a membrane avoids the consumption of the gas by microbial action and additionally is used to avoid short circuits [6]. The ion exchange membranes can be divided by: cationic, anionic and bipolar [6]. Cationic exchange membranes have negatively charged functional groups, such as: SO32-, COO-, PO32-, or PO3H-, these groups allow the migrations of cations. Among the most used membranes are the proton exchange membranes (PEM), as its name indicates, allows only the migrations of H+. The most used PEM is Nafion, which offers high proton conductivity due to the sulfonic groups attached to the inert structure of polytetrafluoroethylene. Bipolar membranes (BPM) are formed by a cation exchange layer and an anionic exchange layer attached, forming a wet bonding interface. In some cases, the wet layer is considered a third layer. Through the effect of an electric field, the water splits forming protons and hydroxyl ions [7]. Theoretically, the voltage required for the operation of some BPM is 0.83 V. In this study, the effect of a BPM was evaluated in a MEC, using as substrate wastewater from the Treatment Plant which was enriched with sodium acetate 20 mM, and chloride sodium 100 mM as catholyte. The parameters that were analyzed to evaluate the performance of the MEC were: the conductivity, the presence of metals, the pH, the removal of COD, as well as the gas produced.. 2. Materials and Methods 2.1 Design and Construction of the Bioelectrochemical Reactor.. The bioreactor was desing by using Solid Works with an architecture of a two chambered MEC, each chamber has a volume of 500 mL. The material used was nylamid, since the material provides the necessary characteristic of manipulation and resistance to operate the electrochemical system. The anode chamber has four inputs, mainly to place the anode and for another attachment for pH monitoring, electrical conductivity or for sampling. The cathode chamber only has one input to place the cathode and has a gas manifold with a volume of 250 mL.. 2.2 Physicochemical characterization of wastewater. 2.2.1 COD quantification.. 510 | P á g i n a.
(5) The consumption of the organic matter was evaluated through the COD. The quantification of COD was performed according to the NMX-AA-030/2-SCFI-2011 norm, which is a spectrophotometric analysis [8]. Residual water contained COD between 400 and 680 mg COD/mL. Sodium acetate was added to enriched the wastewater at a concentration of 20 mM. Once the characterization was carried out, the percentage of COD removal of each batch evaluated as MFC was calculated using the following formula:. Where: CODi= initial concentration CODf= final concentration. The degradation kinetics of the COD were carried out at different intervals. The first kinetics were carried out in 3.5 hours, a sample of water from the anode chamber was taken every 30 minutes. The residual water was enriched with 20 mM sodium acetate, which was considered as a contribution to the COD.. 2.2.2 Elemental analysis of metals by XRF.. The analysis for the identification and quantification of metals was carried out in the Faculty of Chemical Sciences in the laboratory of Physical Chemistry. A volume of 20 mL of waste water was filtered using a 0.45 μm filter to avoid the passage of organic material. Then, 995 μL of waste water and 5 μL of gallium standard (Ga) were taken and both were mixed. Quartz disks were used, which were rinsed with acetone. Once dried, 10 μL of sample was taken and placed in the center of the disk, 4 measurements were made. The discs were then placed on a heating grill to evaporate the water. Finally, the already dried discs were installed on the reading reel where the irradiation time of each sample was 300 seconds.. 2.2.3 Conductivity and pH.. The pH and conductivity parameters were measured using the EXTECH Instruments Oyster pH-conductivity-TDS potentiometer. Calibration to measure pH was performed with buffer solutions of pH 7 and pH 4. The electrode was rinsed with deionized water and the 511 | P á g i n a.
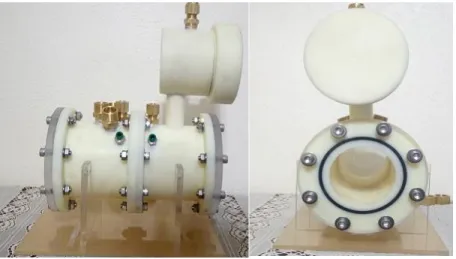
(6) solution temperature was adjusted to approximately 25 ° C. The electrode was then rinsed and dried to introduce it into the value buffer 7 until it stabilized. It was then rinsed and dried to pH 4 buffer until stabilized. Finally, the pH value in the residual water sample was measured. The calibration to measure conductivity was carried out by placing the electrode in tap water. The potentiometer was then adjusted to measure conductivity (μS / cm) and the conductivity of the waste water was measured.. 2.3 Electrochemical evaluation.. 2.3.1 Cyclic Voltammetry.. The electrochemical evaluation was carried out using the following configuration: graphite as working electrode (anode for biofilm formation), Pt as cathode (1 cm 2) and as counter electrode. A velocity of 10 mV / s for 2 cycles was used in a potential window of 1.1 to 1.1 V using Nafion 117 ion exchange membrane.. 2.3.2 Polarization and Power Curves.. The Polarization and Power curve for the first experimental part was carried out using the Nafion 117 membrane using the linear scanning voltammetry technique [9] at a scanning speed of 1 mV / s. The technique was performed every 48 hours to monitor the power increase.. 3. Results 3.1 Design and Construction. . The three-dimensional design of the bioelectrochemical system is shown in Figure 2. It can be observed that the bioreactor has a two-chamber architecture separated by a flange where the membrane to be evaluated.. 512 | P á g i n a.
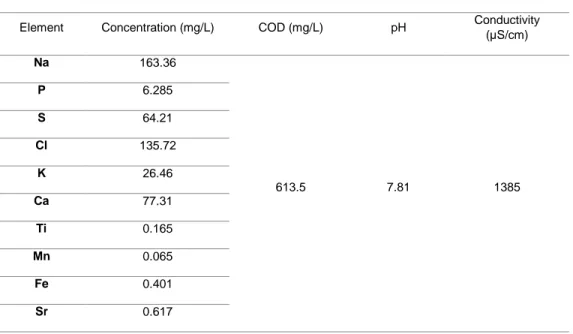
(7) Figure 13. a) Front view; b) interior view. The construction of the biochemical system was developed in the CIMAV prototypes workshop. Figure 3 shows the bioreactor.. Figure 14. Microbial Electrolysis Cell.. 3.2 Physicochemical analysis of Wastewater.. The analyzes for the detection of metals do not show the presence of heavy metals. The elements found correspond to the typical load of a domestic wastewater. With respect to COD the measured values are between 620 and 400 mg/L on average. With respect to COD the measured values are between 620 and 400 mg / L on average. The pH and conductivity are also within the parameters already reported for domestic wastewater. Table 1 shows the results of the analyzes performed.. 513 | P á g i n a.
(8) Tabla 1. Values of the evaluated parameters. Element. Concentration (mg/L). Na. 163.36. P. 6.285. S. 64.21. Cl. 135.72. K. 26.46. Ca. 77.31. Ti. 0.165. Mn. 0.065. Fe. 0.401. Sr. 0.617. COD (mg/L). pH. Conductivity (µS/cm). 613.5. 7.81. 1385. 3.2.1 COD removal. The initial COD concentration was 406 mg/L considering the contribution of sodium acetate. After 3.5 hours, the COD decreased to 246 mg/L. The percentage of removal for this experiment of 3.5 hours was of 39.41%, this percentage is considered good since in other works [10,11] the percentages reached in 120 hours reached 45-48%. Figure 4 shows the curve for COD removal.. Figure 15. COD Removal. 514 | P á g i n a.
(9) 3.3 Electrochemical Evaluation.. 3.3.1 Cyclic Voltammetry. The results of the cyclic voltammetry allow monitoring the formation of the biofilm at the anode by increasing the generation of electric current. Figure 5 shows the curves obtained when the anode is not colonized, at 15 and 45 days after colonization.. Figure 16. Cyclic Voltammetry at different stages 1) uncolonised, 2) 15 days after, 3) 45 days after.. The first curve obtained shows that the electrochemical activity is almost null, which confirms that no exoelectrogenic bacteria are present. In our case, the oxidation peak is observed around 0.5 V with a current generation of 57.45 μA.. 515 | P á g i n a.
(10) After 15 and 45 days, a cyclic voltammetry was performed on the anode to compare the bioelectrochemical activity. These results suggest that the formation of the biofilm is taking place on seeing an increase in current.. 3.3.2 Polarization and Power Curves.. The first graph shown was performed at time 0, the second graph corresponds to the curve performed at 48 hours and the third image represents the curve at 96 hours after the experiment was started. Figure 6 shows the curves.. 516 | P á g i n a.
(11) Figure 6. Polarization and Power Curves: 1) 0 time, 2) 48 h, 3) 9 h. Power curves show behavior that increases over time. The maximum reported potencies were: a) for the time 0: 6.51 mW/m2, b) at 48 hours: 8.22 mW/m2 and c) at 96 hours: 13.24 mW/m2.. 4. Conclusion The performance of the bioelectrochemical system showed a progressive increase as microbial activity was established. The formation of the biofilm is a process that is given continuously, through cyclic voltammetry was observed as this activity is increasing as the days pass. The percentage of COD removal was 40%, however, it took about three weeks for the colonization of the anode and to be able to perform the purification. It is expected to monitor the kinetics for 8 hours to be able to compare with the reported literature. The maximum power generated was reached at 96 hours of operation, this suggests that the microbial consortium continues in formation. Gas measurement and evaluation of the bipolar membrane is being carried out.. Acknowledgements We thank CONACyT for the support granted through the scholarship and the SMH for the acceptance of the project in poster mode.. References [1] Kadier, A. Yibadatihan, S, Peyman, A., Nadia, K. Chandrasekhar, Mohd S, Kalil, A comprehensive review of microbial electrolysis cells (MEC) reactor designs and configurations for sustainable hydrogen gas production, Alexandria Engineering Journal, 2016, Pages 427-443 [2] Lamb, R. When will we run out of oil, and what happens then? Website: ⟨http://science.howstuffworks.com/environmental/energy/run-out-of-oil. htm⟩ 2010. [3] Cucu A.. "Microbial Electrolysis Cell: Hydrogen Production Using Microbial Consortia From Romanian Waters." Digest Journal of Nanomaterials and Biostructures. 2013 8(3): 1179-1190.. 517 | P á g i n a.
(12) [4] Boden, T.A., G. Marland, and R.J. Andres. 2016. Global, Regional, and National FossilFuel CO2 Emissions. Carbon Dioxide Information Analysis Center, Oak Ridge National Laboratory, U.S. [5] A. Escapa, R. Mateos, E.J. Martínez, J. Blanes, Microbial electrolysis cells: An emerging technology for wastewater treatment and energy recovery. From laboratory to pilot plant and beyond, Renewable and Sustainable Energy Reviews, 2016 (55) Pages 942-956 [6] Oliot M., Galier S., Roux de Balmann H., Bergel A. Ion transport in microbial fuel cells: key roles, theory and critical review. Appl Energy 2016; 188; 1682-1704. [7] Yossan S, Xiao L, Prasertsan P, He Z. Hydrogen production in microbial electrolysis cells: choice of catholyte. Int J Hydrogen Energy 2013; 38: 9619–24. [8] Norma Mexicana NMX-AA-030-2-SCFI-2011 https://www.gob.mx/cms/uploads/attachment/file/166775/NMX-AA-030-2-SCFI-2011.pdf [9] Liu, L., Tsyganova O., Lee D., Su A., Chang J.S., Wang A., Ren N. Anodic biofilm in single chamber microbial fuel cells cultivated under different temperatures. International Journal of Hydrogen Energy, 37, 15972-15800.. 518 | P á g i n a.
(13)
Figure

Documento similar