FLY ASH/RARE EARTH OXIDES NANOCOMPOSITES FOR THERMAL BARRIER COATINGS PRODUCED BY ELECTROPHORETIC DEPOSITION
12
0
0
Texto completo
(2) XXII INTERNATIONAL MATERIALS RESEARCH CONGRESS. This waste is chemically constituted by mullite and a number of other oxides, it has a reported thermal conductivity of 0.47 W/mK at a temperature of 900 °C [11], also has a high melting point and is main characteristic is that has a morphology composed by hollow spheres, called cenospheres. There are many processes for the development of coatings such as APS or CVD, however, these processes are expensive, complex, involve many variables in the process and sometimes they are time consuming. That's why in this research we propose to work with the EPD process which is simple, cheap, fast and very flexible if you have complex morphologies substrates in addition to its facility to be scaled to an industrial level. The aim of this work is to found new stable phases with free SiO2 present in fly ash, through additions of Gd2O3 and Nd2O3 nanoparticles in different concentrations, to produce improved TBCs by the EPD process. Experimental procedure Fly ash from Coahuila Mexico Electrical Power Plant was used as starting material. For the morphological characterization of fly ash and the coatings surface, scanning electron microscopy (SEM) analysis were carried out using a FEI Nova Nano SEM 200 system equipped with energy dispersive spectroscopy (EDS) and INCA software, resolution of 1.5 nm at 10 kV (under vacuum). Quantitative chemical composition of fly ash was determined using atomic absorption spectroscopy (AA) with a Thermo brand equipment and inductively coupled plasma (ICP) also with a Thermo brand equipment.The phases present in fly ash were identified using X-ray diffraction (XRD) (Empyrean, Panalytical diffractometer from Philips)), the counts were recorded from 5 to 100° (2) with a step of 0.017° (2), and a counting time of 40 s, using copper radiation. Fe2O3 was eliminated through a dry and wet magnetic separation process with neodymium magnets. In Addition, C was removed by calcination at 650 °C for 2 h. To determine the possible compounds of CCV with Gd2O3 and Nd2O3 with lower thermal conductivity, mixtures were made with different ratios of CCV and oxides. To each powder mixture were added 30 ml of acetone (JT Baker, with a purity of 99.6 %) and subsequently subjected to a conventional ultrasonic bath for 3 h, the mixtures were subjected to a heat treatment at 1000 °C with a heating rate of 10 °C/min for a period of 2 h. To determine if the formation of a new compound was successful, XRD was performed on each of the mixtures with the same equipment mention before. Thermal conductivity for different Fly ash-Gd2O3 and Fly ash-Nd2O3 composites was measured using a Heat Flow Meter Apparatus (ASTM C 518). Fly ash and fly as with addition of 10 and 20 wt% of Gd2O3 and Nd2O3 respectively were used to produce two identical coatings of each type with the same EPD conditions. 1 wt% of solids in acetone suspensions with addition of 2.5 mg of I2 were prepared and put in an ultrasonic bath for a minimum of 2 hr The coatings were deposited on SiC substrates using 500 V for 3 min. One coating was sintered at 1100 °C and the other at 1200 °C, both for a period of 3 h with a heating rate of 5 °C/min. 2.
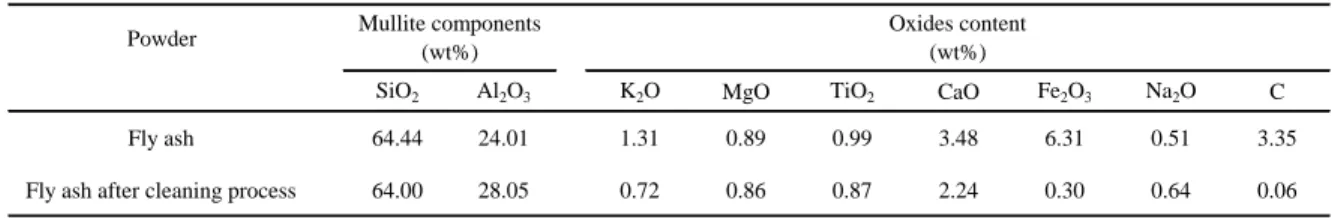
(3) XXII INTERNATIONAL MATERIALS RESEARCH CONGRESS. The homogeneity of all the elements in the coating was determined by performing an X ray elemental mapping of the surface of the coating with the EDS system mention before. Results XRD diffractograms and SEM micrographs of fly ash particles and the rare earth oxides used, Gd2O3 and Nd2O3 respectively are presented in Figure 1. Figure 1 (b) shows a broken sphere with different particles within, which shows that the morphology of fly ash is not only spherical but that is composed by hollow spheres (cenospheres). Furthermore you can see other particles with irregular morphology which are surrounded by smaller spheres. Similarly, in Figure 1 (d) we can see Gd2O3 nanoparticles which tend to agglomerate to form blocks, and in Figure 1 (f) we observed a micrograph of Nd2O3 nanoparticles which have a needle-type morphology and that tend to agglomerate randomly. Fly ash characterization by XRD is shown in Figure 1 (a), in which it can be seen that the ash sample has an amorphous portion, also has crystalline phases like SiO2, an aluminosilicate compound (Al4.52O9.74Si1.48) wish corresponds to mullite, and calcium carbonate (CaCO3). With this equipment it was not possible to detect any other crystalline phase such as hematite (Fe2O3) because they are present in amounts below the detection limit of the technique.XRD diffractograms were also obtained for the selected oxides, for Gd2O3 are shown in Figure 1 (c) and for Nd2O3 is presented in Figure 1 (e). As can be seen Gd2O3 is crystalline and shows a single phase, while Nd2O3 shows otherwise. In Figure 1 (e) the upper diffractogram corresponds to commercial Nd2O3 without any treatment, however through XRD technique was identified that the powder did not correspond to Nd2O3 but to neodymium oxide carbonate (Nd2O2CO3). Based on these results it was necessary to subject the material to a heat treatment of 1000 °C for 1 in order to remove the CO2 content in the sample and obtain only Nd2O3. The lower diffractogram in Figure 1 (e) confirms that the thermal treatment worked and indeed the resulting material is now crystalline Nd2O3. Chemical analysis results of a fly ash sample are presented in Table 1, they show that fly ash consists mainly of SiO2 and Al2O3 and other oxides compounds in small amounts, including Fe2O3, K2O, MgO, TiO2, Na2O and CaO. Table 1. Chemical composition of fly ash. Powder. Mullite components (wt%). Oxides content (wt%). SiO2. Al2O3. K2 O. MgO. TiO2. CaO. Fe2O3. Na2O. C. Fly ash. 64.44. 24.01. 1.31. 0.89. 0.99. 3.48. 6.31. 0.51. 3.35. Fly ash after cleaning process. 64.00. 28.05. 0.72. 0.86. 0.87. 2.24. 0.30. 0.64. 0.06. 3.
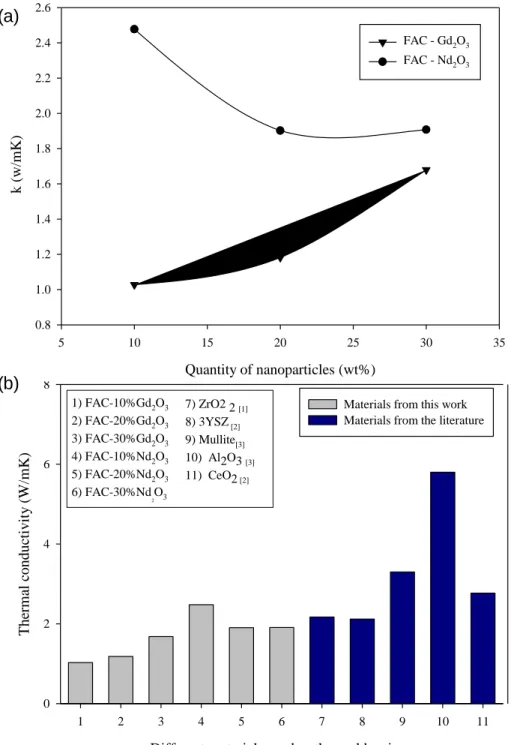
(4) XXII INTERNATIONAL MATERIALS RESEARCH CONGRESS. XRD diffractograms of powder samples of the different compounds of fly ash adding rare earth oxides are shown in Figures 2. In the diffractogram different phases such as mullite, SiO2, as well as Gd2O3 and Nd2O3 were observed for each case, but new phases are also shown in both cases, corresponding to a gadolinium oxide silicate (Gd9.33(SiO4)6O2) and neodymium oxide silicate (Nd9.33(SiO4)6O2). Compounds with greater amount of silicate are formed containing 10 to 20 wt% of Gd2O3 and Nd2O3 respectively. Emphasizing in Figure 2 (a), we can see that compounds with greater presence of silicate are those containing 10 and 20 wt%. of Gd2O3. The highest peak of Gd9.33(SiO4)6O2 is in the compound containing 10 wt%. of Gd2O3. This same compound compared with others, has the smallest characteristic peak of Gd2O3, partly because it has less quantity but also for having reacted with SiO2 more than the other compounds. Another noteworthy point is that the characteristic peak of SiO2 is higher in the composite with 10 wt% of Gd2O3 that in the compound with 20 wt%, this may be due to the fact that the characteristic peak of the silicate and SiO2 are too close, then the greater inflexion of the silicate could contribute to increased the peak height of SiO2, and so the highest peak of the silicate would not be in the compound with 10 wt% of Gd2O3 but in the one with 20 wt%. This is why, to decide with which compound was the best , we took into account the results of the measurements of thermal conductivity and indeed the compound with lower thermal conductivity at room temperature was found to be the compound with 10 wt% of Gd2O3, later in this section the results obtained in these measurements will be presented. Figure 2 (b) shows the results of the XRD characterization of the compounds formed from the addition of Nd2O3 to a fly ash matrix. In the XRD diffractograms of the compounds corresponding to fly ash and Nd2O3, as in the compounds of fly ash and Gd2O3, compounds with 10 and 20 wt% of oxide are those with more presence of a silicate compound. In this case the greater presence of silicate are the compounds containing 20 wt%. of Nd2O3. As can be seen from the XRD all peaks corresponding to Nd9.33(SiO4)6O2 are higher than any of the other compounds, and the peaks corresponding to the SiO2 are smaller in comparison with others. Therefore it was concluded that Nd2O3 reacted with the free SiO2 present in fly ash. Just like with the Gd2O3 compounds thermal conductivity measurements at room temperature showed that this compound had the lowest value of thermal conductivity. It is for this reason that the ratio of fly ash-20 wt%. of Nd2O3 was chosen to continue experimenting and developing coatings. The results of the thermal conductivity measurements are shown in Figure 3 (a), as can be seen the compounds with lower thermal conductivity are: the compound of fly ash-10 wt%. of Gd2O3 and the compound of fly ash-20 wt% of Nd2O3, with 1.0274 and 1.9024 W/mK respectively. These data agree with the idea that the thermal conductivity decreases as the Gd9.33( SiO4)6O2 and Nd9.33(SiO4) 6O2 is forming for each case.. 4.
(5) XXII INTERNATIONAL MATERIALS RESEARCH CONGRESS. (a). 12000. (b) Silicon Oxide (SiO2) Aluminim silicate (Al4.52O9.74Si1.48) Calcium carbonate (CaCO3). Intensity (counts). 10000. 8000. 6000. 4000. 2000. 0 20. (c). 30. 40. 50. 60. 70. 80. 2 (°). (d). 30000 Gadolinium oxide (Gd2O3). Intensity (counts). 25000. 20000. 15000. 10000. 5000. 0 20. 40. 60. 80. 100. 2 (°) 25000. (e). Neodymium oxide carbonate - Commercial (Nd2O2CO3) Neodymium oxide carbonate - Commercial (Nd2O2CO3)(f) Neodymium oxide - Heat treatment (Nd2O3) Neodymium oxide - Heat treatment (Nd2O3). 20000. Intensity (counts). Intensity (counts). 20000. 25000. 15000 15000. 10000 10000. 5000 5000. 0. 0. 20. 20. 40. 40. 60. 60. 80. 80. 100. 100. 2 (°) 2 (°). Figure 1. XRD diffractograms and SEM micrographs of (a) (b) fly ash, (c) (d) Gd2O3 nanoparticles and (e) (f) Nd2O3 nanoparticles.. 5.
(6) XXII INTERNATIONAL MATERIALS RESEARCH CONGRESS. (a). Intensity (counts). FAC-40 wt% GdGd 60% CCV-40% 2O23O3. FAC-30 wt% GdGd 70% CCV-30% 2O23O3. Mullite (Al4.52O9.74Si1.48) Silicon dioxide (SiO2) Gadolinium oxide (Gd2O3) Gadolinium oxide silicate (Gd9.33(SiO4)6O2). FAC-20 wt% GdGd 80% CCV-20% 2O23O3. FAC-10 wt% GdGd 90% CCV-10% 2O23O3. 20. 30. 40. 50. 60. 70. 80. 2 (°). (b). Intensity (counts). FAC- 40 wt% Nd2O3. FAC- 30 wt% Nd2O3. Mullite (Al4.52O9.74Si1.48) Neodymium oxide silicate (Nd9.33O26Si6) Silicon dioxide (SiO2) Neodymium oxide (Nd2O3) Neodymium silicon (NdSi1.25). FAC- 20 wt% Nd2O3. FAC- 10 wt% Nd2O3. 20. 30. 40. 50. 60. 70. 80. 2 (°). Figure 2XRD diffractograms of fly ash compounds with different amounts of (a) Gd2O3 and (b) Nd2O3.. Taking into account the two results the decision of discarding the rest of the compounds and only use the compounds of fly ash-10 wt% of Gd2O3 and fly ash-20 wt% of Nd2O3 to continue the development of TBCs was made. Figure 3 (b) shows plotted thermal conductivity values obtained for various materials developed for TBCs applications taken from the literature, that are being compared with the thermal conductivity values obtain for the new materials developed in this project. As shown in the graph all values of thermal conductivity of the materials developed in this research except the compound of fly ash-10 wt% of Nd2O3 have a lower thermal conductivity than the materials reported in the literature, being the compound of fly ash-10 wt% of Gd2O3, the one that has the lowest 6.
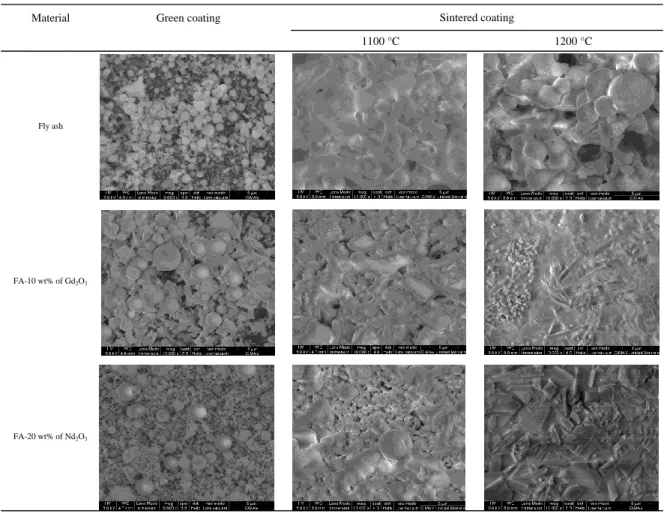
(7) XXII INTERNATIONAL MATERIALS RESEARCH CONGRESS. conductivity of all. Tables 2 and 3 show a comparison of SEM micrographs taken at low (1000X) and high (10,000X) magnification respectively of fly ash, fly ash-10 wt% of Gd2O3 and CCV-20 wt% of Nd2O3 green and sintered at 1100 and 1200 °C coatings deposited on SiC substrates.. (a). 2.6 FAC - Gd2O3. 2.4. FAC - Nd2O3 2.2. k (w/mK). 2.0 1.8 1.6 1.4 1.2 1.0 0.8 5. Thermal conductivity (W/mK). (b). 10. 15. 20. 25. 30. 35. Quantity of nanoparticles (wt%) 8. 6. 1) FAC-10%Gd2O3 2) FAC-20%Gd2O3 3) FAC-30%Gd2O3 4) FAC-10%Nd2O3 5) FAC-20%Nd2O3 6) FAC-30%Nd2O3. 7) ZrO2 2 [1] 8) 3YSZ [2] 9) Mullite[3] 10) Al2O3 [3] 11) CeO2 [2]. Materials from this work Materials from the literature. 4. 2. 0 1. 2. 3. 4. 5. 6. 7. 8. 9. 10. 11. Different materials used as thermal barriers Figure 3. (a) Thermal conductivity values of fly ash compounds with different amounts of Gd 2O3 y Nd2O3. (b) Comparison of thermal conductivity values of different materials used as TBC and the materials developed in this work.. 7.
(8) XXII INTERNATIONAL MATERIALS RESEARCH CONGRESS. Table 2. SEM micrographs taken at low magnification in green and sintered coatings on SiC substrates. Material. Sintered coating. Green coating 1100 °C. 1200 °C. Fly ash. FA-10 wt% of Gd2O3. FA-20 wt% of Nd2O3. 8.
(9) XXII INTERNATIONAL MATERIALS RESEARCH CONGRESS. Table 3. SEM micrographs taken at high magnification in green and sintered coatings on SiC substrates. Material. Sintered coating. Green coating 1100 °C. 1200 °C. Fly ash. FA-10 wt% of Gd2O3. FA-20 wt% of Nd2O3. Green coatings exhibit a homogeneous surface, however in this case the particles are physically attached only due to the arrangement that they were taking at the constant voltage application. Coatings sintered at 1100 °C are also uniform, have no cracks and they are porous. The coatings sintered at 1200 °C do not show all the same features fly ash coatings still show uniformity and porosity; however coatings of fly ash-10 wt% of Gd2O3 and fly ash-20 wt% of Nd2O3 are not uniform. In the fly ash-10 wt% of Gd2O3 coating some particles began to melt and form agglomerates and in the fly ash-20 wt% of Nd2O3 the porosity is lost and different cracks appear, these features are undesirable in a TBC. Figure 4 (a) and (b) shows X-ray elemental mapping of a coating of fly ash-10 wt% of Gd2O3 and a coating of fly ash-20 wt% of Nd2O3 respectively. In this case both coatings show the same pattern, where one can easily see that the Nd and Gd is uniformly distributed over the entire coating.. 9.
(10) XXII INTERNATIONAL MATERIALS RESEARCH CONGRESS (a). (b). Figure 4. X-ray elemental mapping of coatings of (a) fly ash-10 wt% of Gd2O3 and fly ash-(b) 20 wt% of Nd2O3 both sintered at 1100 °C.. Summary The thermal conductivity measurements of different mixtures of fly ash and rare earth oxides showed that FA-10 wt% of Gd2O3 and FAC-20 wt% of Nd2O3 nanocomposites have lower conductivity than other materials used as TBCs reported on the literature. Homogeneous and compact coatings of Fly ash/rare earth oxide were successfully deposited by EPD without cracks at 500 V during 3 minutes reaching. Formation of neodymium oxide silicate (Nd9.33O26Si6) and gadolinium oxide silicate (Gd9.33(SiO4)6O2) compounds were both formed with thermal treatment at 1100C during 3 hours. The thermal behaviour and stability of nancomposites at high temperatures is currently underway.. 10.
(11) XXII INTERNATIONAL MATERIALS RESEARCH CONGRESS. References [1] Ana Arizmendi-Morquecho, Alejandra Chávez-Valdez, Josué Aguilar-Almicar, Jaime Alvarez-Quintana. Key Engineering Materials 507 (2012) 197-202. [2] A. Chávez-Valdez, A. Arizmendi-Morquecho, G. Vargas, J.M. Almanza, J. Álvarez Quintana. Acta Materialia 59 (2011) 2556–2562. [3] A. Chávez-Valdez, J. M. Almanza-Robles, G. Vargas-Gutierrez, A. ArizmendiMorquecho. Materials Characterization 61 (2010) 1299-1303. [4] Dongming Zhu, R.A.M. NASA/TM, 2002. [5] A. Arizmendi-Morquecho, A.C.-V., J. Alvarez-Quintana. Applied Thermal Engineering 48, 2012. 48: p. 117-121.. 11.
(12) XXII INTERNATIONAL MATERIALS RESEARCH CONGRESS. 12.
(13)
Figure
Documento similar