Department of Physical Education and Sport
Phd in Sport Science, Physical Education and Physical Activity for Health
SET CONFIGURATION AS A
MODULATOR OF
NEUROMUSCULAR FATIGUE
Doctoral Thesis
Dan Río Rodríguez
A Coruña, 2018
Supervisors
Miguel Fernández del Olmo
III
A todas aquellas personas de las que tanto aprendí
pero hoy ya no están…
Abuelas Lorenza, Ara y Teresa
V
AGRADECIMIENTOS
Una sección como esta podría llevar tanta tinta como el propio documento en el que se
expresa. Porque es cierto que hasta las acciones más pequeñas tienen grandes
repercusiones y es importante estar agradecidos por haberlas vivido y, sobre todo,
haberlas podido aprovechar. La dejo en mi lengua materna y la de los agradecidos.
A mis directores quienes han sido maestros brillantes durante mi formación universitaria
y han plantado en mi persona la semilla eterna del querer conocer a través de la ciencia.
A ellos les guardaré siempre con gratitud en mi recuerdo:
La honestidad, el método y la constancia de Eliseo que me ha enseñado a tratar al
dato con la pulcritud que se espera de todo científico.
La visión, originalidad, perseverancia de Miguel quien siempre me ha inspirado a
ir más allá liberándome de cualquier paradigma a la hora de exponer mis razonamientos.
Al aprender a pensar transmitido por Rafael entre sus clases y comidas donde hallabas
los límites de tu propio pensamiento por discernir a dónde se dirigía el suyo. Está claro
que lo evidente, cuanto más original es un razonamiento, más obvio parece después. Él
me enseñó a tratar de no hacer difícil lo fácil a través de lo inútil.
A esos amigos que caben en los dedos de una mano que han sido un faro en la tormenta
y siempre han sabido recordarme los principios que nos unieron y que me llevarían a la
finalización de este proceso. Gracias Miguel, Xabi, Justice y Cefe.
A mis compañeros y egresados de ambos grupos por lo vivido y por el error. Ese gran
maestro, el fallo que nos enseñó a todos y el de los demás, además, nos previno del futuro.
VI
A los participantes en los experimentos y estudios pilotos por su voluntad para ejercer la
máxima fuerza siempre que se les requería y tolerar esos “agradables chispazos” que
tantos buenos resultados nos han aportado.
Al personal de la Facultad de Ciencias del Deporte, el INEF, que siempre han hecho lo
posible por facilitar mi labor en la investigación y especialmente al personal de Seguridad
Pablo y Domingo por velar tantas madrugadas por que llegase al día siguiente de una
pieza y con el deber cumplido.
Especialmente a mis socios Carlos y Martín, con quienes decidí convertir una pasión en
un modo de vida fundando ATP Entrenamiento Personal. A ellos les debo mucho más de
lo que jamás podré compensarles. Nunca han dejado de creer en la importancia de este
doctorado para mí. Ellos saben bien que el fin último de la ciencia es la aplicación.
La ciencia no es solo una disciplina de razón, sino también de romance y pasión. A mi
familia que me ha permitido vivir apasionado durante todos estos años renunciando a sus
momentos por algo tan nimio y simbólico como un título. Sin su educación y cuidados
hoy no estaría aquí.
A todos esos Científicos, con mayúscula, que a pesar de los años transpiran la humildad
de saber lo que no saben y todavía quieren aprender. Para ellos son las palabras de Popper:
La ciencia será siempre una búsqueda, jamás un descubrimiento real.
VII
RESUMO
A configuración da serie (SC) é clave no manexo da fatiga muscular. Esta tese presenta
tres estudos que exploraron a interacción entre a SC e os sistemas neuromuscular,
cardiovascular, perceptivo e sensoriomotor ao exercicio de forza. Nun primeiro estudio,
o tempo ata o fallo (TTF) ao 50% da forza máxima seleccionouse como paradigma
configurando as series de forma tradicional (80% TTF) e clúster (20% TTF) durante 4 e
16 series respectivamente cun tempo total de descanso de 9 minutos para distribuír entre
series. Un segundo estudo para abrir os parámetros sensoriomotores aferentes da
extremidade inferior. Finalmente, realizouse un terceiro para corroborar os resultados do
primeiro e para explorar a integración sensoriomotora no campo da fatiga do exercicio
proporcionado pola SC. Os resultados mostraron unha resposta xeral de menor fatiga para
o clúster como indica a menor perdida de forza, fatiga cortico-espinal e menor estrés
cardiovascular acompañado dunha menor percepción de esforzo. Atopáronse fortes
correlacións entre as respostas cardiovasculares e centrais. A integración sensoriomotora
está presente no cuádriceps e a inhibición aferente longa e corta é sensible á fatiga durante
o exercicio de forza.
VIII
RESUMENLa configuración de la serie (SC) es clave en el manejo de la fatiga muscular. Esta tesis
presenta tres estudios que exploraron la interacción entre la SC y los sistemas
neuromuscular, cardiovascular, perceptivo y sensoriomotor al ejercicio de fuerza. En un
primer estudio, el tiempo hasta el fallo (TTF) al 50% de la fuerza máxima se seleccionó
como paradigma configurando las series de forma tradicional (80% TTF) y clúster (20%
TTF) durante 4 y 16 series respectivamente con un tiempo total de descanso de 9 minutos
para distribuir entre series. Un segundo estudio para obruvo los parámetros
sensoriomotores aferentes de la extremidad inferior. Finalmente, se realizó un tercero
para corroborar los resultados del primero y para explorar la integración sensoriomotora
en el campo de la fatiga del ejercicio proporcionada por la SC. Los resultados mostraron
una respuesta general de menor fatiga para el clúster como indica la menor pérdida de
fuerza, fatiga cortico-espinal y menor estés cardiovascular acompañado de una menor
percepción de esfuerzo. Fueron encontradas fuertes correlaciones entre las respuestas
cardiovascular y central. La integración sensoriomotora está presente en el cuádriceps y
la inhibición aferente larga y corta es sensible a la fatiga durante el ejercicio de fuerza.
IX
ABSTRACT
Set configuration plays a key role in the fatigue management. This thesis present three
studies that explored the interaction between set configuration, neuromuscular,
cardiovascular, perceptual and afferent integration responses to resistance exercise. In a
first study the time to failure (TTF) at the 50% of maximal voluntary force were selected
as paradigm of study configuring the sets for traditional (80%TTF) and cluster (20%TTF)
configuration during 4 and 16 sets respectively with a total rest time of 9 minutes to
distribute between sets. A second study was carried out for obtaining afferent
sensorimotor parameters of the lower limb. Finally, a last study was performed to
corroborate the results of the former and to explore the sensorimotor integration on the
field of exercise fatigue provided by set configuration. The results showed a general lower
fatigue response for cluster as outlined the lower loss of force for cluster, central and
peripheral fatigue, minor cortical effects in the MEP and SICI and cardiovascular stress
accompanied with a reduced perception of effort. Strong correlations were found between
cardiovascular and central fatigue responses. Sensorimotor integration is present on the
quadriceps muscle and long and short afferent inhibition are sensitive to fatigue during
resistance exercise.
XI
CONTENTS
ABSTRACT ... VII
AGRADECIMIENTOS ... III
ABBREVIATIONS ... XIV
INDEX OF FIGURES ... XIV
INDEX OF TABLES ... XVI
I. SET CONFIGURATION ... 2
A. Mechanical effects ... 4
Speed and Power ... 5
Mechanical Work ... 6
Strength Adaptations ... 7
B. Effects over the body systems ... 9
Metabolic and Endocrine Response ... 9
Cardiovascular Response ... 10
Perceived Exertion ... 12
Peripheral and Central adaptations ... 12
C. Synthesis and perspectives ... 15
II. MUSCULAR FATIGUE CAUSED BY RESISTANCE EXERCISE ... 16
A. Fatigue Models ... 16
B. Central Fatigue ... 19
XII
D. Sensory and afferent integration: ... 23
III. WHAT´S NEXT? ... 25
IV. PURPOSES AND HYPOTHESES ... 26
V. STUDY I ... 28
A. Introduction ... 29
B. Methods ... 31
C. Results ... 40
D. Discussion ... 50
E. Conclusions ... 57
VI. STUDY II ... 61
A. Introduction ... 62
B. Methods ... 64
C. Results ... 70
D. Discussion ... 74
E. Conclusions ... 78
VII. STUDY III ... 81
A. Introduction ... 82
B. Methods ... 83
C. Results ... 88
D. Discussion ... 90
E. Conclusions ... 93
XIII
IX. General Conclusions ... 102
X. BIBLIOGRAPHY ... 109
XI. APPENDIX A: Abstract of at least 3000 words in an official language ... 128
XII. APPENDIX B: informed consent ... 128
XIV
ABBREVIATIONS½RRT half relaxation time RF rectus femoris
ANOVA analysis of variance RFD rate of force development
BP blood pressure RMT resting motor threshold
BRS baroreflex sensitvity RPP rate pressure product
CS cluster set RRI R-R interval
DBP diastolic blood pressure SBP systolic blood pressure
EMG electromyography SC set configuration
HF high frequency sec seconds
HR heart rate SICI short intracortical inhibition
ICF intracortical facilitation ST single twitch
LF low frequency TMS transcranial magnetic stimulation LFF low frequency fatigue TS traditional set
MAP mean arterial pressure TTF time to failure MEP motor evoked potential VA voluntary activation MVC maximal voluntary force wk week
reps repetitions
INDEX OF FIGURES
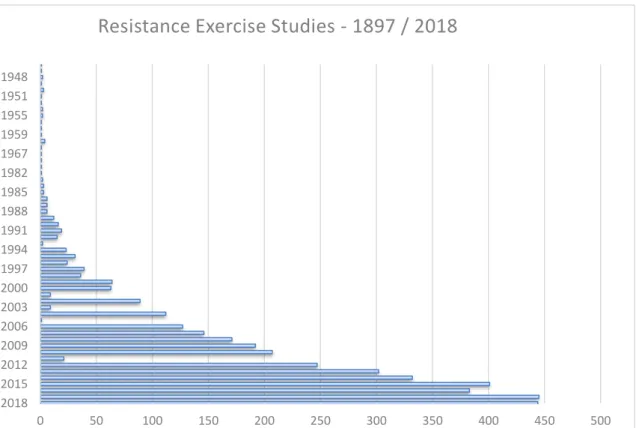
Figure 1. Evolution of Resistance Exercise studies from 1897 to 2018 ... 2
Figure 2. Representation of traditional and cluster set schemes... 4
Figure 3. Multifactorial perspective of fatigue. ... 16
Figure 4. Linear chain model of fatigue. ... 17
Figure 5. Variables confronted in computational model. ... 18
Figure 6. Steps involved in voluntary force production and motoneural factors ... 19
Figure 7. Schematic representation of the main spinal and supra-spinal mechanisms of regulation of motor neuron drive. ... 20
Figure 8. Likely effect of muscle fatigue on the input from different muscle receptor. 23 Figure 9. Summary of inputs to α- and γ-motoneurons for an agonist muscle ... 23
XV
STUDY I
Figure 11 Schematic representation of the experimental protocol.. ... 32
Figure 12 Changes in maximal voluntary contraction ,voluntary activation, single twitch, low frequency fatigue. ... 43
Figure 13 Changes in motor evoked potentials, intracortical facilitation, short intracortical inhibition ,maximal wave of rectus femoris ... 44
Figure 14. Cardiovascular Response to set configuration ... 46
Figure 15.. Central and peripheral perceptual responses to set configuration ... 48
Figure 16. Correlation between cardiovascular and central fatigue responses... 49
STUDY II Figure 17. Conditioned MEP amplitudes ... 70
Figure 18. Examples of single trials in one subject. Recordings from the RF ... 71
Figure 19. Effects of different FNS intensities on corticospinal excitability.... 72
Figure 20. Effects of different TMS intensities on corticospinal excitability. ... 73
Figure 21. Effects of two FNS pulses on the M wave ... 73
STUDY III Figure 22. Changes in maximal voluntary contraction, voluntary activation, single twitch, M-Wave Amplitude. ... 89
XVI
INDEX OF TABLESSTUDY I
Table 1. mean, SD and P values of the mechanical effects, central and peripheral fatigue
of each set configuration... 41
Table 2. mean, SD and P values of the mean cardiovascular response before, during and
after exercise ... 45
Table 3. mean, SD and P value of heart rate variability and baroreflex sensitivity before
and after exercise ... 48
STUDY II
Table 4. Absolute MEP values ... 70
INTRODUCTION
2
I. SET CONFIGURATION
Intensity and volume were the most well know variables of the sports training and
programming. These variables were used to increase, decrease or adjust the training load.
This vision corresponds to a traditional way to configuring training. When the goal is to
manage the fatigue of the athlete, trainers should be more specific designing their training
programs.
Between all modalities of training, resistance exercise was the most studied (see Fig 1)
since firsts works of Brunton (1897). The evolution of the knowledge in the 80´s
establishing the debate between “muscle training VS nerve training” (Stone et al., 1982)
to later explore the effects on the muscular adaptations (Fleck and Kraemer, 1988)
allowed to start the new millennium with the focus on the key variables of the strength
training to promote long-term adaptations such the intensity (Fry, 2004) and recently the
volume (Schoenfeld et al., 2018).
Figure 1. Evolution of Resistance Exercise studies from 1897 to 2018. Data extracted from MedLine (15 Oct)
INRODUCTION
3
In the last years one more variable comes to the light of the science: the set configuration.
Set configuration could be defined as “the effort-time distribution” (Haff et al., 2008,
2003; Tufano et al., 2017a). It is different from density or pause because it manages the
relationship between rest and work during resistance training (i.e. work-to-rest ratio)
(Hansen et al. 2011; Mayo et al. 2014). Since now, in this document will be named set
configuration (SC).
Traditionally, set configuration in resistance training was understood as a continuous way
of performing repetitions during the set. Then rest with a concrete time or pause and start
again. This way of configuring sets will be called Traditional set configuration (TS). This
set configuration provokes high and large states of fatigue (Bottaro et al., 2009;
Iglesias-Soler et al., 2015, 2012).
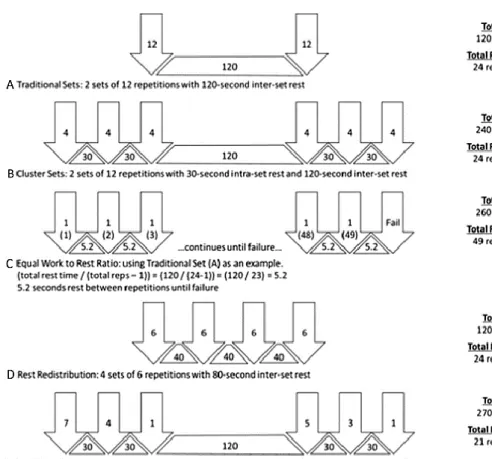
Trainers and researchers developed a new way of understanding the set configuration,
splitting the traditional sets in small clusters of repetitions. This was called intra-set rest
or cluster set (CS) training.
There are many ways to configuring the CS structure such performing repetitions by one,
two, three, etc. and then rest, or redistributing the total training time in order to equate the
INTRODUCTION
4
Figure 2. Representation of traditional (A) and cluster set schemes (B,C,D,E) Arrows indicate a number of repetitions performed in sequence, triangles indicate intraset or inter-repetition rest periods and quadrilateral shapes indicate interset rest periods. Reproduced from (Tufano et al., 2017a)..
A. Mechanical effects
The mechanical performance during the set is is of great importance to increase the
quality of the training stimulus. In the next section, a general vision of the mechanical
effects in response to the set configuration from speed and power to long term adaptations.
The differences between TS and CS structures were profoundly studied by authors like
(Tufano et al., 2017a). The initial studies explored the ability of the CS configuration to
provide high mechanic stimulus (Haff et al., 2003). Later, other works were designed to
explore the differences when the work-to-rest ratio was equated. This studies completed
the same work as the TS configuration with less fatigue (Iglesias-Soler et al., 2015; Mayo
INRODUCTION
5
Speed and Power
The speed and power of each repetition are performed are critical variables to increase
the quality of the training stimulus. Many studies compared the use of the cluster set
structure over high performance in sport. One of the first studies (Haff et al., 2003) about
SC in weightlifting performance explored the factors that affect barbell velocity and
displacement. In this investigation, it appears that configuring the set schemes of a
resistance training program with a cluster set model may produce specific alterations to
both performance parameters. These alterations to both the barbell velocity and
displacement may ultimately result in improved performance due to the relationship of
these variables to lifting performance. Based on the concept of velocity and movement
specificity it appears that the cluster set configuration allows the athlete to optimize the
pull velocity and displacement (Haff et al., 2003). A study with elite rugby players using
different cluster configurations on ballistic performance (i.e. jump squat) compared TS
and CS structures. Cluster sets showed an advantage in the power maintenance across the
set, but no differences were found between cluster variations (Hansen et al., 2011).
Power is fundamental to the successful performance of many athletic activities, and
therefore training methods that optimize the development of power are of great interest
to strength and conditioning coaches. Power output was studied in different CS
configuration in elite-junior athletes with different inter-repetition loading schemes.
Authors found that cluster structures are equally effective in providing an immediate
intervention strategy by which weight training repetition power output and total power
output can be enhanced. Authors like Lawton et al. (2006) have suggested that CS training
may result in superior power adaptation as compared to TS training. This type of loading
scheme may enhance neural adaptations resulting in maximal strength gains. It is less
INTRODUCTION
6
durations. Further, CS loading schemes have the potential to maintain the integrity of the
faster-type muscle fibers (Lawton et al., 2006).
Mechanical Work
In 2010 a study of Iglesias-Soler et al. explored the performance of the maximum number
of repetitions in the bench press and biceps curls exercises with two loads (70% and
90%RM) and two SC. The authors conclude that CS configuration would be an interesting
method to achieve a high upper-body work amount at high intensities in the same training
session (e.g., 90% RM). So assessment of the maximum number of repetitions and
training at high intensities with CS configuration could be interesting for sports with the
objective of high-load muscular endurance (Iglesias-Soler et al., 2010).
High-intensity volume and large muscle mass exercises are fundamental for trainers and
athletes. The study of Iglesias-Soler et al. (2014) compared the maximum number of
repetitions with high loads (90%RM) in the parallel squat exercise. The current study
showed that CT is useful to improve volume and to ensure sustainability of mechanical
stimuli when resistance exercises are performed with high loads. Tufano et al. (2016)
performed a similar experiment comparing high volume TS training versus two CS
configurations in free weight back squats. Their principal outcome was that the velocity
and power were maximized when intraset rest was most frequent and the total rest time
was greater.
As Iglesias-Soler et al. (2014) suggested, coaches should consider this type of set
configuration for developing high-intensity muscle endurance. This is of interest for
specialties such as weightlifting, wrestling, or judo. In a recent experiment
INRODUCTION
7
Press) with experienced lifters, heavy loads (4RM) but different intensity-effort (25% VS
50%, 1(4) VS 2(4) respectively), the authors explored the maximal volume of repetitions
reached in cluster scheme and its reliability. They confirmed initial findings of Iglesias et
al. (2014) about the very high volume of repetitions with high loads that CS configuration
allowed to perform in every participant and its ability to replicate the effort in a reliable
manner.
Strength Adaptations
The acute effects of CS configuration were compared with TS configuration in the
previous paragraphs revealing the enhanced mechanical stimuli provided by the former.
But, is it the improved mechanical stimuli the necessary condition to produce
improvements with CS? The influential work of Folland et al. in 2002 provided a solid
scientific argument to avoid the maximal fatigue in every training. In other words, it is
not necessary to exhaust all the repetitions in reserve to produce adaptations.
However, an early study of Rooney et al. (1994) on CS structure comparing two elbow
flexors training of 6RM 3 days a week during 6 weeks with 42 participants divided into
three groups: With 30 seconds rest between each rep, without rest and control. After the
training period, the no-rest group improved 56% respect to 41% of the rest-group (Rooney
et al., 1994). The authors make a point on the fact that a minimum amount of fatigue is
necessary on the neuromuscular system so that the adaptations are triggered.
Short-term studies in high performance (Hansen et al., 2011) in elite Rugby Union players
did not find differences in the maximal force development after 8 weeks but they did find
an improvement on speed and power with light to moderate loads in upper and lower limb
INTRODUCTION
8
power development. A midterm work with 19 sports participants in a 12 wk training
programme that included a final 3 wk power cycle revealed the efficiency of the CS
respect to TS training to induce adaptations in high-speed jumping movements
(Morales-Artacho et al., 2017). Another study (Asadi and Ramírez-Campillo, 2016) in college
athletes applying CS and TS to plyometric training methods improved lower body
maximal-intensity exercise performance but the TS method resulted in greater adaptations
in horizontal sprint performance, while the CS method resulted in a greater horizontal
jump, vertical jump and multidirectional movement (i.e. agility t-test) adaptations.
Lastly, to increase the effectiveness of resistance training, acute sessions should include
a minimum of systematic overload stimuli to promote adaptations due to increases in
systemic stress (Selye, 1952). When the work-to-rest ratio, volume and time under tension
is completely equated, the strength adaptations are similar as revealed the study of
Iglesias-Soler et al. (2016) after 5 wk of dynamic training of the knee extensors. Once
again, CS configuration showed as an alternative to do the same amount of work with
less effort. So it is plausible that the potential benefits that offer the cluster set
configurations in sports training were being underexploited. As Folland et al. (2002)
stated is not only not necessary to reach the maximum to generate adaptatións but also a
minimum threshold of effort to trigger the adaptation processes. And as the studies
revealed CS configuration could perform until even higher workload thresholds with less
or similar fatigue. In this line it has been pointed out (Tufano et al. 2017) that if decreases
in velocity due to fatigue are not of paramount importance, CS configurations could be
used to achieve superior loads for a given number of repetitions, resulting in higher total
INRODUCTION
9
B. Effects over the body systems
A general overview of the mechanical characteristics of the CS configuration was
provided in the last section. Rest intervals between training sets are one of the most
critical variables affecting both mechanical and metabolic acute effects of training. The
length of the intervals affects the total volume completed during a workout and also the
sustainability of repetitions along a training session (Iglesias-Soler et al., 2012). To
further understand the causes that elicited observed differences with the TS configuration
it is necessary to explore the underlying mechanisms that support the performance
enhancement and the ability of CS configuration to manage fatigue.
Metabolic and Endocrine Response
Lactate concentration [La+] is one of the byproduct outcomes of muscular contraction
(Tran et al., 2006). Continuous high-intensity muscular work demands higher implication
of glycolytic metabolism, and it has been demonstrated that an elevation in lactate is
concomitant with a reduction in mechanical performance. However, breaking the set in
small clusters of repetitions is supposed to inhibit the effects of metabolic accumulation
and substrate depletion (Haff et al., 2008; Izquierdo et al., 2006). It is also known that
elevated blood [La+] could affect muscular function by producing neural inhibition from
the stimulation of III and IV muscle afferents due to muscular acidosis (Gandevia, 2001).
A study has explored the metabolic response of high-intensity resistance (4RM) exercise
when the set is performed until muscular failure compared to not leading to failure with
the use of cluster sets (Iglesias-Soler et al., 2012). They found a blunted [La+] response
with the CS configuration confirming the initial hypothesis. Shorter periods of muscular
INTRODUCTION
10
(2006) showed that high intensity (6RM) CS configuration equated in volume offered an
advantage in diminished [La+] with no differences in mechanical performance. These
conflicting results could be related to the total number of repetitions. Authors speculated
that less vasoconstriction could result in less muscle hypoxia/anoxia, potentially
diminishing the previously observed fast to slow twitch fiber-type transformations in
resistance training.
The hormonal response is one of the steps to favor the anabolism and therefore the
muscular improvement via hypertrophy. A recent study (Tufano et al. 2017) explored the
effects of different CS schemes to induce a positive anabolic environment. They found
similar increases in growth hormone after exercise in each protocol with no change in
post-exercise cortisol levels showing that the mechanical stress provided during each of
the protocols most likely favored anabolism over catabolism (Tufano et al. 2017).
Cardiovascular Response
The cardiovascular impact of a modality of exercise is a measure of internal load (Foster
et al., 2017). The heart and lungs work together as a system to supply oxygenated blood
to the active muscles. Traditional RE could be an obstacle to the system normal function
because of the restricted periods of blood flow generated by the contraction of the active
muscles. In order to surpass the physical barrier, the cardiovascular system raise the
pressure to irrigate the distal musculature overcoming the ischaemic barrier. If prolonged
periods of work are added, then an elevated heart rate will be obtained resulting in a
high-stressful combination over the whole system. In other words, a high rate pressure product
would be obtained which reflects the total load over the cardiovascular system (Buchheit,
INRODUCTION
11
One of the first scientific works which compared the effects of set configuration on
cardiovascular responses during dynamic high-intensity resistance exercise with equated
volume, intensity and total resting time was the study of Iglesias-Soler et al. (2014). The
authors found that CS configuration elicited lower systolic blood pressure and rate
pressure product than TS configuration with a lower loss of velocity in each repetition.
Hence, faster contractions may promote lower periods of time under tension and,
consequently, shorter periods of restriction of the arterial flow. As Denton & Cronin
(2006) suggested, CS configuration resulted in lower vasoconstriction, accordingly, this
loading scheme may be more appropriate, and safer, for populations susceptible to high
blood pressure periods (i.e., hypertension).
Heart rate variability (HRV), the fluctuation of instantaneous heartbeat over time, is a
correlate of cardiac autonomic regulation (Heathers, 2014). Cardiac vagal control after a
resistance training session has been shown to be affected by load and volume. This is of
relevance since 30 min after exercise there is a decreased vagal activity which increases
the probability of suffering a sudden cardiac death (Mayo et al., 2016). For this reason,
this parameter takes importance in the resistance exercise prescription.
To that end, the works of Iglesias-Soler and cols explored the autonomic modulations
caused by SC. Their results showed a lower cardiac autonomic modulation after both
training regimes with TS and CS configuration (Iglesias-Soler et al., 2015), but the type
of exercise affected the cardiac vagal control after resistance exercise, with higher
reductions in a smith machine parallel squat in comparison with smith machine flat bench
press (Mayo et al., 2016). The authors stated that interactions between the type of exercise
and set configurations showed that the cardiac vagal control after resistance exercise is
post-INTRODUCTION
12
exercise hypotension, with lower values of blood pressure after the TS configuration
session but not after the CS configuration (i.e. lower pressor response).
Perceived Exertion
The perception of effort is the conscious sensation of how hard, heavy, and strenuous a
physical task is (DeMorree et al., 2012). Changes in metabolic, hormonal or
neuromuscular parameters due to different SC loading schemes could be tracked by a
perceived effort scale. It estimates the extent of effort, strain, discomfort, and fatigue that
an individual feels while exercising (Mayo et al., 2017).
The study of Hardee et al. (2012) explored the perception of effort with different SC
during three sets of a power clean weightlifting exercise. They observed a direct inverse
relationship between RPE and power output. Authors concluded that RPE might be a
good indication as to the level of fatigue induced by resistance exercise but not
necessarily the intensity. Mayo et al. (2014) compared the RPE as well as power in two
exercises differing in muscle mass and SC. The findings were that a TS configuration
session leads to higher RPE and lower power compared with the CS. Moreover,
differences between exercises showed greater RPEs for the squat than in the bench press,
suggesting that muscle mass may cause differences in the RPE response. Thus, RPE might
be used as an intrinsic regulator of muscular fatigue with regards to power training.
Peripheral and Central adaptations
The physiological modifications induced by strength training have been widely explored,
and it has been suggested that the resultant outcomes can be attributed to peripheral and
INRODUCTION
13
approach used to distinct neural versus muscular tissue adaptations is the examination of
the relationship between electromyographic (EMG) activity and voluntary force output
(e.g. maximal voluntary contraction).
During the progress of this dissertation, parallel studies (Iglesias-Soler et al., 2016) about
set configuration long-term effects were performed with some of the techniques (i.e.
twitch interpolation, TMS, etc.) and methodologies that distinguish the present research
work about the central and peripheral adaptations. Its main outcomes are discussed below.
The peripheral adaptations were evaluated by M-wave and its related evoked contractile
properties. The M-wave represents the synchronous activation of the entire pool of
motoneuron units, and its modulation has been related to changes in membrane ionic
activity (Rodriguez-Falces et al., 2013; Yochum et al., 2012). The results of this study
(Iglesias-Soler et al., 2016) showed greater M-wave amplitudes after the training period
specially for TS configuration suggesting an enhancement in membrane excitability.
However, this improvement did not affect the maximal voluntary force, which was
comparable between SC after the training period.
The mechanical evoked twitch properties associated with the M-wave (e.g. evoked force,
RFD, RRT…) improved both in TS and CS configurations. Those changes are attributed
to muscular mechanisms such as modifications in passive stiffness of the series of elastic
component and excitation-contraction coupling process (Folland and Williams, 2007).
The calcium kinetics (release and uptake) and ATPase activity would also be responsible
for this enhancement varying the twitch contractile properties (Rodriguez-Falces and
Place, 2017).
Musculature receives a neural triggering signal from the pool of innervating motor
INTRODUCTION
14
neurons spiking activities, and it is called the neural drive to the muscle. This neural drive
is produced by the transformation of the synaptic input to the motor neurons into output
spike trains to the muscle to achieve or maintain a given level of force (Farina et al., 2014;
Proske and Gandevia, 2012). It could be assessed by electromyography (EMG),
mechanical records and transcranial magnetic stimulation (TMS). Analysis of the raw
EMG signal with the root mean square normalized to M-wave, to remove the muscle
membrane properties, reflects a central neural drive to muscles. Also, the voluntary
activation (VA) represents the level of motor neuron drive during a maximal voluntary
contraction (MVC) values lower than 100% could represent suboptimal firing incomplete
recruitment (Goodall et al., 2009) . In this SC training study, the authors did not find
neural changes (RMS and VA) related to set configuration after training.
TMS is used to activate neurons in the human cerebral cortex through the scalp without
any pain. It has has been used to study neural transmission from the motor cortex to the
muscles. An index of the entire corticospinal pathway responsiveness, from the brain to
muscle, can be obtained from the size of the compound muscle action potentials recorded
at the muscle via electromyography (Carroll et al., 2011). In this study, no changes in
TMS parámeters (MEP, SICI, ICF) were found. This is in agreement with previous
studies that suggest more extended periods of training to produce cortical adaptations.
Although, it is likely that the precision required to detect subtle cortical modulations
produced by resistance training may be not assured with resting motor-evoked potentials
INRODUCTION
15
C. Synthesis and perspectives
The variables studied up to now are related to the fatigue response of each one of the
systems of the organism to the configuration of the series. Many variables continue
unexplored and its necessary to know more about the response of the rest of the systems
to have a multifactorial view of the fatigue processes.
To summarize, the cluster set configuration:
• Reduces the loss of velocity throughout the set.
• Allows to complete the same amount of work with less perception of
fatigue.
• Blunts the cardiovascular and metabolic response.
• Stands as a safer alternative to the traditional resistance training
configuration risky populations (hypertensión, coronary disease, etc.)
• Has a superior effect in the fast movements in long-term training.
• Has similar effects on central and peripheral adaptations as the TS
configuration in the short term (5wk).
To explore the relationships of these variables in the context of resistance exercise is of
interest when the available evidence is divided into unilateral approaches. Hence, the
study of the possible relationship between the mechanical, cardiovascular and perceptual
variables in the fatigue response could offer a complete vision of the processes that might
INTRODUCTION
16
II. MUSCULAR FATIGUE CAUSED BY RESISTANCE EXERCISE
Fatigue is a multifactorial process that could arise from central or peripheral systems.
There are multiple ways that fatigue has to manifest. Fatigue is commonly defined as any
reduction in the maximal capacity to generate force (Vøllestad, 1997). Although most
definitions of fatigue focus on force production, fatigue not only impedes a fiber’s
capacity for maximal force generation but importantly the maximum speed of shortening
or lengthening and consequently, power output will also to be affected (Gandevia, 2001;
Gandevia et al., 1996). In the next lines, a review on all the process that underlies the
fatigue response will be exposed. Although it might be almost impossible to identify the
single most important limiting factor of fatigue, this should not deter scientist and
clinicians from attempting to resolve many of the issues which confound this concept.
A. Fatigue Models
Whether it will be ever possible to identify the limiting cause of fatigue during a task is
debatable. What is clear is that fatigue comprises a spectrum of events for which there is
no single causative factor, with many factors occupying potential roles in its etiology (see
Fig 3). These factors make fatigue such a complex and controversial concept. (Williams
and Ratel, 2009).The interaction
between the status of the individual,
the type of task and where the fatigue
develops is the principal factor to
understand the fatigue response. The
rest of the variables related to the latter
would be a direct consequence of this
three-dimensional interaction. It
exemplifies the relationships between
INRODUCTION
17
the energy exchange, the central or peripheral fatigue and the reduction in the
force-generating capabilities of the actin and myosin cross-bridges.
It is possible to simplify the dozens of
possible combinations if the vision of
the fatigue is limited to a classic
catastrophe theory model as Edwards
proposed in 1983 named Command
chain for muscular contraction in man
(Gibson and Edwards, 1985). This
model posits that exercise terminates
when the physiological and
biochemical limits of the body are
exceeded, causing a catastrophic failure
of intracellular homeostasis. This
proposal accounts for the changing
scenario of losses of energy and
excitation/activation losses on force
production. It provides a theoretical
mapping of what is likely occurring
when there is a decline in force or
power output.
However, other models were proposed in order to advance in the knowledge of an
integratory relationship of the body systems. Noakes in 2005 proposed the Central
Governor Model where the definition of fatigue changed to a sensation that results from Figure 4. Linear chain model of fatigue. (Williams and Ratel,
INTRODUCTION
18
the conscious perception and interpretation of subconscious regulatory processes in the
brain, and is therefore not the expression of a physical event. (Noakes et al., 2005).
This central governor model is an example of a complex dynamic system in which
multiple physiological processes in many different systems interact with each other
continuously. As a result, changes in any physiological variable results from alterations
in neural command or peripheral regulatory systems in response to prior system
perturbation. The continuous interaction between feed forward and feedback control
mechanisms in the brain and peripheral physiological systems produces a robust, self
sustaining mechanism that maintains homoeostasis by ensuring that no system is ever
overwhelmed or used to absolute maximal capacity (Noakes et al., 2005)
Modern computational advances were applied to
create a computational model of exercise fatigue
based on know true correlations developed four
possible models (Pereira et al., 2015). Authors
explained the main limiting factors depending on the
task nature, intensity. They proposed a complex
network model (Fig 5) where nodes are
measurements of changes in body systems at the
mechanical (blue) and physiological (red) related
levels and IPAQ score (red) during four different
intensities of exercise tests. (Pereira et al., 2015)
Regardless of the model, the primary mission when studying the fatigue response to a
type of exercise, intensity or load parameter is the relationship between neuromuscular
INRODUCTION
19
factors (e.g. neural drive), cardiovascular, metabolic and all sensorial and regulatory
mechanisms (muscular afferents, baroreflexes…).
B. Central Fatigue
Some terms should be clarified to correctly understand the factors that underlie the fatigue
response at the nervous system. Central fatigue is a progressive reduction in voluntary
activation of muscle during exercise (Gandevia, 2001). The Supraspinal fatigue, a subset
of the latter, could be present when a failure to generate output from the motor cortex is
observed. This is of relevance if we use the Voluntary Activation to measure the central
fatigue which is the level of voluntary drive during an effort. Unless specified, the concept
does not differentiate between the neural discharge to the motoneurons and that to the
muscle. Voluntary activation can be measured using electrophysiological techniques as
the twitch interpolation during a maximal voluntary contraction.
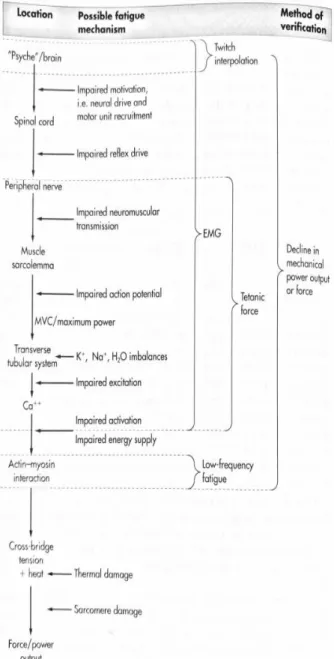
Central fatigue can originate at spinal and
supraspinal sites. Spinal regulation primarily
involves the control of alpha and gamma motor
neuron activity by some different mechanisms
as we see in Fig. 6. Briefly, spinal motor
neurons have an intrinsic property to reduce
their natural discharge frequency over time that
is regulated by muscle afferents (muscle
spindles, Golgi tendon organs, small diameter
fibers), spinal interneurons and presynaptic inhibition of afferent inputs from
propriospinal and other supraspinal sites (Fig 7) (Ranieri and Di Lazzaro, 2012).
INTRODUCTION
20
Figure 7. Schematic representation of the main spinal and supra-spinal mechanisms of regulation of motor neuron drive. M1: primary motor cortex; P: pyramidal corticospinal cell; αMN: alpha motor neuron; γMN: gamma motor neuron; GT: Golgi tendon organs; SP: muscle spindles. (Ranieri and Di Lazzaro, 2012).
Supraspinal regulation relies not only on the activity of primary motor cortex but also on
the function of the brain structures involved in planning and control of movement and on
the feedback information.
DeMorree et al. (2012) find promising relating the cortical motor activity and the
subjective perception of the participants. They stated that perception of effort is the
conscious awareness of the central motor command sent to the active muscles. The
gradual increase in effort as fatigue supervenes derives from the increased central
command needed to recruit more motoneurons, to increase their rate of discharge in
initially submaximal tasks, and to attempt to maintain their output in maximal ones.
Motoneuronal properties request that if a motoneuron is transiently unrecruited during a
fatiguing effort, a relatively more considerable input will be required to recruit it again
INRODUCTION
21
C. Peripheral fatigue
The physiological changes produced at or distal to the neuromuscular junction are
considered peripheral fatigue. In the next section, a general vision of the metabolic
processes within the muscle fiber and the motor plate will be reviewed.
Muscular metabolic changes
Acute skeletal muscle fatigue develops in situations with high energy demand and large
dependency on anaerobic metabolism. The mechanisms of fatigue when muscles are
contracting at high workloads promotes the consumption of muscular stores of energy
and the products of these reactions start to accumulate. Muscular tissues become acid
because glycogen is broken down anaerobically to lactic acid; inorganic phosphate ions
(Pi) accumulates because phosphocreatine (PCr) is broken down to creatine (Cr) and Pi
(Allen and Westerblad, 2001). When fatigued, muscles become weaker and slower, and
two end products of anaerobic metabolism, H+ and inorganic Pi, have received the utmost
attention as causes of the impaired contractility in fatigue. Acidosis may decrease
isometric force by reducing the myofibrillar Ca2+ sensitivity, which will have a large
effect on the submaximal forces used during most types of exercise (Westerblad, 2016).
Furthermore, there are several other metabolic changes during fatigue. There is cellular
mechanisms of force control that includes: (i) the Ca2+ concentration surrounding the
myofilaments, (ii) the sensitivity of the myofilaments to Ca2+, and (iii) the force produced
by the crossbridges characterized by the maximum Ca2+-activated force (Allen and
Westerblad, 2001). Hence, at the cellular level, fatigue is generally thought to be produced
by the cumulative consequences of multiple metabolite changes acting throughout these
three mechanisms. Failure of sarcoplasmic reticulum (SR) Ca2+ release has been shown
INTRODUCTION
22
hypothesis that precipitation of calcium phosphate in the SR contributes to the failure of
SR Ca2+ release (Allen and Westerblad, 2001). This mechanism may be central in
high-intensity actions which lead to fatigue in the short-term (1-2 min), but other mechanisms
are possibly more important in lesser intensity activities which cause fatigue in >1 h.
In summary, H+ and P
i contribute to fatigue, primarily both by their inhibitory effects on
the cross-bridge and by reducing the sensitivity of the myofilaments to Ca2+. Indeed, it is
now clear that elevations in H+ and Pi are the major contributors to the loss in force and
velocity when are studied in skinned muscle fibers works demonstrating that the
metabolic by-products directly inhibit the force and the motion-generating capacity of
muscle during fatigue (Debold et al., 2016). However, experimental evidence from
human muscle studied in situ and isolated intact muscle fibers clearly speak against
acidosis as a central factor underlying the impaired contractile function in fatigued
mammalian muscle (Westerblad, 2016). To sum up, acidosis as such has only minor direct
effects on the contractile function of mammalian muscle studied at physiological
INRODUCTION
23
D. Sensory and afferent integration:
From brain to muscles and back again
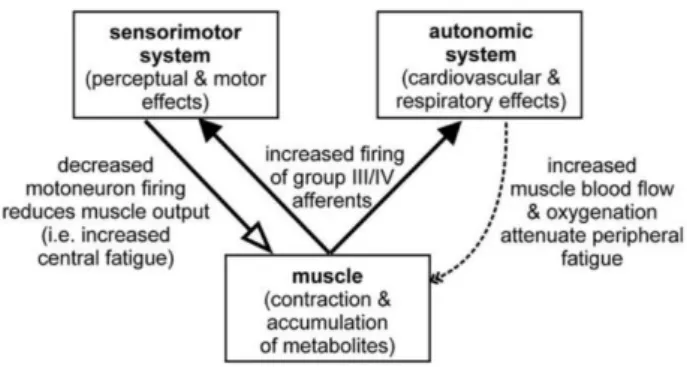
Contraction-induced mechanical and chemical stimuli activate molecular receptors on the
terminal end of both thinly myelinated (group III) and unmyelinated (group IV) nerve
fibers located within skeletal muscle (Sidhu et al., 2017). Muscular Group III and IV
afferents innervate free nerve endings distributed widely throughout the muscle. These
receptors are either silent or maintain low background discharge rates responding to local
mechanical, biochemical, and thermal
events. Several factors cause their
discharge to increase during strong
contractions and fatigue, mainly if the
contraction intensity is sufficient to
impair muscle perfusion which also
depends on the specific exercise being
performed (see Fig 8).
Through the dorsal horn of the spinal cord these
neural sensory receptors project directly, and/or
indirectly, to various sites within the central
nervous system including areas which have
been linked with central fatigue (e.g.
a-motoneurons, motor cortex, insular or cingulate
cortex) (Amann et al., 2015; Sidhu et al., 2017).
During muscle fatigue, these muscle afferents
Figure 8. Likely effect of muscle fatigue on the input from different classes of muscle receptor. Data are shown for background discharge rate, responses to a muscle contraction, responses to muscle stretch, and responses to muscle ischemia maintained after a contraction (Gandevia, 2001).
INTRODUCTION
24
provide strong feedback restricting motoneuronal output and muscle activation by
limiting voluntary descending drive from ‘upstream’ of the motor cortex and depressing
the excitability of the corticospinal pathway including the motor cortex and spinal
motoneurons (see Fig 9). This sensory signal of fatigue from the firing of group III/IV
muscle afferents interacts with the autonomic nervous system, as well as with various
levels of the motor system and also contributes to awareness of muscular discomfort and
fatigue (Taylor et al., 2016). Hence, the modifications in the sensory, neuromuscular, and
homeostatic systems contribute all to exercise fatigue. The combination of influences on
exercise performance will depend on the task and the conditions and under which it is
performed. To sum up, group III/IV muscle afferents feedback during fatiguing exercise
directly or indirectly impair the spinal motoneurons output (Fig 10), which can
compromise voluntary muscle activation
and, subsequently, exercise performance.
The primary somatosensory cortex (S1) and
primary motor cortex (M1) are commonly
considered to be functionally segregated
regions with S1 processing sensory input
and M1 encoding motor output (Dubbioso et al., 2017a). Influential concepts of
sensorimotor integration underline an active influence of cortical sensory input on motor
output and vice versa. Somatosensory inputs notify both, reflexive and volitional actions
(Dubbioso et al., 2017a; Ward et al., 2015). This comprises bodily feedback generated by
the movement itself and somatosensory input signaling the consequence of a movement,
for instance, the haptic experience when manipulating an object. Conversely, motor
output impacts on perception. The relationships between sensorial and motor integration
are of interest in order to adjust the motor output due to afferent information.
Figure 10. Group III/IV function and sensory modulation
INRODUCTION
25
III. WHAT´S NEXT?
A comprehensive overview of the set configuration and fatigue responses was provided
in the past chapters. Different studies have shown the effects of SC in the neuromuscular,
cardiovascular, endocrine and perceptual responses. A complete vision of each system
has been provided separately. In brief, the cluster set configuration provided a lower
fatigue response with an enhanced mechanical performance.
Taken together the mechanical, cardiovascular, metabolic and perceptual responses offers
a vision of the processes that the set configuration could be affecting. Thus, it is of great
interest to explore whether these variables are related to the same proportion in the fatigue
response. Regardless of the fatigue model, the primary mission when studying the fatigue
response to a type of exercise, intensity or load parameter is the relationship between
neuromuscular factors (e.g. neural drive), cardiovascular, metabolic and all sensorial and
regulatory mechanisms (muscular afferents, baroreflexes).
Therefore, the primary purpose of this thesis was to explore the differences between the
traditional and the cluster set configuration in the neuromuscular, cardiovascular,
perception and sensorimotor systems and in a second order to find relationships between
the fatigue manifestations in each system.
Thus, three experiments were performed in order to search for the answers to these aims.
In the first study the differences due to set configuration were explored. In the second a
methodological study was developed to establish the properties of the sesorimotor
integration in the lower limb. Finally in the third experiment aimed to contrast the results
of the former adding the sensorimotor variables in order to check if the set configuration
PURPOSES AND HYPOTHESES
IV. PURPOSES AND HYPOTHESES
Study I. Set configuration in resistance exercise: muscle fatigue and cardiovascular effects.
Purpose
To investigate differences in the neurophysiological, mechanical and cardiovascular acute
responses of TS and CS configurations matched for volume, intensity, and work-to-rest
ratio.
Hypothesis
The levels of muscle fatigue induced by different resistance set configurations account
for the differences in the cardiovascular response.
Study II. Modulation of quadriceps motor cortex excitability by femoral nerve stimulation.
Purpose
To explore the conditioning effect of a percutaneous electrical pulse of the femoral nerve
on cortical motor evoked responses in the rectus femoris muscle.
Hypothesis
An electrical pulse on the femoral nerve is able to modulate the cortical response of the
rectus femoris muscle demonstrating that the sensorimotor integration processes are
PURPOSES AND HYPOTHESES
27
Study III. Sensorimotor integration is affected by set configuration.
Purpose
To describe the effects of the lower limb modulation during two equated training
configurations in the rectus femoris muscle.
Hypothesis
The sensorimotor integration is affected by the amount of fatigue caused by different
V.
STUDY I
Set configuration in resistance exercise:
muscle fatigue and cardiovascular effects
Dan Río-Rodríguez1
Eliseo Iglesias-Soler2
Miguel Fernández del Olmo1
PloS one, 11(3), p.e0151163.
Received: November 26, 2015;
Accepted: February 24, 2016;
Published: March 16, 2016
1 Learning and Human Movement Control Group, Department of Physical Education and Sport Faculty of Sports Sciences and
Physical Education, University of A Coruna, A Coruna, Spain
2 Performance and Health Group, Department of Physical Education and Sport. Faculty of Sports Sciences and Physical Education,
University of A Coruna, A Coruna, Spain
STUDY I: Set configuration in resistance exercise: muscle fatigue and cardiovascular effects
29
A. Introduction
Abbreviations
½RRT half relaxation time MEP motor evoked potential
ANOVA analysis of variance RF rectus femoris
BP blood pressure RFD rate of force development
BRS baroreflex sensitvity RMT resting motor threshold
CS cluster set RPP rate pressure product
DBP diastolic blood pressure RRI R-R interval
EMG electromyography SBP systolic blood pressure
HF high frequency SICI short intracortical inhibition
HR heart rate ST single twitch
ICF intracortical facilitation TMS transcranial magnetic stimulation
LF low frequency TS traditional set
LFF low frequency fatigue TTF time to failure
MAP mean arterial pressure VA voluntary activation
MVC maximal voluntary force
Cardiovascular modulation and its association with resistance exercise have been the
focus of extensive research(Mitchell, 2013). The blood pressure (BP) and heart rate (HR)
responses to resistance training are thought to be modulated by peripheral and central
mechanisms (McCartney, 1999; Mitchell, 2013). The role of these mechanisms may be
mediated by the configuration features (i.e. volume, intensity, number of repetitions/set,
rests between sets) of the resistance training, although this relationship has not been
studied extensively. Traditional set configuration (TS) is the most common procedure of
resistance training and consists of performing each repetition of a set without rest until
failure (Izquierdo et al., 2006). This configuration induces fatigue and discomfort (Hardee
et al., 2012). In addition, BP and HR rises proportionally with successive repetitions
within a set (McCartney, 1999), and the rate at which BP increases is related with both
STUDY I: Set configuration in resistance exercise: muscle fatigue and cardiovascular effects
30
A novel approach to the set configuration is the cluster set (CS), which introduces pauses
between single or small groups of repetitions (i.e cluster training). Thus, the perceived
effort is reduced while the performance is maintained (Hardee et al., 2012). This type of
intermittent resistance training reduces the BP response during dynamic (Baum et al.,
2003) and isometric exercise (Heffernan et al., 2008) in comparison with TS
configuration. The differential modulation of the BP in response to TS and CS may be
due to the differences in the work-to-rest ratios (i.e. effort vs. resting time) between the
configurations. However, a previous study has shown that the lower BP response during
CS in comparison with TS remained even when the work-to-rest ratios are equated for
both configurations (Iglesias-Soler et al., 2015), suggesting that other factors underlie
these differences. We proposed that CS induces lower levels of muscle fatigue, compared
with TS, since this configuration is associated with improved mechanical performance
(Iglesias-Soler et al., 2012) and less perceived effort (Hardee et al., 2012; Iglesias-Soler
et al., 2015; Mayo et al., 2014). Moreover, peripheral and central fatigue may play
differential roles in each configuration. Peripheral fatigue reflects an impairment at, or
distal to the neuromuscular junction, and can be evaluated by recording the twitch force
that is induced by peripheral nerve stimulation while the muscle is at rest (Enoka and
Stuart, 1992). Central fatigue indicates a failure to drive the motor neurons adequately
(Gandevia, 2001), and can be tested by recording the force evoked by nerve stimulation
during a maximal voluntary effort (Merton, 1954). In addition, muscle fatigue can be
associated with changes that are elicited by transcranial magnetic stimulation (TMS), in
the motor evoked potential (MEP) (Maruyama et al., 2006), short intracortical inhibition
(SICI) (Maruyama et al., 2006) and intracortical facilitation (ICF) (Bäumer et al., 2002;
Tergau et al., 2000), although these changes may be difficult to interpret (Gruet et al.,
STUDY I: Set configuration in resistance exercise: muscle fatigue and cardiovascular effects
31
There are no studies to date that have investigated central and peripheral fatigue induced
by TS and CS configurations, with an equal work-to-rest ratio, and their relationship with
cardiovascular changes. Thus, the aim of this study was to investigate differences in the
neurophysiological, mechanical and cardiovascular acute responses of TS and CS
configurations matched for volume, intensity and work-to-rest ratio. This will allow us to
test the hypothesis that the levels of muscle fatigue induced by different resistance
exercise configurations account for the differences in their cardiovascular response. This
will provide further insight into the mechanisms underlying the cardiovascular
modulation in response to changes in the resistance set configuration.
B. Methods
Subjects
Eleven young males participated in this study (age 21.0 ± 2, height 177.2 ± 0.08 cm,
weight 72.4 ± 6.6 kg). The subjects were recruited from the Institute of Physical
Education and Sport of A Coruña, Spain. All the subjects were physically active and none
of them reported neurological impairment, lower limb injuries and/or contraindications
to TMS. Written informed consent was obtained from all the subjects after a full
explanation of the procedures and risks involved All the experimental procedures were
approved by University of A Coruña ethics committee and conformed to the Declaration
of Helsinki.
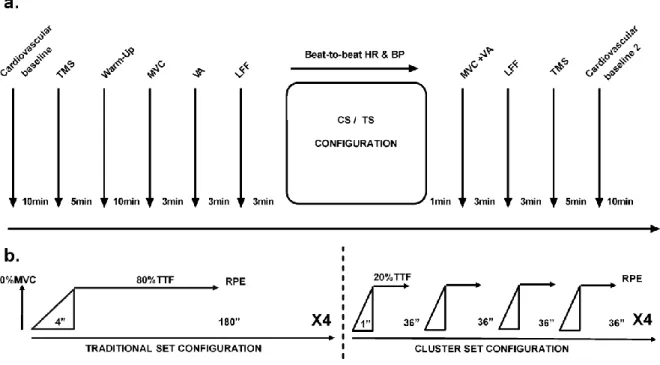
Experimental Procedure
Each subject participated in five familiarization and three experimental sessions. The
protocol is described in Fig 11. The familiarization sessions were used to train the subjects
with the maximal voluntary contractions, electrical and magnetic stimulations and with
STUDY I: Set configuration in resistance exercise: muscle fatigue and cardiovascular effects
32
calculate the maximal voluntary isometric contraction (MVC) during a knee extension
exercise and the time to task failure (TTF) at a 50% of MVC. The other two experimental
sessions correspond to two resistance-training sessions: with a traditional set
configuration (TS) or with cluster set configuration (CS). The order of TS and CS sessions
were counterbalanced, separated by 1 week and conducted at the same time of day for
each subject. Each training session started with hemodynamic recordings and cortical
measurements (using transcranial magnetic stimulation of the motor cortex) with the
subject at rest. Then, after a standardized warm-up the subjects performed dynamic and
neuromuscular assessments (maximal voluntary contractions and electrical stimulation,
respectively). The subjects then started the exercising procedure (with TS or CS
configuration) during which cardiovascular parameters were continuously recorded.
Immediately after the exercise, dynamic and neuromuscular assessments were recorded,
and the rate of perceived effort was reported by the subjects. Ten minutes later, cortical
and cardiovascular recordings were obtained.
STUDY I: Set configuration in resistance exercise: muscle fatigue and cardiovascular effects
33
Maximal voluntary contraction
Subjects were seated in a modified knee extension machine (BF100, Biotech Bioiso,
Brazil) attached to a force cell (sensitivity: 2 mV/V and 0.0028 V/N; NL63-200,
Digitimer Ltd, Welwyn Garden City, UK) with the hips flexed at 90º and the right knee
flexed at 90º and firmly strapped to the lever arm of the machine. To ensure that
participants only used the knee extensors special care was taken positioning the lever arm
above the ankle, and a belt was used to avoid hip and trunk movement. Participants were
asked to perform an MVC “as fast and as forcefully as possible” and to maintain it for 4
seconds (Aagaard et al., 2002). We followed the recommendations of Gandevia
(Gandevia, 2001) for a reliable MVC measurement: (i) feedback of performance was
given during all the voluntary contractions (visual display), (ii) appropriate standardized
verbal encouragement was given by the investigators, (iii) subjects were allowed to reject
efforts that they did not regard as ‘‘maximal’ and attempted another trial 3 minutes later.
EMG recordings
Electromyographic (EMG) signals were recorded using bipolar self-adhesive Ag/AgCl
electrodes of 10-mm diameter (F9079P, FIAB, Vicchio, Italy) in bipolar configuration of
the rectus femoris (RF) and biceps femoris following the SENIAM recommendations
(Hermens et al., 2000), with an inter-electrode distance of 25 mm and with the reference
electrode on the patella. The position of the electrodes was marked on the skin so that
these were used in the subsequent session. The recording sites were shaved, abraded and
cleaned with isopropyl alcohol to obtain low impedance (Z, 5kΩ). EMG signals were
amplified and filtered with a bandwidth frequency ranging from 10 Hz to 1 kHz (gain =
1,000). The EMG signals were simultaneously digitized with the torque signals, using an
STUDY I: Set configuration in resistance exercise: muscle fatigue and cardiovascular effects
34
Garden City, UK) and stored for later analysis on a computer with a custom built Signal
script.
Force and EMG signals were synchronized using a Power 1401 A-D converter and Signal
software [Cambridge Electronics Design (CED), Cambridge, UK].
Electrical stimulation
M wave. Electrical stimulation was used to activate the femoral nerve. A ball probe
cathode was manually pressed over the femoral triangle 3-5cm below the inguinal
ligament. The anode, a 130×80mm self-adhesive electrode (Cefar-Compex Scandinavia
AB, Sweden), was applied to the gluteal fold. Square-wave pulses with a width of 1 ms
at a maximal voltage of 400 V from a constant current stimulator (Digitimer DS7A,
Welwyn Garden City, UK) were delivered to the resting muscle. The optimal stimulation
intensity for a single stimulus was determined by increasing the intensity until the
amplitude of the evoked twitch showed no further increase (Mmax). The intensity used for
subsequent stimulation techniques was 120% of that which evoked a maximal twitch
torque with subsequent Mmax of the RF (140–240 mA).
Low Frequency Fatigue. Two electrical stimuli at 100-Hz (Db100) and 10-Hz (Db10)
were delivered 4 s apart over the femoral nerve two seconds after an MVC of the knee
extensors (Millet et al., 2011).
Twitch interpolation. Twitch interpolation technique (Merton, 1954) was applied to the
knee extensors. During an MVC, a superimposing supramaximal electrical stimulus was
delivered to the femoral nerve, followed by a second electrical stimulus 1.5 s after the end
of the MVC.