Genetic characterization of japanese plum cultivars (prunus salicina) using SSR and ISSR molecular markers = Caracterización genética de cultivares de ciruelo japonés (prunus salicina) mediante marcadores moleculares SSR y ISSR
12
0
0
Texto completo
(2) 534. ciencia e investigación agraria. include P. salicina and several interspecific hybrids obtained by crossing with other plum species or with certain apricot cultivars. Chile is the greatest exporter of fresh plums in the world. Although 30 Japanese plum cultivars are important to Chile’s exportation industry, 80% of the country’s commercial production is based upon only eight cultivars (“Angeleno,” “Black Amber,” “Friar,” “Fortune,” “Larry Ann,” “Red Heart,” “Autumn Pride” and “Roysum”), most of which were developed in private fruit breeding programs in California, USA. During recent years, an effort has been made to develop new cultivars adapted to Chilean requirements. The ability to manage the genetic variability and the relationships among cultivars is crucial for making decisions about the preservation of germplasm collections and the selection of parental lines for long-term breeding programs. One method for identifying and describing plum cultivars is to use a large number of detailed morphological and phenological descriptors (UPOV, 1982). However, the influence of environmental factors and growing conditions on the expression of the descriptors is a major restriction of this methodology. Another option is using DNA markers that are not affected by environmental conditions. These markers allow for the investigation of genetic diversity and relatedness among individuals. DNA profiles based on polymorphic band patterns, such as RAPD (Ortiz et al., 1997; Shimada et al., 1999) and AFLP (Goulao et al., 2001), have been used to analyze the genetic variability of Japanese plum cultivars. Recently, Mnejja et al. (2004) isolated in P. salicina 27 Simple Sequence Repeat (SSR) markers that are potentially useful for carrying out genetic studies. SSR markers are codominant and highly polymorphic markers and have proven very useful in studies of the genus Prunus (Cheng and Huang, 2009; Aranzana et al., 2003; 2010). Additionally, since 1994, a new molecular marker technique called Inter Simple Sequence Repeat (ISSR) analysis has. been available (Zietkiewicz et al., 1994). ISSRs are semi-arbitrary markers amplified by PCR in the presence of one primer complementary to a target microsatellite. The resulting banding patterns have a dominant inheritance pattern and are highly reproducible, fast and technically simple to handle. ISSRs have been used to analyze the genetic relatedness of almond (Martins et al., 2003) and plum (Goulao et al., 2001) cultivars. The purpose of this investigation was to study the level and organization of the genetic diversity and relatedness among 29 plum cultivars using ISSR and SSR makers.. Materials and methods Plant materials Young leaves were collected from 29 plum cultivars (P. salicina and interspecific hybrids), two European plum cultivars (P. domestica), one wild plum (P. ceracifera) and one apricot cultivar (P. armeniaca). Additional information is provided in Table 1. The plant material used in this study was obtained from the cultivar garden used in the Stone Fruit Breeding Program. This orchard is maintained in the Experimental Station of Pontificia Universidad Católica de Chile, located in Pirque, Chile (33º38’5.1’’S; 70º 34’ 24.2’’W).. DNA extraction Total DNA was extracted from young leaves (0.5 g) and collected according to a method described by Doyle and Doyle (1990). Leaves were ground in liquid nitrogen, and DNA was extracted with a cetyltrimethylammonium bromide (CTAB) hot extraction buffer [50 mM Tris-HCl, pH 8.0; 1.4 M NaCl; 20 mM EDTA; 2% (w/v) CTAB; and 1% (v/v) β-mercaptoethanol]. The mixture was incubated at 60º C for 30 min, and two extractions were then performed with chloroform/ isoamyl alcohol (24:1). Isopropanol was used to.
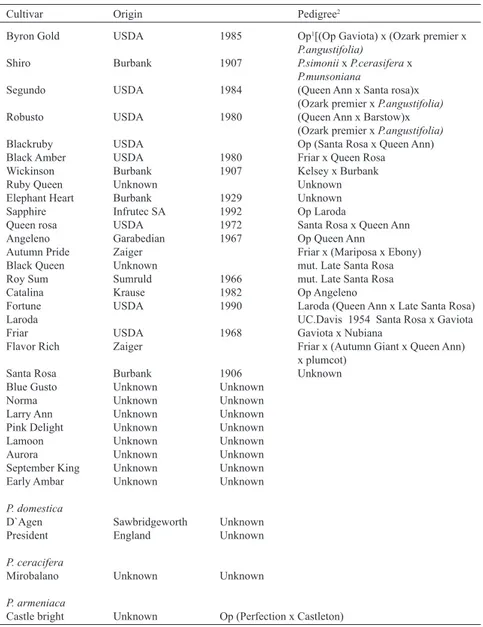
(3) VOLUME 39 Nº3 SEPTEMBER – DECEMBER 2012. 535. Table 1. Cultivars, origins and pedigrees of 29 cultivars and an interspecific hybrid of Japanese plum as well as cultivars of Prunus domestica, P. ceracifera and P. armeniaca. Cultivar. Origin . Pedigree2. Byron Gold USDA 1985 Op1[(Op Gaviota) x (Ozark premier x P.angustifolia) Shiro Burbank 1907 P.simonii x P.cerasifera x P.munsoniana Segundo USDA 1984 (Queen Ann x Santa rosa)x (Ozark premier x P.angustifolia) Robusto USDA 1980 (Queen Ann x Barstow)x (Ozark premier x P.angustifolia) Blackruby USDA Op (Santa Rosa x Queen Ann) Black Amber USDA 1980 Friar x Queen Rosa Wickinson Burbank 1907 Kelsey x Burbank Ruby Queen Unknown Unknown Elephant Heart Burbank 1929 Unknown Sapphire Infrutec SA 1992 Op Laroda Queen rosa USDA 1972 Santa Rosa x Queen Ann Angeleno Garabedian 1967 Op Queen Ann Autumn Pride Zaiger Friar x (Mariposa x Ebony) Black Queen Unknown mut. Late Santa Rosa Roy Sum Sumruld 1966 mut. Late Santa Rosa Catalina Krause 1982 Op Angeleno Fortune USDA 1990 Laroda (Queen Ann x Late Santa Rosa) Laroda UC.Davis 1954 Santa Rosa x Gaviota Friar USDA 1968 Gaviota x Nubiana Flavor Rich Zaiger Friar x (Autumn Giant x Queen Ann) x plumcot) Santa Rosa Burbank 1906 Unknown Blue Gusto Unknown Unknown Norma Unknown Unknown Larry Ann Unknown Unknown Pink Delight Unknown Unknown Lamoon Unknown Unknown Aurora Unknown Unknown September King Unknown Unknown Early Ambar Unknown Unknown P. domestica D`Agen President. Sawbridgeworth England. Unknown Unknown. P. ceracifera Mirobalano. Unknown. Unknown. P. armeniaca Castle bright. Unknown. Op (Perfection x Castleton). Op: Open pollinated. 2 Okie (1995); Okie et al. (1996). 1. precipitate the nucleic acids, and the resulting pellet was dissolved in distilled water. RNA was removed by digestion with deoxyribonuclease-free ribonuclease A. Total DNA was precipitated using cold ethanol. The precipitate was washed twice with 70% ethanol, and the pellet was dissolved in distilled water. The purified total DNA was quantified by gel electrophoresis, and the quality of the DNA was verified by spectrophotometry. DNA samples were stored at 4º C.. SSR and ISSR amplifications ISSR: A prescreening of 35 ISSR primers was performed using 4 plum cultivars. Of these primers, 11 were selected for subsequent analyses. Amplifications were performed in a volume of 25 µL containing 40 ng total DNA, 1x PCR buffer (Gibco-BRL), 2.0 mM MgCl2, 0.16 mM dNTPs, 0.24 µM oligodeoxynucleotide primer and 2 unit of Taq DNA polymerase (Gibco-BRL). The.
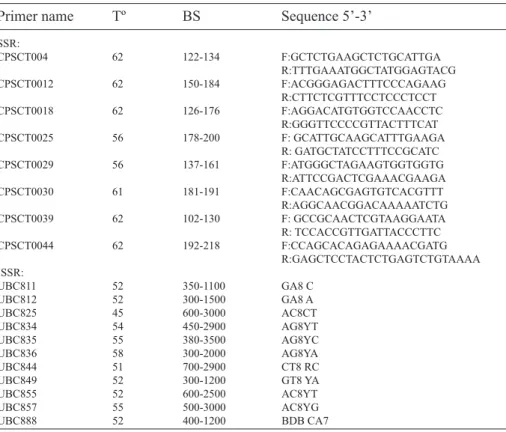
(4) 536. ciencia e investigación agraria. following PCR conditions were used: an initial denaturation step of 3 min at 94º C; 40 cycles of 1 min at 94º C, 1 min at the specific annealing temperature (Table 2), and 2 min at 72º C; and a final extension of 20 min at 72º C. SSR: A total of 27 SSR primers isolated from P. salicina (Mnjja et al., 2004) were tested; of these primers, 8 were selected for analyzing the samples in this study. PCR was carried out in a total volume of 25 µl under the same conditions described for ISSR, except for the primers. The final concentrations of the reverse and forward primers were 0.24 µM and 0.06 µM, respectively. The following PCR conditions were used: an initial denaturation step of 3 min at 94º C; 35 cycles of 40 sec at 94º C, 40 sec at the specific annealing temperature (Table 2), and 1 min at 72º C; and a final extension of 10 min at 72º C. Amplifications were performed in a Corbett Research thermal cycler,model GC1-96, (Corbett. Research, Sydney, Australia) for both techniques. At least two PCR amplifications were performed for each sample with both SSR and ISSR primers to evaluate the reproducibility of the bands obtained. DNA amplification fragments were separated in a 2% agarose gel with 1x tris-acetate-EDTA buffer and stained with gel red nucleic acid stain (Biotum). Additionally, SSR were sequenced with an ABI 3100 Avant Automatic sequencer (Azco Biotech, Inc. Oceanside, Canada. For PCR reactions, one of each primer pair was end-labeled with FAM, HEX or TAMARA. The sequencing data were analyzed with Scanner software v. 1.0 (Applied Biosystems, California, USA).. Data analysis The SSR data were first scored as codominant markers in order to distinguish homozygotes and heterozygotes for each locus. The ISSR data were analyzed as dominant markers: the band patterns were. Table 2. Characteristics and identification of SSR and ISSR primers used in this investigation. The information includes primer mane, annealing temperature (Tº); band size (BS) and sequences 5’-3’.. Primer name. Tº. BS. SSR: CPSCT004 62 122-134 CPSCT0012 62 150-184 CPSCT0018 62 126-176 CPSCT0025 56 178-200 CPSCT0029 56 137-161 CPSCT0030 61 181-191 CPSCT0039 62 102-130 CPSCT0044 62 192-218 ISSR: UBC811 52 350-1100 UBC812 52 300-1500 UBC825 45 600-3000 UBC834 54 450-2900 UBC835 55 380-3500 UBC836 58 300-2000 UBC844 51 700-2900 UBC849 52 300-1200 UBC855 52 600-2500 UBC857 55 500-3000 UBC888 52 400-1200. Sequence 5’-3’ F:GCTCTGAAGCTCTGCATTGA R:TTTGAAATGGCTATGGAGTACG F:ACGGGAGACTTTCCCAGAAG R:CTTCTCGTTTCCTCCCTCCT F:AGGACATGTGGTCCAACCTC R:GGGTTCCCCGTTACTTTCAT F: GCATTGCAAGCATTTGAAGA R: GATGCTATCCTTTCCGCATC F:ATGGGCTAGAAGTGGTGGTG R:ATTCCGACTCGAAACGAAGA F:CAACAGCGAGTGTCACGTTT R:AGGCAACGGACAAAAATCTG F: GCCGCAACTCGTAAGGAATA R: TCCACCGTTGATTACCCTTC F:CCAGCACAGAGAAAACGATG R:GAGCTCCTACTCTGAGTCTGTAAAA GA8 C GA8 A AC8CT AG8YT AG8YC AG8YA CT8 RC GT8 YA AC8YT AC8YG BDB CA7.
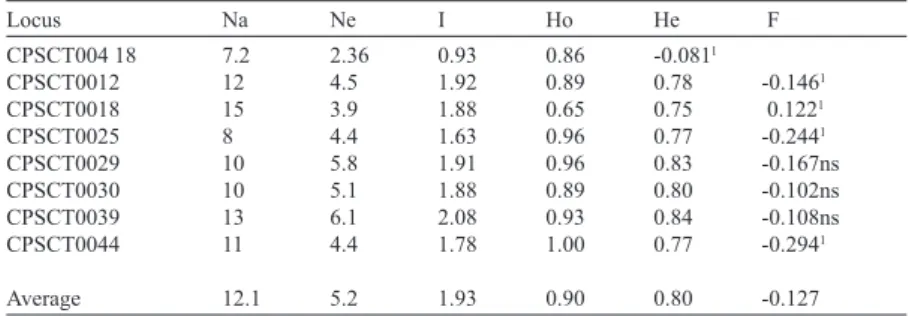
(5) VOLUME 39 Nº3 SEPTEMBER – DECEMBER 2012. scored as 1 when the band was present and 0 when it was absent. Finally, a binary matrix containing the ISSR and SSR data together was constructed. In this case, each allele was scored as 1 or 0. The following variability parameters were used for the plum cultivars: average number of alleles per locus (A), effective number of alleles (Ae), observed heterozygosity (Ho), expected heterozygosity (He), fixation index (Fis; Wright, 1978), gene diversity (h; Nei, 1973) and the Shannon index (I; Shannon and Weaver, 1949). All of these parameters were calculated using GenAlex v. 6.4 (Peakall and Smouse, 2006). The genetic relationships among the cultivars were analyzed with Structure software (v. 2.1) (Pritchard et al., 2000). This method assigns individuals from the entire sample to clusters (K) in such a way that the Hardy Weinberg disequilibrium and linkage disequilibrium (LD) are maximally explained. The determination of the most likely number of clusters (K) was carried out by comparing the log probability [Pr (X/K)] for each value of K. The runs with the highest posterior probability of K (Pr (K/X) was chosen, and the proportion of ancestry of each population was calculated by averaging the estimated membership coefficient (Q) of the individuals. The program was run to test the hypotheses for one to four subgroups with no admixture and with correlated allele frequencies. Runs were carried out using a burn-in period of 500,000 and a MCMC length of 1,000,000 with 5 replicates for each run; cultivars with membership probabilities 0.8 were assigned to that cluster; cultivars with membership probabilities < 0.8 were considered to be of possible mixed origin. The genetic differentiation between groups was estimated using Gst (Nei, 1973; Yeh et al., 1995) and AMOVA st (Excoffier et al., 1992; 2005). Principal Coordinate Analysis (PCA) was used to determine the major patterns of clustering based on the multivariate data set. The plot was. 537. built using binary genetic distance, a Euclidean metric distance displayed by GenAlex software (Peakall and Smouse, 2006). LD was estimated using GenePop v1.2 software (Raymond and Rousset, 1995). Sequential Bonferroni correction was carried out for SSR and ISSR markers to correct for the effects of multiple tests (alpha level 0.05/ number of loci compared; 250.278 binary combinations). Also, the methodology of Aranzana et al. (2010) was used to analyze LD. In this case, 213 biallelic loci and 90,525 binary combinations were analyzed with p ≤ 0.0000006 designated as the significance threshold for LD (Bonferroni correction).. Results Genetic variability A total of 97 alleles were detected by analysis of eight SSR loci. The percentage of polymorphic SSR loci was 100%. The level of SSR variability was high for the 29 Japanese plum cultivars (Table 3). The average number of alleles per locus (Na) was 12, ranging from 8 to 18), the effective number of alleles (Ne) was 5.2 (3.9 to 6.1), the observed heterozygosity (Ho) was 0.9 (0.65 to 1.0), and the expected heterozygosity (He) was 0.8 (0.75 to 0.86). Four loci had a significant excess of heterozygotes: CPSCT004, CPSCT0012, CPSCT0025 and CPSCT0044, and one locus had a deficit of heterozygotes (CPSCT0018) (Table 3; Fixation index (F)). The number of heterozygotes did not differ significantly among the other three loci. The average of the SSR loci analyzed showed a significant excess of heterozygotes (F= -0.127). The eleven ISSR primers produced 232 scoreable fragments for the 29 Japanese plums. It was possible to distinguish 88.4% of the polymorphisms, and the values for Nei’s gene diversity (h) and the Shannon index (I) were 0.15 (SE= 0.009) and 0.27 (SE=0.012), respectively..
(6) 538. ciencia e investigación agraria. Table 3. Genetic variability for 29 Japanese plums using 8 SSR loci. Information includes the number alleles/locus (Na), number of effective alleles (Ne), Shannon’s index (I), observed (Ho) and expected (He) heterozygosity, and fixation index (F). SE = standard error. Locus . Na. Ne. I. Ho. He. F. CPSCT004 18 CPSCT0012 CPSCT0018 CPSCT0025 CPSCT0029 CPSCT0030 CPSCT0039 CPSCT0044. 7.2 12 15 8 10 10 13 11. 2.36 4.5 3.9 4.4 5.8 5.1 6.1 4.4. 0.93 1.92 1.88 1.63 1.91 1.88 2.08 1.78. 0.86 0.89 0.65 0.96 0.96 0.89 0.93 1.00. -0.0811 0.78 0.75 0.77 0.83 0.80 0.84 0.77. -0.1461 0.1221 -0.2441 -0.167ns -0.102ns -0.108ns -0.2941. Average . 12.1. 5.2. 1.93. 0.90. 0.80. -0.127. P≤0.001; ns= not significant.. 1. Genetic relationships The genetic relationships among 29 plum and hybrid cultivars and four cultivars of related species (P. domestica, P. ceracifera and P. armeniaca) were analyzed with a model-based Bayesian cluster analysis (Structure software). The molecular markers were converted to binary markers to carry out the cluster analysis. A total of 354 binary markers (232 ISSR and 122 SSR) were used to determine the number of subgroups (K) present among the 33 cultivars. The highest posteriori probability of the data (Pr K/X=0.99) was observed only when K=2; therefore, based on these results, we identified two subgroups (Figure 1). The first group included four cultivars that represent three Prunus species (P. armeniaca, P. domestica and P. ceracifera) and nine Japanese plum cultivars including three known interspecific hybrids and six cultivars of unknown pedigree (Table 1). The memberships ranged between 0.74 (cv. Wickinson) and 1.0 (cv. Segundo, cv. Mirobalano and cv. Castel Bright). In this group, only Wickinson was considered a mixed cultivar because its membership value was less than 80%. The second group included 19 plum cultivars and one plumcot cultivar (“Flavor Rich”). The memberships ranged from 0.57 to 0.99, with eight cultivars having memberships below 80% (“Catalina,” “Blue Gusto,” “Autumn Pride,” “Friar,” “Lamoon,” “Roysum,” “Queen Rosa” and “Larry Ann”); these can be considered to be mixed cultivars. The level of genetic differentiation. Figure 1. The genetic structure of 29 Japanese plum cultivars analyzed in this study as estimated by modelbased Bayesian cluster analysis implemented in the program Structure. The 354 binary molecular markers allowed for identification of Group 1 (red) and Group 2 (green). The membership (Q) of each cultivar is shown on the left side. Cultivars displaying both red and green colors together indicate an admixture. Gst and st are estimations of the genetic differentiation between the two groups. Genetic differentiation values between the groups were st= 0.040 and Gst= 0.055..
(7) VOLUME 39 Nº3 SEPTEMBER – DECEMBER 2012. between the two groups was low (Gst = 0.055 and ST = 0.04). Notably, the genetic differentiation determined by AMOVA increased to ST = 0.06 (p= 0.001) when only 8 SSR alleles were analyzed. The multivariate analysis (PCA) summarized the genetic variation (Figure 2), clustering the cultivars into two groups in agreement with the Bayesian analysis (Structure). Only “Lamoon,” “Norma,” “Autumn Pride,” “September King,” “Robusto” and “Ruby Queen” can be considered outliers. The two groups identified by Structure displayed similar levels of genetic variability (Group 1, I=0.29 and h=0.17; Group 2, I=0.28 and h= 0.17) when binary markers (354 SSR plus ISSR and 232 ISSR) were used. In contrast, the differences between the two groups were significant for every parameter of genetic variability estimated ((Group 1 Na=12.3, Ne=8.7, I=2.3, He=0.88; Group 2 Na=8.3, Ne=4.3, I=1.7, He= 0.76). In addition, Group 1 had an insignificant inbreeding value. 539. (F = 0.04), and Group 2 had a significant excess of heterozygotes (F= -0.18).. Linkage disequilibrium When all 33 cultivars and 250,278 possible binary combination were analyzed together, only 476 allelic combinations (0.19%) showed significant linkage disequilibrium (LD) after applying Bonferroni correction (p<0.0000002). No LD was observed among loci combinations when only 29 plum cultivars were analyzed or when the clustering provided by structure was considered (2 groups). When allelic frequencies below 0.05 were removed, only 213 biallelic loci and 90,525 allelic combinations were considered. In this case, a p value of 0.0000006 (after Bonferroni correction) was used as a threshold for declaring a significant LD between alleles. The results showed 52 and. Figure 2. Principal Coordinate Analysis for 29 Japanese plum cultivars, 2 European plum cultivars, 1 Mirobalano cultivar and 1 apricot cultivar, based on 354 binary SSR and ISSR markers. PC1= Principal Coordinate 1 and PC2= Principal Coordinate 2. Black and white circles correspond to group 1 and 2 respectively, identified by Structure software (Pritchard et al., 2000)..
(8) 540. ciencia e investigación agraria. 64 allelic combinations with significant LD for 33 cultivars and 29 plum cultivars, respectively. When the two clusters identified by structure were considered, no LD was identified.. Discussion The level of SSR diversity was quite high among the 29 plum cultivars studied (Na= 12.1; Ne=5.2; Ho=0.9; He=0.8) in comparison to that found in previous reports by Ahmad et al. (2004) for 20 plum cultivars (Na= 4.3) and Mnejja et al. (2004) for 8 plum cultivars (Na=5.7; Ho=0.73). Similarly, the level of diversity among the 29 plum cultivars was superior to that of other Prunus species such as peach (Na=6.6-7.3; Ho=0.35; He=0.5-0.55; Aranzana et al., 2003; Rojas et al., 2008), almond (Na=8.8; Ho=0.7; He=0.79; Fathi et al., 2008), cherry (Na= 3.5-6.0; He = 0.49-0.66; Wünsch and Hormaza, 2002; Schueler et al., 2003) and apricot (Na=3.5; Ho=0.58; Ruthner et al., 2006). The magnitude of the fixation index (F = -0.127) was higher than that of other outcrossing species such as cherry (F= - 0.033 to -0.092; Stoeckel et al., 2006), almond (F= 0.15; Fathi et al., 2008), apricot (F=0.04; Bourguiba et al., 2010), strawberry (F= 0.11; Ashley et al., 2003), grape (F= 0.16; Mallikarjuna et al., 2003), and wild apple (F= 0.10; Coart et al., 2003). The significant excess of heterozygosity shown in average by SSR markers in the 29 Japanese plum cultivars is not unusual for tree species (Eguiarte et al., 1992; Jelinski and Cheliak, 1992; Imbert and Lefèvre, 2003). The excess of heterozygosity could be explained by negative assortative mating related to a selfincompatibility system such that parental lines carrying different alleles are favored (Stoeckel et al., 2006) and by the interspecific crossing that is usually used in plum improvement programs. In agreement with results generated with the SSR markers, the ISSR markers displayed a high level of variability. Shimada et al. (1999) studied 42 Japanese plum cultivars by using RAPD markers. and found a low level of polymorphism (24%). On the other hand, Goulao et al. (2001) analyzed 28 plum cultivars by using ISSR and AFLP, and again, the genetic variability (polymorphic ISSR = 87.4% and polymorphic AFLP= 62.8%) was less than that found in this study. Additionally, the values were greater than the average genetic variability estimated for outcrossing plants (He=0.22 for dominant markers; Ho=0.63 and He=0.65 for SSR; Nybom, 2004). The high level of SSR and ISSR variability observed in the 29 plum cultivars used in this study is noticeable because these cultivars represent the core of plums germplasm for the initial steps of a breeding program in Chile. Bayesian clustering analyses identified a genetic structure consisting of two groups with different levels of admixture. The first group included four Prunus species: the tetraploid P. domestica and the diploids P. armeniaca, P. ceracifera and P. salicina. Notably, of the nine Japanese plum cultivars that were clustered in this group, at least four are known to be interspecífic hybrids (“Byron Gold,” “Shiro,” “Segundo” and “Robusto”). In addition, “Elephant Heart” was created by Burbank; therefore, it is highly probable that it also corresponds to an interspecific hybrid. Only “Wickson” showed a 26% admixture with Group 2. This later cultivar was produced by crossing “Kelsey” and “Burbank,” both imported directly from Japan by Luther Burbank between 1870 and 1885 (Okie 1995). The second group included eight plum cultivars (“Queen Rosa,” “Roysum,” “Friar,” “Autumn Pride,” “Catalina,” “Larry Ann,” “Lamoon” and “Blue Gusto”) with a high level of admixture with Group 2 (29 to 43%). Some pedigrees of these cultivars also have an interspecific origin and share ancestors (“Queen Ann,” “Santa Rosa” and “Gaviota”) with some cultivars of Group 1. For example, the origin of “Queen Rosa” (membership = 76%, admixture = 24%) is “Santa Rosa” x “Queen Ann”. It is thought that “Santa Rosa” was produced by crossing a plant of P. salicina imported by Luther Burbank.
(9) VOLUME 39 Nº3 SEPTEMBER – DECEMBER 2012. with P. simonii. In contrast, the parental lines of “Queen Ann” are “Gaviota” and “El Dorado,” both complex interspecific hybrids produced by Burbank (Okie, 1995). A similar situation is observed with “Roysum,” “Friar” and “Autumn Pride.” The most extreme admixture was found in “Catalina” (membership = 57%, admixture = 43%); this cultivar was a selection from an openpollinated family of “Angeleno” which was, in turn, a selection from an open-pollinated family of “Queen Ann.” The variable memberships of this cultivar group give support to the idea that a high capacity for hybridization exists between species of plums. Although Bayesian clustering allowed the identification of two genetic groups, differentiation between these groups was low, as estimated by Analysis of Molecular Variance (st = 0.04; p=0.001) and Gst = 0.055. The narrow genetic base used to develop these cultivars (Okie and Hancock, 2008) may explain these results; most cultivars studied have common ancestors among their pedigrees.. 541. The scarce LD observed (0.06% for 33 cvs. and 0.07% for 29 plum cvs.) is not surprising for selfincompatible and outcrossing species such as P. salicinaIn this study, the high level of effective recombination rate can remove associations between loci except for those closely linked on a chromosome. This result is highly relevant if an association analysis strategy is planned for finding genes of agronomic interest. With low LD, the most highly recommended strategy is to search for polymorphic Single Nucleotide Polimorfism of candidate genes associated with phenotypic traits.. Acknowledgements We acknowledge financial support from the Fondecyt project Nº11080192 and Consorcio Tecnológico de la Fruta SA. In addition, the authors wish to express their gratitude to the anonymous reviewers for critically reviewing this manuscript.. Resumen B. Carrasco, C. Díaz, M. Moya, M. Gebauer y R. García-González. 2012. Caracterización genética de cultivares de ciruelo japonés (Prunus salicina) mediante marcadores moleculares SSR y ISSR. Cien. Inv. Agr. 39(3): 533-543. La caracterización genética de 29 cultivares de ciruelo japonés (Prunus salicina) y cuatro cultivares de otras especies de Prunus, fue llevada a cabo mediante 97 alelos codominantes SSR y 232 loci binarios ISSR. Un elevado nivel de variabilidad genética fue encontrado en comparación a otras especies del género Prunus. En promedio para los loci SSR se obtuvo Na = 12,1, Ne = 5,2, Ho = 0,9, He = 0,8 y F= -0,127; y para los loci ISSR se obtuvo h = 0,15 e I = 0,27. Las relaciones genéticas entre cultivares fue estimada usando análisis de coordenadas principales (ACP) y análisis de cluster bayesiano (Structure). Este último permitió identificar dos subgrupos (k=2). El primer grupo incluyó a los cultivares de las cuatro especies de Prunus: P. salicina, P. armeniaca, P.domestica y P. ceracifera cuya membrecía varió entre 0,74 y 1,0. El segundo grupo incluyó a 19 cultivares de ciruelo japonés y un cultivar Plumcot con membrecías entre 0,57 y 0,99. Con algunas excepciones, el ACP mostró relaciones genéticas similares al análisis de cluster bayesiano. El nivel de diferenciación genética entre los dos grupos fue bajo (Gst =0,055 and ST =0,04). Adicionalmente, se apreció un escaso desequilibrio de ligamiento (LD). Se sugiere que el alto nivel de variabilidad genética, el escaso nivel de LD y diferenciación entre grupos,.
(10) 542. ciencia e investigación agraria. puede ser explicado por los mecanismos de autoincompatibilidad que favorecen la hibridación entre cultivares genéticamente distantes, tanto a nivel intraespecífico como interespecífico. Estas estrategias son frecuentemente usadas en los programas de mejoramiento genético de ciruelo japonés. Palabras clave: AMOVA, análisis Bayesiano, análisis de coordenadas principales (ACP), ciruelo, distancia genética, estructura.. References Ashley, M.V., J.A. Wilk, S.M.N. Styan, K.J. Craft, K.L. Jones, K.A. Fedkheim, K.S. Lewers, and T.L. Ashman. 2003. High variability and disomic segregation of microsatellites in octoploid Fragaria virginiana Mill. (Rosaceae). Theor. Appl. Genet. 107:1201–1207. Ahmad, D., D. Potter, and S.M. Southwick. 2004. Identification and characterization of plum and pluot cultivars by microsatellites markers. J. Hort. Sci. Biotech. 79:164-169. Aranzana, M.J., J. Carbó, and P. Arús. 2003. Microsatellite variability in peach [Prunus persica (L.) Batsch]: cultivar identification, marker mutation, pedigree inferences and population structure. Theor. Appl. Genet. 106:1341-1352. Aranzana, M.J., E. Abbassi, W. Howad, and P. Arús. 2010. Genetic variation, population structure and linkage disequilibrium in peach commercial varieties. BMC Genetics 11:1-12. Bourguiba, H., L. Krichen, J-M. Audergon, B. Khadari, and N.Trifi-Farah. 2010. Impact of Mapped SSR Markers on the Genetic Diversity. Plant. Mol. Biol. Rep. 28:578–587. Coart, E., X. Vekemans, M.J.M. Smulders, I. Wagner, J. Van Huylenbroeck, E. Bockstaele, and I. Roldan-Ruiz. 2003. Genetic variation in the endangered wild apple (Malus sylvestris (L.) Mill.) in Belgium as revealed by amplified fragment length polymorphism and microsatellite markers. Mol. Ecol. 12:845–857. Cheng, Z., and H. Huang. 2009. SSR fingerprinting Chinese peach cultivars and landraces (Prunus persica) and analysis of their genetic relationships. Scientia Horticulturae 120: 188-193. Doyle, J.J., and J.L. Doyle. 1990. Isolation of plant DNA from fresh tissue. Focus 12:13-15.. Eguiarte, L.E., N.Perez-Nasser, and D. Piñero. 1992. Genetic structure, outcrossing rate and heterosis in Astrocaryum mexicanum (tropical palm): implications for evolution and conservation. Heredity 69:217–228. Excoffie, R. L., P.E. Smouse, and J.M. Quattro. 1992. Analysis of molecular variance inferred from metric distances among DNA haplotypes: Application to human mitocondrial DNA restriction sites. Genetics 131: 479-491. Excoffier, L., G. Laval, and S. Schneider. 2005. Arlequin ver. 3.0: An integrated software package for population genetics data analysis. Evol. Bioinf. Online 1:47-50. Fathi, A., B. Ghareyazi, A. Haghnazari, M.R. Ghaffari, S.M. Pirseyedi, S. Kadkhodaei, M.R. Naghavi, and M. Mardi. 2008. Assessment of the genetic diversity of almond (Prunus dulcis) using microsatellite markers and morphological traits. Iranian J. Biotech. 6:98-106. Goulao, L., L. Monte-Corvo and C.M. Oliveira. 2001. Phenetic characterization of plum cultivars by high multiplex ratio markers: Amplified fragment length polymorphisms and inter-simple sequence repeats. J. Am. Soc. Hort. Sci. 126: 72–77. Imbert, E. and F. Lefèvre. 2003. Dispersal and gene flow of Populus nigra (Salicaceae) along a dynamic river system. J. Ecol. 91:447–456. Jelinski, D. E. and W. Cheliak. 1992. Genetic diversity and spatial subdivision of Populus tremuloides (Salicaceae) in a heterogeneous landscape. Am. J. Bot. 79: 728-736. Mallikarjuna, K. A., G.S. Dangl, B.H. Prins, J.M. Boursiquot, M. A. Walker, C. P. Meredith and C.J. Simon. 2003. Genetic structure and differentiation in cultivated grape, Vitis vinifera L. Genet. Res. Camb. 81: 179–192..
(11) VOLUME 39 Nº3 SEPTEMBER – DECEMBER 2012. Martins, M., R. Tenreiro, and M.M. Oliveira. 2003. Genetic relatedness of Portuguese almond cultivars assessed by RAPD and ISSR markers. Plant Cell Rep. 22:71–78. Nei, M. 1973. Analysis of gene diversity in subdivided populations. PNAS 70:3321–3323. Nybom, H. 2004. Comparison of different nuclear DNA markers for estimating intraspecific genetic diversity in plants. Mol. Ecol. 13:1143–1155. Mnejja, M., J. Garcia-Mas, W. Howad, m. l. badenes, and p. arús. 2004. Simple-sequence repeat (SSR) markers of Japanese plum (Prunus salicina Lindl.) are highly polymorphic and transferable to peach and almond. Mol. Ecol. Notes 4: 163–166. Okie, W.R. 1995. Plums Breeding and Genetics (Prunus spp.) In: Bellini E., Garcia J.E., R. Monet, and W.R. Okie.(eds.). International Symposium of State of art and perspectives of world genetic improvement of fruit tree species (peach, plum, apricot and pear). Dipartimento di Ortoflorofrutticoltura, Universita di Firenze, Firenze, Italy. p. 30-69. Okie, W.R., and J.H. Weinberger. 1996. Plums. In: Janick, J. and J.N. Moore (eds.). Fruit Breeding, Vol. I: Tree and Tropical Fruit. John Wiley and Sons, Inc. Okie, W.R., and J.F. Hancock. 2008. Plums. In: Hancock J.F. (ed.). Temperate fruit crop breeding: germplasm to genomics. Kluwer Academic Publisher. Dordrecht, Holland. p. 337-358. Ortiz, A., R. Renaud, I. Calzada, and E. Ritter. 1997. Analysis of plum cultivars with RAPD markers. J. Hort. Sci. 72: 1–9. Peakall, R., and P.E. Smouse. 2006. GenAlex 6.0: genetic analysis in Excel. Population genetic software for teaching and research. Mol. Ecol. Notes 6:288-295. Pritchard, J., M. Stephens, and P. Donnelly. 2000. Inference of population structure using multilocus gentoype data. Genetics 155:945–959. Raymond, M., and F. Rousset. 1995. GenePop (v. 1.2): population genetics software for exact test and ecumenicism. J. Hered. 86: 248-249. Rojas, G., M.A. Méndez, C. Muñoz, G. Lemus, and P. Hinrichsen. 2008. Identification of a minimal microsatellites marker panel for the fingerprint-. 543. ing of peach and nectarine cultivars. Electronic J. Biotech. 11: 1-12. Ruthner, Sz., A. Pedryc, B. Kriska, C. Romero, and M.L. Badenes. 2006. Molecular characterization of apricot (Prunus armeniaca L.) cultivars using cross species SSR amplification with peach primers. Int. J. Hort. Sci. 12: 53–57. Shannon, C.E., and W. Weaver. 1949. The Mathematical Theory of Communication. University of Illinois Press, Urbana, USA: 117 pp. Schueler, S., A. Tusch, M. Schuster, and B. Ziegenhagen. 2003. Characterization of microsatellites in wild and sweet cherry (Prunus avium L.) markers for individual identification and reproductive processes. Genome 46:95-102. Shimada, T., H. Hayama, T. Haji, M. Yamaguchi, and M. Yoshida. 1999. Genetic diversity of plums characterized by random amplified polymorphic DNA (RAPD) analysis. Euphytica 109:143–147. Stoeckel, S., J. Grange, J.F. Fernández-Manjarres, I. Bilger, N. Frascaria-Lacoste, and S. Mariette. 2006. Heterozygote excess in a self-incompatible and partially clonal forest tree species Prunus avium L. Mol. Ecol. 15:2109–2118. UPOV. 1982. Guidelines for the conduct of tests for distinctness, homogeneity and stability. (Prunus salicina Lindl. and other diploid plums). Ginebra, Switzerland. 24 pp. Wright, S. 1978. Evolution and the genetics of populations. variability within andamong natural populations, vol. 4th. University of Chicago Press, Chicago, USA. 439 pp. Wünsch, A., and J.I. Hormaza. 2002. Molecular characterization of sweet cherry (Prunus avium L.) genotypes using peach [Prunus persica (L.) Batsch] SSR sequences. Heredity 89:56–63. Yeh, F.C., R. Yang, and T. Boyle. 1995. PopGene 1.31. Quick user guide. University of Alberta and Centre for International Forestry Research. Edmonton, Canada. 28 pp. Zietkiewicz, E., A. Rafalski, and D. Labuda. 1994. Genome fingerprinting by simple sequence repeat (SSR)-anchored polymerase chain reaction amplification. Genomics 20:176-183..
(12)
(13)
Figure

Documento similar
Of special concern for this work are outbreaks formed by the benthic dinoflagellate Ostreopsis (Schmidt), including several species producers of palytoxin (PLTX)-like compounds,
In the previous sections we have shown how astronomical alignments and solar hierophanies – with a common interest in the solstices − were substantiated in the
Díaz Soto has raised the point about banning religious garb in the ―public space.‖ He states, ―for example, in most Spanish public Universities, there is a Catholic chapel
Subtelomeric macrosatellite repeat D4Z4 methylation: genetic and non-genetic predictors and risk of urothelial carcinoma of the bladder 77 Chapter VI.. Lack of association
The high level of agreement between QuickSee and subjective refraction together with the VA improvement achieved in both study groups using QuickSee refractions suggest that the
The objectives of this work were to design a microsatellite panel for biodiversity to study the genetic characterization and to analyze the diversity and intrapopulation structure of
1. S., III, 52, 1-3: Examinadas estas cosas por nosotros, sería apropiado a los lugares antes citados tratar lo contado en la historia sobre las Amazonas que había antiguamente
Statistically significant differences in the profiles of antimicrobial susceptibility and genetic diversity (PFGE) of Trueperella pyogenes have been detected between
