Electrical signal measurements in avocado trees: A potential tool for monitoring physiological responses to soil water content?
9
0
0
Texto completo
(2) Electrical Signal Measurements in Avocado Trees: a Potential Tool for Monitoring Physiological Responses to Soil Water Content? P.M. Gil1, 2, L.A. Gurovich3, B. Schaffer4, J. Alcayaga5 and R. Iturriaga6 1 Instituto de Investigaciones Agropecuarias (INIA), La Cruz, Chile 2 Centro Regional de Estudios en Alimentos Saludables, Valparaíso, Chile 3 Departamento de Fruticultura y Enología, Facultad de Agronomía e Ingeniería Forestal, Pontificia Universidad Católica de Chile, Chile 4 Tropical Research and Education Center, University of Florida, USA 5 Laboratorio de Fisiología Celular, Departamento de Biología, Facultad de Ciencias, Universidad de Chile, Santiago, Chile 6 Laboratorio de Neurobiología, Facultad de Ciencias Biológicas, Pontificia Universidad Católica de Chile, Santiago, Chile Keywords: phytomonitoring, electrical signal, soil water content, Persea americana, water stress Abstract Monitoring soil water content coupled with phytomonitoring techniques have been shown to be good tools for irrigation management in avocado orchards. There are many well-tested devices for monitoring soil moisture in orchards but options for measuring plant water status are limited. The objective of this study was to determine whether measuring voltage differences between roots and leaves can be used as a technique to measure plant water status related to soil water content. Root and shoot voltage differences were monitored in young ‘Hass’ avocado trees grafted onto clonal rootstocks grown in containers, and in young seedling ‘Mexicola’ avocado trees grown hydroponically, both experiments carried out under laboratory conditions. In container-grown ‘Hass’ avocado trees, root and shoot voltage differences were initially measured for about 2 h to determine steady state conditions. Plants were then exposed to cycles of soil drying and re-watering. In seedling ‘Mexicola’ trees, electrical signals were measured for at least 75 min in control plants and plants exposed to simulated drought stress. The extracellular electrical potential difference between the base of the trunk and the leaf petiole was continuously monitored after exposing plants to treatments. Results indicated that in ‘Hass’ avocado trees, a change in soil water content induced by root drying and rewatering was accompanied by a slow change in the electrical signal at the leaf petiole which was greatest after 52 and 32 min for root drying and re-watering, respectively. This was related to a decrease in stomatal conductance (gs) of plants exposed to drought. Also, in hydroponic conditions, significant voltage differences occurred in plants exposed to drought simulated by the addition of polyethylene glycol (PEG 6000) to the hydroponic medium resulting also in a decrease in gs. These results suggest that it may be possible to use voltage differences measurements as a technique for monitoring physiological responses to soil water content. INTRODUCTION Avocado (Persea americana Mill.) is very sensitive to drought and root waterlogging. In Chile, some reasons for the relatively low productivity of this species may be related to the water status of the crop that at times is under-irrigated causing water stress and at other times is over-irrigated resulting in root asphyxiation. An excess or lack of water during growth limits fruit production and quality, particularly if stress occurs between spring and beginning of summer (Whiley et al., 1988). Phytomonitoring techniques have been tested with varying degrees of success for irrigation scheduling in avocado orchards. These have included measuring leaf thickness, leaf water potential, sap flow velocity and diurnal differences in trunk or fruit diameter Proc. 6th IS on Irrigation of Hort. Crops Eds.: S. Ortega-Farias and G. Selles Acta Hort. 889, ISHS 2011. 371.
(3) (Lahav and Whiley, 2002). Measuring diurnal differences in trunk and fruit diameter, known as dendrometry, as an indicator of plant water status has been used recently in Chile for fine tuning irrigation scheduling in avocado orchards (Gurovich et al., 2006). Real-time, continuous dendrometric measurements of tree water status indicated that avocado trees respond very rapidly to fluctuations in soil water content; however, this technique is still very expensive and installing a sufficient number of dendrometers to provide an adequate number of replications in an orchard can be costly. Thus, there is a need to explore alternative methods for real-time, continuous phytomonitoring of plant water status related to soil moisture content in avocado orchards. The presence of fast conducting signals generated in the roots and conducted through the vascular system to the leaf has been studied in several annual plant species. Stimulation of roots in Salix viminalis by the application of nutrients, hormones or changes in the pH, caused changes in electric potential difference between the roots and the leaves. These changes were followed by a modification of leaf respiration and photosynthetic rates within 3 min after treatments were applied, indicating that the changes in the electrical signals might reflect or be a direct mechanism of communication between the roots and the leaves (Fromm and Eschrich, 1993; Mishra et al., 2001). Similarly, osmotic stress suddenly applied to sunflower roots generated an electric potential difference between the roots and the leaves that accompanied decreases in stomatal conductance (Mishra et al., 2001). It has been postulated that electrical signals could be a communication pathway between roots and shoots under water stress (Fromm and Fei, 1998). Thus, stomatal response to soil water content may be triggered by an electrical voltage differential between the roots and the leaves that can be easily measured via electrodes connected to an amplifier. This opens the possibility for developing a new phytomonitoring technique for measuring plant response to soil water content based on measuring voltage differences between roots and leaves. The objective of this study was to determine if changes in voltage between roots and leaves of avocado trees can be measured and related to changes in soil water content, and drought and root hypoxia stress. MATERIALS AND METHODS This study was part of a more in-depth study to investigate root to leaf electrical signaling in avocado in response to various environmental stimuli (see Gil et al., 2008a, b). Two experiments were conducted to determine the effects of drought and watering on electrical voltage differences between leaf petiole and the base of the stem (VL-S) and stomatal conductance (gs) of avocado trees. Experiment 1: Electrical Response of Avocado to Soil Water Content 1. Plant Material. Two-year-old ‘Hass’ avocado trees on clonal Duke 7 rootstock were used in this study. The plants were grown in plastic containers in a commercial nursery in a medium composed of peat, perlite, compost and sand and fertilized according to standard nursery practices. The plants ranged in height from 1.2 to 1.4 m with a variable number of leaves (22-45) per plant. 2. Experimental Design. Control. In a laboratory, electric voltage signals were measured for about 80 min in eight avocado plants (replications) under stable environmental conditions to determine VL-S in the absence of environmental alterations (control or baseline). Treatments: root drying and root wetting. The same eight plants were exposed to the following treatments: 1) desiccation of the roots by exposure of the root system to a directed air current at ambient temperature (20°C) for about 80 min, and 2) re-wetting of desiccated plant roots by adding 500 cc of distilled water to the soil and monitoring the VL-S response for 120 min. The VL-S was continuously recorded during each of the experiments. Air temperature during the measurement period was between 22.5 and 23.3°C and leaf temperature ranged from 22.4 to 23.7°C. The photosynthetic photon flux (PPF) (Quantum sensor QSS-01 light meter, Lehle Seeds, Round Rock, Texas, USA) directly 372.
(4) above the abaxial leaf surface was about 85 mol photons m -2 s -1. 3. Measurements. Electrical voltage signals: surface contact electrodes were placed on the stem 20 cm above the soil surface and in the petiole of a leaf located in the lower third of the plant canopy (Fromm and Fei, 1998). The electrodes consisted of a thick cotton thread absorbed with KCl 0.1 M dipped in a 2.0 ml Eppendorf tube containing KCl 0.1 M. Ag/AgCl electrodes (0.4 mm of diameter) were immersed in the Eppendorf tubes and were connected to an amplifier (M-707 Microprobe System; World Precision Instruments, Sarasota, Florida, USA), and the output was recorded with a Powerlab analog digital acquisition system (AD Instruments, Castle Hill, Australia). Prior to plant measurements, the electrodes were placed in KCl 0.1 M to compensate the junction potential. To record VL-S the electrode located on the leaf petiole acted as the recording electrode while the electrode located on the stem served as the reference. Stomatal conductance: stomatal conductance (gs) was measured with a steady state porometer (Li-Cor 1600, Lincoln, Nebraska, USA) as described by Prive and Janes (2003) and Raviv et al. (2001). Stomatal conductance was measured on the same leaf on which the electrode was placed. Stomatal conductance was measured on each of the 8 replications before and after the voltage was recorded during each treatment (root drying and root wetting). Soil moisture: plants in each treatment were placed on a digital balance (Mettler Toledo, Hispanic Precision, Model Wildcat, Ohio, USA), and the total weight of the plant, soil and container was determined before and after each treatment. Plants were then excised at the soil surface, containers and soil were reweighed. Gravimetric soil water content (ω) was determined with the formula: ω = ((wet soil weight - dry soil weight) / dry soil weight)*100. Experiment 2: Electrical Responses of Avocado Trees Grown Hydroponically to Osmotic Shock and Root Hypoxia 1. Plant Material. Six-month-old seedling ‘Mexicola’ avocado trees obtained from a commercial nursery were used in this study. Plants were grown in a medium of 100% compost, irrigated and fertilized according to standard nursery practices. Plants were removed from the potting medium and roots were washed with tap water and placed in a hydroponic medium of Hoagland’s solution (Hoagland and Arnon, 1950) in a 30-L plastic container. Air was continuously pumped into the container via an air pump (Elite model 802, Hagen Manufacturing, Canada) with 2 exit tubes at a flow rate of 3 L min-1 and an injection pressure of 24 KPa. At the time that trees were placed into the hydroponic medium, plants ranged in height from 20 to 35 cm with 10 to 16 leaves per plant. 2. Experimental Design. Plants were divided into two treatments. Control: five plants (replications) were each placed in a 2-L plastic container of Hoagland’s solution. Electrical voltage signals (variation potentials) were measured for about 90 min under stable environmental conditions in a laboratory to determine VL-S in the absence of environmental alterations (control or baseline condition). Drought: plants were exposed to simulated drought stress, by placing 5 plants in a 2-L plastic container of Hoagland’s solution. After 15 min of baseline electrical potential measurements, polyethylene glycol (PEG) 6000 (15%, 15ºC, s= -0.35 MPa) was added to the Hoagland’s solution to block water availability to the roots and simulate water stress (Fromm and Fei, 1998; Olsovska and Brestic, 2001). Electrical potentials were then measured for an additional 75 min. Air temperature during the experiment was between 20 and 23°C and leaf temperature ranged from 22 to 25°C. The photosynthetic photon flux (PPF) measured with a quantum sensor (QSS-01 light meter, Lehle Seeds, Round Rock, Texas, USA) directly above the adaxial leaf surface was about 90 mol photons m-2 s-1. 3. Measurements. Electrical voltage signals: the surface electrode technique was used in this experiment as same it was describe for Experiment 1. The signal was digitalized with an analog-digital board (Digidata 1200A, Axon Instruments, Sunnyvale, California, USA) for later analysis. Stomatal conductance: stomatal conductance (gs) was measured on the same leaf on which the electrode was placed before and after the voltage was recorded for each treatment. The used technique is the same as it was described for Experiment 1.. 373.
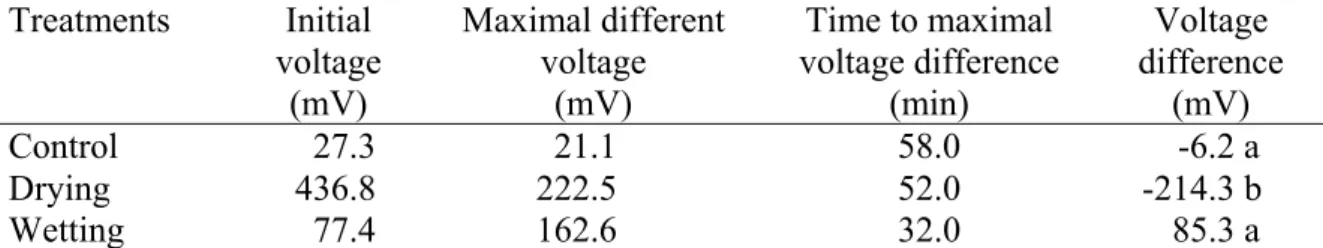
(5) Data Analysis For experiment 1, the effect of treatments on the Maximum Different Voltage – Initial Voltage (Voltage Differences) was analyzed by one-way analysis of variance (ANOVA) and Tukey’s studentized range test (P≤0.05). For Experiment 2, the effect of treatments on the maximum VL-S – initial VL-S (VL-S Maximum Difference), Absolute value of maximum VL-S – initial VL-S (Abs VL-S Maximum Difference) and the change in stomatal conductance from the beginning to the end of the treatment period (gs) were analyzed by a t-test at P≤0.05 and P≤0.01. Data were analyzed using the SAS statistical package (SAS Institute, Cary, North Carolina, USA). RESULTS AND DISCUSSIONS Environmental changes generate bioelectric potentials in plants (Datta and Palit, 2004). In this study with Persea americana Mill., the shape, magnitude and duration of ΔVL-S was dependent on the stimulus. In control plants that received no sudden environmental stimulation, changes in ΔVL-S were small and non-significant (Table 1, Fig. 1). The root desiccation treatment produced a statistically significant change in ΔVL-S (voltage difference) compared to the control. Drying the soil only 1.3% with respect to field capacity resulted in a significant reduction (P≤0.05) of ΔVL-S (-214.3 mV) after 52 min. In contrast, adding water to the dry soil resulted in an increase of 85.3 mV in ΔVL-S after 32 min of re-watering, but this value was not significantly different (P>0.05) from that of the control (Table 1, Fig. 2). Both treatments produced changes in the stomatal conductance (data not shown), which is often directly related to stomatal opening and closing (Cowan, 1972; Tinoco-Ojanguren and Pearcy, 1992; Buckley et al., 2003). Similar changes in electrical signals were reported by Fromm and Fei (1998). In experiment 1 soil drying resulted in a change in ΔVL-S that was observed within 28 to 56 min after forced-air soil drying was initiated, with an average change in ΔVL-S of -214.3 mV, which corresponds to a 96.3% variation of the initial value. Thus, as a result of plant stress induced by decreased soil water content, there was a significant modification of the variation potentials or slow wave potentials which appeared to be transmitted at a speed of 2.4 cm min-1 or 144 cm h-1. Similar results were found in experiment 2, were simulated short-term drought (addition of PEG 6000) caused a significant change in the VL-S (P≤0.05; Table 2, Fig. 3). Also, gs in drought-stressed trees were significantly lower than that of the control plants (P≤0.01; Table 2). Thus in avocado, an extra-cellular electrical signal appears to be involved in root to leaf communication initiating stomatal closure at a very early stage of drought stress. CONCLUSIONS The results reported here demonstrate the existence of a measurable electrical potential difference between avocado roots and shoots that can be readily measured and is correlated with soil moisture content. The response to soil desiccation and simulated drought was a decrease in voltage, whereas the response to soil wetting was an increase in voltage. Thus, the potential may exist to use root to leaf voltage differences as a phytomonitoring technique for measuring plant response to soil water content. It is important to underscore that this study was intended as a “first step” aimed at determining if such a signal exists in avocado and if it could be easily measured. The specific laboratory equipment used for this study is too cumbersome to be practical for field use. Developing a practical phytomonitoring technique based on this concept would require refinement of the instrumentation for field use. Furthermore, substantially more work is needed to relate the magnitude of this signal to soil water content over a wide range of soil moisture contents and varying edaphic and environmental conditions. However, this study does suggest that developing a practical phytomonitoring technique for measuring plant water status based on root to leaf electrical potential difference may be possible.. 374.
(6) ACKNOWLEDGMENTS We thank Mr. Hernán Villalobos, from “Huerto California” avocado nursery (Quillota, Chile) for providing clonal plants, and Mr. Oscar Godoy from Fundo las Chacras (Calera, Chile) for providing seedling ‘Mexicola’ avocado plants. This work is part of a Ph.D. thesis in Agricultural Science (P.M. Gil) at the Facultad de Agronomía e Ingeniería Forestal, Pontificia Universidad Católica de Chile. Literature Cited Buckley, T., Mott, K. and Farquhar, G. 2003. A hydro mechanical and biochemical model of stomatal conductance. Plant Cell Environ. 26:1767-1785. Cowan, I. 1972. Oscillations in stomatal conductance and plant functioning associated with stomatal conductance: Observations and a model. Planta 106:185-219. Datta, P. and Palit, P. 2004. Relationship between environmental factors and diurnal variation of bioelectric potentials of an intact jute plant. Curr. Sci. 87:680-683. Fromm, J. and Eschrich, W. 1993. Electric signals released from roots of willow (Salix viminalis L.) change transpiration and photosynthesis. J. Plant. Physiol. 141:673-680. Fromm, J. and Fei, H. 1998. Electrical signaling and gas exchange in maize plant in drying soil. Plant Sci. 132:203-213. Gil, P.M., Gurovich, L. and Schaffer, B. 2008b. The electrical response of fruit trees to soil water availability and diurnal light-dark cycles. Plant Signal Behav. 3:1026-1029. Gil, P.M., Gurovich, L., Schaffer, B., Alcayaga, J., Rey, S. and Iturriaga, R. 2008a. Root to leaf electrical signaling in avocado in response to light and soil water content. J Plant Physiol. 165:1070-1078. Gurovich, L., Ton, Y. and Vergara, L. 2006. Irrigation scheduling of avocado using phytomonitoring techniques. Cien. Inv. Agr. 33:117-124. Hoagland, D.R. and Arnon, D.I. 1950. The water culture method for growing plants without soil. Circular 347, Agricultural Experimental Station, University of California. Berkeley. Lahav, E. and Whiley, A.W. 2002. Irrigation and mineral nutrition. In: A.W. Whiley, B. Schaffer and B.N. Wolstenholme (eds.), Avocado: Botany, Production and Uses. CABI Publishing, Wallingford, UK. Mishra, N., Mallick, B. and Sopory, S. 2001. Electrical signal from root to shoot in Sorghum bicolor: induction of leaf opening and evidence for fast extracellular propagation. Plant Sci. 160:237-245. Olsovska, K. and Brestic, M. 2001. Function of hydraulic and chemical water stress signalization in evaluation of drought resistance of juvenile plants. J. Central European Agric. 2:157-164. Prive, J.P. and Janes, D. 2003. Evaluation of plant and soil moisture sensors for the detection of drought stress in raspberry. Acta Hort. 618:391-396. Raviv, M., Lieth, J. and Wallach, R. 2001. The effect of root-zone physical properties of coir and UC mix on performance of cut rose (cv Kardinal). Acta Hort. 554:231-238. Tinoco-Ojanguren, C. and Pearcy, R. 1992. Dynamic stomatal behavior and its role in carbon gain during light flecks of a gap phase and an under story Piper species acclimated to high and low light. Oecologia 92:222-228. Whiley, A.W., Saranah, J.B., Cull, B.W. and Pegg, K.G. 1988. Manage avocado tree growth cycles for productivity gains. Queensland Agric. J. 114:29-36.. 375.
(7) Tables. Table 1. Effect of soil drying and soil wetting on the root to leaf voltage difference in avocado plants. Treatments Control Drying Wetting. Initial voltage (mV) 27.3 436.8 77.4. Maximal different voltage (mV) 21.1 222.5 162.6. Time to maximal voltage difference (min) 58.0 52.0 32.0. Voltage difference (mV) -6.2 a -214.3 b 85.3 a. Each value of voltage difference represents the mean (n=8 plants). Maximal ΔVL-S is related to the initial value of the voltage curve for each replication within 80 min. Different letters indicate significant differences (P≤0.05) among treatments (one-way ANOVA and Tukey’s studentized range test). Gil et al. (2008).. Table 2. Experiment 2. Effect of short-term drought on the maximum electrical potential difference between the base of the stem and the leaf petiole (abs ΔVL-S; absolute value) and stomatal conductance difference (gs). Treatment Control Drought Significance. abs VL-S maximum difference (mV) 5.2 ± 1.03 20.8 ± 5.5 *. gs (cm s-1) -0.013 ± 0.01 -0.069 ± 0.01 **. Values are means value ± SE (n=5). One asterisk indicates significant difference between treatments at P≤0.05 (T-test); two asterisks indicate significant difference between treatments at P≤0.01 (T-test). The absolute values of VL-S difference (abs VL-S maximum difference) were analyzed with the purpose of not taking the direction of the signal into account, but the magnitude of the electrical voltage change. Gil et al. (2009).. 376.
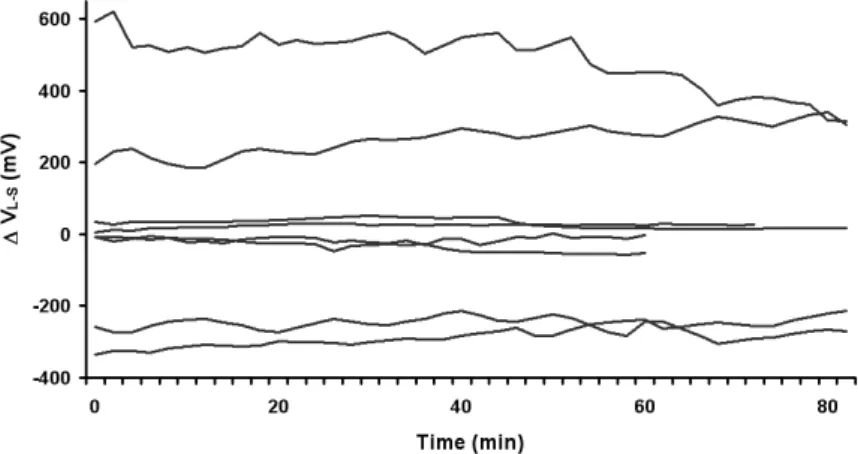
(8) Figures. Fig. 1. Experiment 1: Voltage difference between the leaf petiole and the base of the stem (VL-S) in 8 control plants within 80 min. Gil et al. (2008).. 150 100. VL-S (mV). 50 0 -50 -100 -150 -200 0. 10. 20. 30. 40. 50. 60. 70. 80. Time (min). Fig. 2. Experiment 1: Effects of different treatments on ΔVL-S (mV). Each data point represents the mean value (n=8). Control, wet, dry. The arrow indicates the beginning of each treatment.. 377.
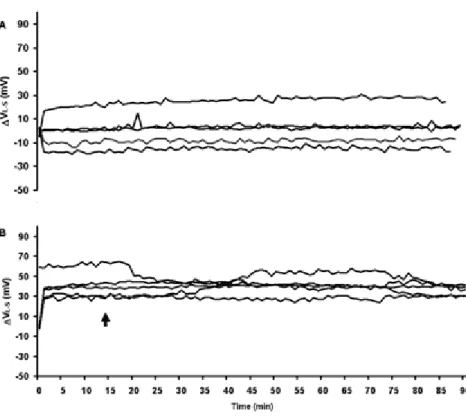
(9) Fig. 3. Experiment 2. A: VL-S of 5 control plants for 90 min. B: VL-S of 5 plants in the drought treatment from 15 to 90 min. Data were collected at 2 Hz and plotted at 1 min intervals. The arrows indicate the beginning of treatment. Gil et al. (2009).. 378.
(10)
Figure
Documento similar