The effects of temperature on the gas exchange cycle in Agathemera crassa
5
0
0
Texto completo
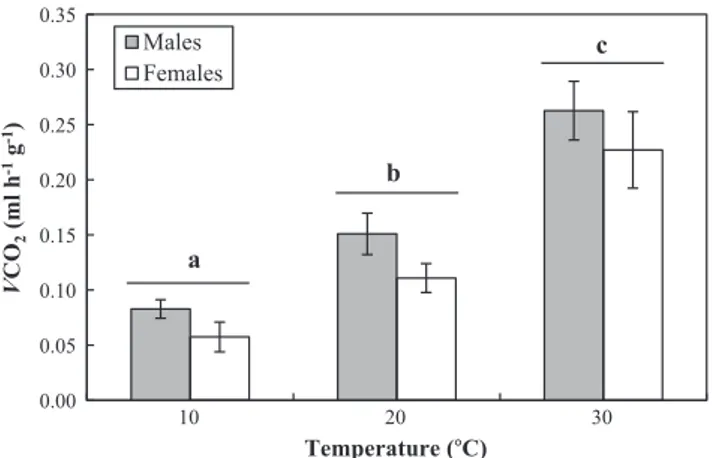
(2) M. Thienel et al. / Comparative Biochemistry and Physiology, Part A 183 (2015) 126–130. 127. this work we tested the effect of ambient temperature on the appearance of different gas exchange patterns in Agathemera crassa (Phasmatodea). Thus with an increase in temperature, it is expected a transition between patterns associated to the variation of cycle components (period, frequency and amplitude), from DGE, going by CGE and finally to CoGE. It is also expected that DGE will be more pronounced during rest periods, and disappear or be modified to CoGE or CGE during activity periods. We studied this problem in the hemimetabolous phasmid A. crassa (Phasmatodea: Agathemeridae) from the Andes range. the presence of phases C and F. In contrast, when N 30% of data points are above the average line, the gas exchange pattern termed was CoGE. In those individuals in whose measurement was observed more than one gas exchange pattern, we used the simple majority rule proposed by Terblanche et al. (2008). Evaluated components of those gas exchange patterns that showed cyclicity (DGE and CGE), were CO2 emission rate (VCO2), frequency, period and duration of each phase (O, F and C in DGE, valleys and peak in CGE). The CoGE pattern was only analyzed based on VCO2. We used 10 samples for calculating mean VCO2. 2. Material and methods. 2.4. Statistical analysis. 2.1. Capture and maintenance. Statistical analyses were performed using parametric and nonparametric tests, depending on the type of data and compliance with the assumptions of normality, homoscedasticity and independence. The effect of temperature on mass-specific VCO2 was studied by repeated measures analysis of variance (ANOVA), which was applied after an analysis of covariance (ANCOVA) using body mass (mb) as covariate. To assess the proportion of gas exchange patterns between temperatures we used the Chi-square test. To compare VCO2 between the period of activity and rest, we applied the Wilcoxon test (for pattern and heat treatment). All statistical analyses were conducted using Statistica 6.0 software (Statsoft Inc., Tulsa, OK).. 2.2. Respirometry We followed the respirometric protocol proposed for insects by Chappell and Rogowitz (2000), Lighton and Turner (2004) and Nespolo et al. (2007), consisting of an open continuous flow system (200 ml min−1), in which CO2 and water were removed from the air before the metabolic chamber through columns of barium hydroxide lime (Baralyme®) and calcium sulfate anhydride (Drierite®), respectively. Air entered the metabolic glass chamber (120 ml) located within a photo- and thermo-regulated cabinet. Subsequently, the air flowed through a water vapor analyzer Sable Systems International® (Las Vegas, Nevada, USA), model RH-300, after which the air was filtered with Drierite®, and then passed through a Sable CO2 Systems International®, FOXBOX model, and monitored every 5 s. An average of ten minimum values of CO2 production were selected. Data were corrected by STP and drift (baseline). Finally, data was analyzed using the ExpeData software (Sable Systems International®) version 1.0.3. Measurements of VCO2 were made for 24 h (in order to record periods of activity and rest) at three contrasting ambient temperatures (10, 20 and 30 °C) with a photoperiod L:D = 12:12 h. Each individual was measured only once at one temperature in a random order. Activity period was determined by visual inspection, as the abrupt and sustained increase of CO2 production during dark conditions, while rest period was identified as all the remaining trace during both dark and light conditions.. 3. Results 3.1. CO2 production Increasing temperature caused a significant increase in massspecific VCO2 (ANOVA: F2,30 = 430.83, P b b 0.0001). By controlling for body mass in each temperature treatment, it was observed that both males and females release the same amount of CO2 (ANCOVA at 10 °C: F1,14 = 0.026, P = 0.87. At 20 °C: F1,14 = 0.505, P = 0.49. At 30 °C: F1,14 = 0.006, P = 0.94) (Fig. 1). 3.2. Gas exchange patterns and temperature Among all thermal treatments we observed a dissimilar proportion of gas exchange patterns (Table 1). At 10 °C, we observed only gas exchange patterns with cyclicity: 85% of 20 individuals presented DGE while the remaining 15% exhibited CGE. At 20 °C, insects showed three patterns: 60% of 20 individuals had CoGE, 25% exhibited CGE and 15% showed DGE. Finally, at 30 °C we observed no presence of cyclical patterns—i.e. all twenty individuals exhibited CoGE. We observed significant differences between the proportion of gas exchange patterns 0.35 0.30. VCO2 (ml h-1 g-1). A. crassa use microhabitats under and between rocks, which are generally located near their main food source, the plant Acaena splendens (Rosaceae) (C. Veloso personal observations). A. crassa possesses sexual dimorphism. Indeed, body mass of males and females reaches as maximum of 4 and 13 g, respectively. This species inhabits the Andes in central Chile at 1900–3000 m a.s.l. (Camousseight, 1995; Vera et al., 2012). In this habitat, climate is dry and warm during summer and cold/snowy during winter (Hoffmann et al., 1998). During early austral spring of 2010, we captured a total of 20 adults (10 females and 10 males) from the Andean locality of Lagunillas (33°25′S; 71° 28′W, at 2400 m a.s.l.) in central Chile. Once transferred to the laboratory, animals were placed in plastic boxes separated by sex within thermocontrolled chambers with daily photoperiods L:D = 12:12 at fluctuating temperatures ranging from 20 to 5 °C (these fluctuations are similar to natural conditions) and fed ad libitum with fresh food (A. splendens). Body mass (mb) for males was on average 2.4 ± 0.34 and for females it was 5.68 ± 0.84 g.. Males Females. c. 0.25. b. 0.20 0.15. a. 0.10 0.05. 2.3. Determining patterns of gas exchange Records of CO2 production were categorized as continuous, cyclic or discontinuous first by inspection, and then according to the method proposed by Marais et al. (2005): from the raw VCO2 trace, the gas exchange pattern was termed CGE or DGE when b30% of data points lay above the average VCO2 line, then DGE is readily identified due to. 0.00. 10. 20. 30. Temperature (°C) Fig. 1. Temperature effect on CO2 production rate. Values are indicated as mean ± SD. Different letters correspond to significant differences between thermal treatments given by repeated measurements ANOVA..
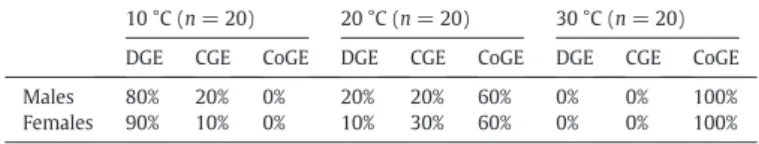
(3) 128. M. Thienel et al. / Comparative Biochemistry and Physiology, Part A 183 (2015) 126–130. Table 1 Percentage of the presence of gas exchange patterns in males and females of Agathemera crassa in the measured temperatures. 10 °C (n = 20). Males Females. 20 °C (n = 20). Table 3 Descriptive results (mean ± SD values) of the discontinuous gas exchange pattern. DGE. 30 °C (n = 20). DGE. CGE. CoGE. DGE. CGE. CoGE. DGE. CGE. CoGE. 80% 90%. 20% 10%. 0% 0%. 20% 10%. 20% 30%. 60% 60%. 0% 0%. 0% 0%. 100% 100%. among treatments (X2 = 48.45, df = 4, P b b 0.0001). At 10 °C there was a significant presence of cyclical patterns (DGE and CGE) in comparison to 20 °C and even more to 30 °C (Table 2). Also, these patterns were more frequent at 20 °C than at 30 °C. There were no significant differences of the proportion of gas exchange patterns between males and females in any temperature (X2 = 0.925, df = 5, P = 0.97). The presence of DGE was observed at 10 and 20 °C only at rest, where we identified the three phases that characterize this breathing pattern (Table 3). However, although VCO2 values were closed to zero during the C phase, CO2 values never reached absolute zero. Fig. 2A and B shows two records representing DGE at 10 and 20 °C, respectively. In terms of the effect of temperature on the DGE components, we observed a direct and significant effect over amplitude (Mann–Whitney test Z = − 2.268, P b 0.023) and cycle frequency (Z = − 2.646, P b 0.008) with an increase of 1.5- and 2.5-fold, respectively. The presence of CGE was observed at 10 and 20 °C, only at rest. It was possible to identify both valleys and peaks of CO2 production, regularly distributed over the record (Table 4). Fig. 2C and D shows two representative records of CGE, at 10 and 20 °C, respectively. We observed a direct and significant dependence of temperature on the cycle frequency (Z = − 2.23, P b 0.025), with a 3-fold increase in value between 10 and 20 °C. Inversely, the cycle period dropped with temperature (Z = 2.23, P b 0.025), decreasing approximately 2.5-fold from 10 to 20 °C. No differences were found in peak amplitudes between 10 and 20 °C in this pattern (Z = −1.64, P = 0.1). The CoGE pattern was recorded both at rest as well during activity periods. During rest, CoGE was only observed at 20 and 30 °C, while during activity, this pattern was always present in all thermal treatments. Table 5 describes mean values of VCO2 at 20 and 30 °C, and Fig. 2E and F shows two representative records of CoGE patterns at rest. Regarding CO2 production during activity, it was observed that at 10 °C, 14 of 17 individuals who exhibited respiratory discontinuity (DGE) at rest changed their trace to a continuous one (CoGE); disappearing the cycle and its phases (Fig. 3). The 3 individuals remaining showed no activity period, keeping DGE throughout all measurement. Also, all those individuals who exhibited CGE at rest changed their CO2 production to CoGE in activity. Metabolic rate during activity at 10 °C in individuals who had DGE was significantly greater than at rest (Wilcoxon test: Z = 3.30, P b 0.001). Nevertheless a note of caution is necessary here. The idea that CO2 did not reach zero between peaks should also be a result of the low flow rate that was used. Because no significant differences in metabolic rates between individuals with different gas exchange patterns (DGE, CGE and CoGE) were found, we performed an analysis that considered all individuals measured at 20 °C in which it was possible to distinguish their activity period. The Wilcoxon test for paired samples showed significant differences in metabolic rate between the two periods (Z = 3.82, P = 0.0001), with a total increase in metabolic rate of 65%. Finally, individuals measured at 30 °C (all showed CoGE) whose periods of activity could be Table 2 Chi-square for gas exchange patterns proportion presented in the temperatures measured. Treatment (°C). Chi-square (X2). df. p. 10–20 10–30 20–30. 22.3 40.0 10.0. 2 2 2. bb0.00001 bb0.0001 0.007. 10 °C. 20 °C. Males (n = 8) Females (n = 9). Males (n = 2). Females (n = 1). Mb (g) VCO2 ((ml h−1) Amplitude (ml. 2.33 ± 0.23 0.16 ± 0.02 0.55 ± 0.23. 5.75 ± 0.86 0.29 ± 0.07 1.05 ± 0.48. 2.33 ± 0.18 0.31 ± 0.03 0.77 ± 0.16. 5.49 ± (−) 0.61 ± (−) 2.13 ± (−). h−1) Frequency (mHz) Period (h). 0.24 ± 0.14 1.98 ± 1.20. 0.19 ± 0.07 1.78 ± 0.56. 0.92 ± 0.44 0.38 ± 0.15. 0.88 ± (−) 0.35 ± (−). C phase Duration (min) VCO2 (ml h−1). 21.90 ± 7.95 0.08 ± 0.02. 28.14 ± 11.07 0.14 ± 0.06. 6.89 ± 1.96 0.12 ± 0.01. 6.34 ± (−) 0.18 ± (−). F phase Duration (min) VCO2 (ml h−1). 82.48 ± 55.40 74.58 ± 49.40 12.14 ± 4.74 10.91 ± (−) 0.10 ± 0.02 0.19 ± 0.08 0.18 ± 0.03 0.28 ± (−). O phase Duration (min) VCO2 (ml h−1). 16.53 ± 2.59 0.40 ± 0.10. 19.04 ± 1.59 0.76 ± 0.24. 11.32 ± 2.82 0.56 ± 0.08. 7.59 ± (−) 1.22 ± (−). detected showed significant differences in metabolic rate between the period of activity and resting (Wilcoxon: Z = 2.67, P = 0.008), with a total increase in metabolic rate of 53%. 4. Discussion A. crassa exhibited the 3 gas exchange patterns described in the literature. Ambient temperature and activity period determined when these patterns were displayed by these insects. The presence of the DGE pattern was associated with low and moderate temperatures (10 and 20 °C), with great predominance at 10 °C but only at rest (Figs. 1, 2 and 3). We identified this gas exchange pattern although CO2 release values never reached zero, because it is assumed that part of this molecule is released via cuticle, above all considering the large body size of this species. The CGE pattern was exhibited at the same temperatures as DGE, also at rest; however, it was not dominant. The appearance of the CoGE was associated with moderate and high temperatures (20 and 30 °C) and both during rest and activity periods. DGE (and CGE) was displayed only during the resting phase (daytime). During the period of activity (nighttime) all cyclicity disappeared, modifying production to a continuous CO2 release, with a consequent increase in metabolic rate. The foregoing agrees with Chown (2011), indicating that patterns with cycles have always been observed at rest. The influence of temperature on the components of the gas exchange cycles in insects has been well documented (Davis et al., 1999; Chappell and Rogowitz, 2000; Lighton and Joos, 2002; Chown and Davis, 2003; Contreras and Bradley, 2010, among others). As expected for ectotherms, they all agree that an increase in temperature, with a consequent increase in metabolic rate, is accompanied by an increase in frequency and a decrease in the duration of phases. In A. crassa the behavior of the components of the DGE and CGE cycles according to temperature is quite similar to those described in the literature. In particular, the cycle duration of this phasmid DGE was determined mainly by phase C + F, corresponding to 85 and 66% of the total cycle at 10 and 20 °C respectively, while phase O contributed to a low ratio. However, although the O phase occupied a small fraction of the DGE, values of VCO2 production rate were always high, thus showing that it is during this phase that the greatest gas exchange cycle occurs, in agreement with the reports of Lighton (1996), Chown et al. (2006) and Quinlan and Gibbs (2006). Our results support the idea that gas exchange patterns are not distinct but correspond to a transition of respiratory responses as a.
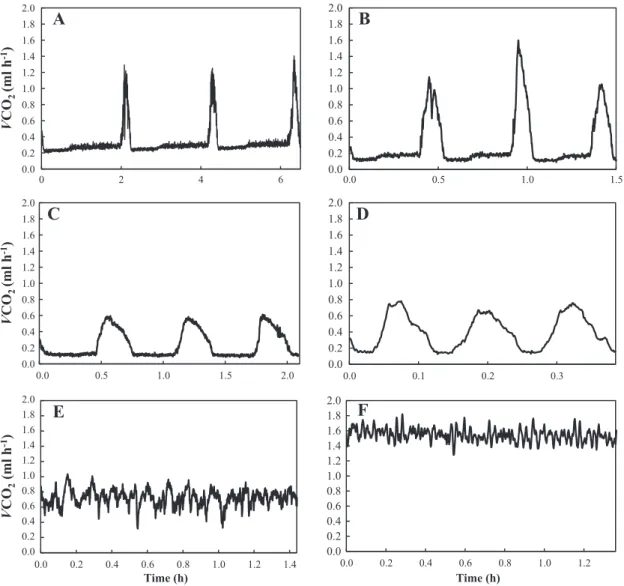
(4) M. Thienel et al. / Comparative Biochemistry and Physiology, Part A 183 (2015) 126–130. 2.0. VCO2 (ml h-1). 2.0 1.8 1.6 1.4 1.2 1.0 0.8 0.6 0.4 0.2 0.0. A. 1.8 1.6 1.4 1.2 1.0 0.8 0.6 0.4 0.2 0.0 2.0. VCO2 (ml h-1). 1.8. 0. 2. 4. 6. C. 1.6 1.4 1.2 1.0 0.8 0.6 0.4 0.2. VCO2 (ml h-1). 0.0. 0.0. 2.0 1.8 1.6 1.4 1.2 1.0 0.8 0.6 0.4 0.2 0.0 0.0. 0.5. 1.0. 1.5. 2.0. E. 0.2. 0.4. 0.6. 0.8. Time (h). 1.0. 1.2. 1.4. 2.0 1.8 1.6 1.4 1.2 1.0 0.8 0.6 0.4 0.2 0.0. 129. B. 0.0. 0.5. 1.0. 1.5. D. 0.0. 2.0 1.8 1.6 1.4 1.2 1.0 0.8 0.6 0.4 0.2 0.0. 0.0. 0.1. 0.2. 0.3. F. 0.2. 0.4. 0.6. 0.8. 1.0. 1.2. Time (h). Fig. 2. Representative examples of gas exchange patterns at three temperatures: DGE at 10 °C (A), DGE at 20 °C (B), CGE at 10 °C (C), CGE at 20 °C (D), CoGE at 20 °C (E) and CoGE at 30 °C (F).. continuum that starts from DGE, goes by CGE and finishes in CoGE, which is driven by the increase of metabolic demand experienced by the insect and whose values would vary so that it would not be possible to consider them as a discrete feature (Bradley, 2007; Contreras and Bradley, 2010; Contreras and Bradley, 2011). Thus, gas exchange pattern transition would be explained by spiracular dynamics, which are mediated by ambient temperature (Lehmann and Schützner, 2010). Table 4 Descriptive results (mean ± SD values) of the cyclic gas exchange pattern. CGE. 10 °C Males (n = 2). Mb (g) VCO2 (ml h−1) Amplitude (ml h−1) Frequency (mHz) Period (h). 20 °C Females (n = 1). Males (n = 2). Females (n = 3). 2.70 ± 0.64 0.06 ± 0.01 0.35 ± 0.17 0.56 ± 0.01 0.57 ± 0.02. 5.02 ± (−) 0.07 ± (−) 0.35 ± (−) 0.44 ± (−) 0.63 ± (−). 2.40 ± 0.20 0.10 ± 0.04 0.36 ± 0.03 2.30 ± 0.34 0.13 ± 0.01. 5.75 ± 0.72 0.13 ± 0.07 1.27 ± 0.74 1.83 ± 0.01 0.15 ± 0.01. Valley Duration (min) VCO2 (ml h−1). 15.53 ± 6.90 0.10 ± 0.01. 19.79 ± (−) 0.11 ± (−). 2.96 ± 0.95 0.16 ± 0.006. 2.37 ± 0.56 0.22 ± 0.06. Peak Duration (min) VCO2 (ml h−1). 18.03 ± 4.24 0.31 ± 0.07. 20.19 ± (−) 3.58 ± (−). 5.67 ± 0.23 0.48 ± 0.02. 6.91 ± 0.34 0.85 ± 0.40. and where DGE predominates at low demand, when closed spiracles are the norm. Then, as metabolic demand increases, gas exchange would become cyclical, with the spiracles not completely closed. Finally, CoGE occurs during high metabolic demand when the spiracles are open. In addition, Basson and Terblanche (2011) proposed that variation in gas exchange patterns at short time scales would be given by the interaction between cellular metabolic demand and the structural and physiological design of the system of gas exchange (spiracular tracheal system and behavior) and by the buffering capacity of CO2. However, we also observed the presence of two or three different patterns at the same temperature. Hadley and Quinlan (1993), Williams and Bradley (1998) and Williams et al. (2010) postulated that marginal differences in some cycle components, as well in metabolic rate, do not necessarily differ between gas exchange patterns, making it difficult to determine a pattern (especially between DGE and CGE). Table 5 Descriptive results (mean ± SD values) of the continuous gas exchange pattern. CoGE. Mb (g) Mean VCO2 (ml h−1). 20 °C. 30 °C. Males (n = 6). Females (n = 6). Males (n = 10). Females (n = 10). 2.28 ± 0.24 0.37 ± 0.06. 5.68 ± 1.03 0.72 ± 0.22. 2.40 ± 0.34 0.67 ± 0.11. 5.68 ± 0.84 1.54 ± 0.39.
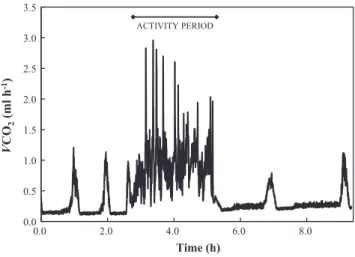
(5) 130. M. Thienel et al. / Comparative Biochemistry and Physiology, Part A 183 (2015) 126–130. 3.5 ACTIVITY PERIOD. 3.0. VCO2 (ml h-1). 2.5 2.0 1.5 1.0 0.5 0.0 0.0. 2.0. 4.0. 6.0. 8.0. Time (h) Fig. 3. Representative example of DGE loss during the activity period of A. crassa.. When the activity period starts cycles despair. This suggests that during this period insect requires a higher ventilation due to an increase in metabolic demand. When the activity period finishes and the insects are at metabolic rest then, gas exchange returns to cyclicity. This phenomenon seems to be associated with locomotion cost (Chown and Nicolson, 2004; Harrison et al., 1991). Support for this hypothesis does not mean that other hypotheses are not acting, because there are multiple independent evolutionary origins explaining the emergence of DGE and not a single function underlying their genesis (Matthews and White, 2012). Thus, it remains open the interesting possibility to test multiples ambient factors that can be acting in gas exchange patterns transition in A. crassa, as for instance, hypoxia and hypercapnia, given the underground Andean environment that this species inhabit. Finally, the display of DGE in A. crassa mainly at both conditions low ambient temperature and at rest could imply that this pattern is underestimated in other taxa including insects and arthropods, because studies are conducted under conditions where DGE not necessarily would be expressed. Based in the phylogeny proposed by Marais et al. (2005) concerning the origin of DGE, this is the first empirical record of DGE in the order Phasmatodea. List of abbreviations. CGE CoGE DGE Mb VCO2. cyclic gas exchange continuous gas exchange discontinuous gas exchange body mass rate of CO2 production. Acknowledgments We thank Lafayette Eaton, who provided useful comments. Also, we thank three anonymous reviewers who improve the manuscript. This work was supported by Fondo Nacional de Desarrollo Científico y Tecnológico, grants 1080072 (C.V.) and 1130015 (F.B.). References Basson, C.H., Terblanche, J.S., 2011. Respiratory pattern transitions in three species of Glossina (Diptera, Glossinidae). J. Insect Physiol. 57, 433–443. Bradley, T.J., 2007. Control of the respiratory pattern in insects. Adv. Exp. Med. Biol. 618, 211–228.. Buck, J., Keister, M., Specht, H., 1953. Discontinuous respiration in diapausing Agapema pupae. Anat. Rec. 117, 541. Camousseight, A., 1995. Revisión Taxonómica del Género Agathemera (Phasmatodea: Pseudophasmatidae) en Chile. Rev. Chil. Entomol. 22, 35–53. Chappell, M.A., Rogowitz, G.L., 2000. Mass, temperature and metabolic effects on discontinuous gas exchange cycles in eucalyptus-boring beetles (Coleoptera: Creambycidae). J. Exp. Biol. 203, 3809–3820. Chown, S.L., 2011. Discontinuous gas exchange: new perspectives on evolutionary origins and ecological implications. Funct. Ecol. 25, 1163–1168. Chown, S.L., Davis, A.L., 2003. Discontinuous gas exchange and the significance of respiratory water loss in scarabaeine beetles. J. Exp. Biol. 206, 3547–3556. Chown, S.L., Holter, P., 2000. Discontinuous gas exchange cycles in Aphodius fossor (Scarabaeidae): a test of hypotheses concerning origins and mechanisms. J. Exp. Biol. 203, 397–403. Chown, S.L., Nicolson, S.W., 2004. Insect physiological ecology. Mechanisms and Patterns. Oxford University Press. Chown, S.L., Gibbs, A.G., Hetz, S.K., Klok, C.J., Lighton, J.R.B., Marais, E., 2006. Discontinuous gas exchange in insects: a clarification of hypothesis and approaches. Physiol. Biochem. Zool. 79, 333–343. Contreras, H.L., Bradley, T.J., 2010. Transitions in insects respiratory patterns are controlled by changes in metabolic rate. J. Insect Physiol. 56, 522–528. Contreras, H.L., Bradley, T.J., 2011. The effect of ambient humidity and metabolic rate on the gas-exchange pattern of the semi-aquatic insect Aquarius remigis. J. Exp. Biol. 214, 1086–1091. Davis, A.L., Chown, S.L., Scholtz, C.H., 1999. Discontinuous gas-exchange cycles in Scarabaeus dung beetles (Coleptera: Scarabaeidae): mass-scaling and temperature dependence. Physiol. Biochem. Zool. 72 (5), 555–565. Gibbs, A.G., Johnson, R.A., 2004. The role of discontinuous gas exchange in insects: the chthonic hypothesis does not hold water. J. Exp. Biol. 207, 3477–3482. Hadley, N.F., Quinlan, M., 1993. Discontinuous carbon dioxide release en the eastern lubber grasshopper Romalea guttata and its effect on respiratory transpiration. J. Exp. Biol. 177, 169–180. Harrison, J.F., Phillips, J.E., Gleeson, T.T., 1991. Activity physiology of the two-striped grasshopper, Melanoplus bivittatus: gas exchange, hemolymph acid–base status, lactate production, and the effect of temperature. Physiol. Zool. 64, 451–472. Harrison, J.F., Camazine, S., Marden, J.H., Kirkton, S.D., Rozo, A., Yang, X., 2001. Mite not make it home: tracheal mites reduce the safety margin for oxygen delivery of flying honeybees. J. Exp. Biol. 204, 805–814. Hetz, S.K., Bradley, T., 2005. Insects breathe discontinuously to avoid oxygen toxicity. Nature 433, 513–519. Hoffmann, A., Arroyo, M., Liberona, F., Muñoz, M., Watson, J., 1998. Plantas altoandinas en la Flora Silvestre de Chile. Ediciones Fundación Claudio Gay, Santiago de Chile. Lehmann, F.O., Schützner, P., 2010. The respiratory basis of locomotion in Drosophila. J. Insect Physiol. 56, 543–550. Levy, R.I., Schneiderman, H.A., 1966. Discontinuous respiration in insects II. The direct measurement and significance of changes in tracheal gas composition during respiratory cycle of silkworm pupae. J. Insect Physiol. 12, 83–104. Lighton, J.R.B., 1996. Discontinuous gas exchange in insects. Annu. Rev. Entomol. 41, 309–324. Lighton, J.R.B., Berrigan, D., 1995. Questioning paradigms: caste-specific ventilation in harvester ants, Messor pergandei and M. julianus (Hymenoptera: Formicidae). J. Exp. Biol. 198, 521–530. Lighton, J.R.B., Joos, B., 2002. Discontinuous gas exchange in a tracheate arthropod, the pseudoscorpion Garypus californicus: occurrence, characteristics and temperature dependence. J. Insect Sci. 2, 23–27. Lighton, J.R.B., Turner, R., 2004. Thermolimit respirometry: an objective assessment of critical thermal maxima in two desert harvester ants, Pogonomyrmex rugosus and P. californicus. J. Exp. Biol. 207, 1903–1913. Marais, E., Klok, C.J., Terblanche, J.S., Chown, S.L., 2005. Insect gas exchange patterns: a phylogenetic perspective. J. Exp. Biol. 208, 4507–4516. Matthews, P.G.D., White, C.R., 2011. Discontinuous gas exchange in insects: is it all in their heads? Am. Nat. 177, 130–134. Matthews, P.G.D., White, C.R., 2012. Discontinuous gas exchange, water loss, and metabolism in Protaetia cretica (Cetoniinae, Scarabaeidae). Physiol. Biochem. Zool. 85 (2), 174–182. Nespolo, R.F., Artacho, P., Castañeda, L.E., 2007. Cyclic gas-exchange in the Chilean red cricket: inter-individual variation and thermal dependence. J. Exp. Biol. 210, 668–675. Quinlan, M.C., Gibbs, A.G., 2006. Discontinuous gas exchange in insects. Respir. Physiol. Neurobiol. 54, 18–29. Schneiderman, H.A., 1960. Discontinuous respiration in insects—role of the spiracles. Biol. Bull. 119, 494–528. Terblanche, J.S., Marais, E., Hetz, S.K., Chown, S.L., 2008. Control of discontinuous gas exchange in Samia cynthia: effects of atmospheric oxygen, carbon dioxide and moisture. J. Exp. Biol. 211, 3272–3280. Vera, A., Pastenes, L., Veloso, C., Méndez, M., 2012. Phylogenetic relationships in the genus Agathemera (Insecta: Phasmatodea) inferred from the genes 16S, COI and H3. Zool. J. Linnean Soc. Lond. 165, 63–72. Williams, A.E., Bradley, T., 1998. The effect of respiratory pattern on water loss in desiccation-resistant Drosophila melanogaster. J. Exp. Biol. 201, 2953–2959. Williams, C.M., Pelini, S.L., Hellmann, J.J., Sinclair, B.J., 2010. Intra-individual variation allows an explicit test of the hygric hypothesis for discontinuous gas exchange in insects. Biol. Lett. 6, 274–277..
(6)
Figure
Documento similar
The expansionary monetary policy measures have had a negative impact on net interest margins both via the reduction in interest rates and –less powerfully- the flattening of the
[20] observed for the pyrolysis of rice husk (at a peak temperature of 700 °C in a fixed-bed reactor) that the yields of char and gas increased with elevating the pressure from
The use of bimetallic catalysts of Pd and Pt in the gas-phase HDC of DCM results in a synergistic effect respect the catalytic activity when compared to the monometallic ones, that
At the same time, however, it would also be misleading and simplistic to assume that such Aikido habituses were attained merely through abstracted thought
In this paper, a series of annealing experiments of ultrafine-grained WC–Co materials were conducted, and the effects of the annealing temperature and holding time on the
In the present study we assessed the possible effects of changing duration of pre-heading phases (the leaf and spikelet initiation phase, LS, SE and total time
In this paper, the effects of economic growth and four different types of energy consumption (oil, natural gas, hydroelectric- ity, and renewable energy) on environmental quality
The model with power-law density profile (Col. 4 in Table 6) gives the best overall fit to the SED, ISO-SWS spectrum and line emission (see Fig. 4), with quite different disc
