Measurement of the Z/gamma* boson transverse momentum distribution in pp collisions at root s=7 TeV with the ATLAS detector
47
0
0
Texto completo
(2) Contents 1. 2 QCD predictions. 2. 3 The ATLAS detector. 3. 4 Event simulation. 4. 5 Event reconstruction and selection. 5. 6 Background estimation. 5. 7 Unfolding and systematic uncertainties. 7. 8 Results. 10. 9 Comparison to QCD predictions. 10. 10 Tuning of PYTHIA8 and POWHEG + PYTHIA8. 19. 11 Conclusion. 26. The ATLAS collaboration. 31. 1. Introduction. The transverse momentum distribution of W and Z bosons produced in hadronic collisions is a traditional probe of strong interaction dynamics. The low transverse momentum (pT ) range is governed by initial-state parton radiation (ISR) and the intrinsic transverse momentum of the initial-state partons inside the proton, and modeled using soft-gluon resummation [1] or parton shower models [2, 3]. Quark-gluon scattering dominates at high pT and is described by perturbative QCD [4–6]. The correct modelling of the vector boson pT distribution is important in many physics analyses at the LHC for which the production of W or Z bosons constitutes a significant background. Moreover, it is crucial for a precise measurement of the W boson mass. The transverse momentum distribution also probes the gluon density of the proton [7]. Vector boson pT distribution measurements were published by ATLAS [8, 9] and CMS [10] based on 35–40 pb−1 of proton-proton collisions √ at a centre-of-mass energy of s = 7 TeV. The typical precision of these measurements is 4% to 10%.. –1–. JHEP09(2014)145. 1 Introduction.
(3) 2. QCD predictions. The measurements are compared to a representative set of theoretical predictions. They rely on perturbative QCD (pQCD) only, or include resummation of soft-gluon emissions. Resummation is treated either analytically, or using Monte Carlo methods. Fully differential inclusive boson-production cross sections can be obtained to second order in the strong coupling constant αS (NNLO) using the Fewz3.1 [4–6] and Dynnlo1.3 [18, 19] programs. The O(αS2 ) cross-section predictions are valid at large pZ T, Z where the cross section is dominated by the radiation of high-pT gluons. At low pT , multiple soft-gluon emissions predominate and fixed-order pQCD predictions are not appropriate. The ResBos calculation relies on soft-gluon resummation at low pZ T and matches the 2 O(αS ) cross section at high pZ . It simulates the vector boson decays but does not include T a description of the hadronic activity in the event. Two versions are used here, which differ in the non-perturbative parameterization used to perform the resummation. The 1. φ?η is defined as tan(φacop /2) sin θη? , with φacop = π − ∆φ and θη? = tanh[∆η/2], ∆φ the opening angle between the Z boson decay leptons in the transverse plane, and ∆η = η − − η + the difference in pseudorapidity between the negatively and positively charged lepton.. –2–. JHEP09(2014)145. This paper presents a measurement of the normalized Z boson transverse momentum ∗ + − and Z/γ ∗ → µ+ µ− distribution (pZ T ) with the ATLAS detector, in the Z/γ → e e channels, using LHC proton-proton collision data taken in 2011 at a centre-of-mass energy √ of s = 7 TeV and corresponding to an integrated luminosity of 4.7 fb−1 [11]. The large integrated luminosity allows the measurement to be performed in three different Z boson rapidity (yZ ) bins, probing the transverse momentum dynamics over a wide range of the initial-state parton momentum fraction. With respect to previous results, the present analysis aims at reduced uncertainties, finer binning and extended measurement range. Reconstructed from the final-state lepton kinematics, pZ T is affected by lepton energy and momentum measurement uncertainties. To minimize the impact of these uncertainties, the φ?η observable1 was introduced as an alternative probe of pZ T [12], pioneered at the Tevatron [13–15], and studied by ATLAS using the present data set [16] and LHCb [17]. The correlation between φ?η and pZ T is, however, only partial and the good experimental ? resolution on φη is counterbalanced by a reduced sensitivity to the underlying transverse momentum distribution; in addition, interpreting φ?η as a probe of pZ T assumes that the final-state lepton angular correlations are correctly modeled. The measurement presented in this paper allows the effects of the Z boson transverse momentum and the lepton angular correlations to be disentangled unambiguously. QCD predictions for the pZ T distribution are described in the next section. After a brief description of the experiment in section 3, the measurement is presented in sections 4–8. The results are compared to available QCD predictions in section 9 and used to constrain phenomenological models describing the low-pZ T region in section 10; the compatibility of ? Z the φη measurement with the pT -constrained models is also tested. Section 11 concludes the paper..
(4) 3. The ATLAS detector. ATLAS [26] is a multipurpose detector2 consisting of an inner tracking system (ID) inside a 2 T superconducting solenoid, electromagnetic and hadronic calorimeters and, outermost, a toroidal large acceptance muon spectrometer (MS), surrounding the interaction point with almost full coverage. The ID allows precision tracking of charged particles for |η| < 2.5. The three innermost layers constitute the pixel detector. The semiconductor tracker, at intermediate radii, consists of four double-sided silicon strip layers allowing reconstruction of three-dimensional space points. The outer layers, made of straw tubes sensitive to transition radiation, complete the momentum measurement for |η| < 2 and provide ability to distinguish electrons from pions. The calorimeters between the ID and the MS measure the energy of particles in the range |η| < 4.9. The high-granularity electromagnetic (EM) calorimeter is made of lead absorbers immersed in a liquid-argon active medium, and is divided into barrel (|η| < 1.5) and end-cap (1.4 < |η| < 3.2) regions. For |η| < 2.5, it is finely segmented in η and φ for position measurement and particle identification purposes, and has three layers in depth to enable longitudinal EM-shower reconstruction. The hadronic calorimeter surrounding the EM calorimeter is divided into a central part covering |η| < 1.7, made of alternating 2. ATLAS uses a right-handed coordinate system with its origin at the nominal interaction point (IP) in the centre of the detector and the z-axis along the beam pipe. The x-axis points from the IP to the centre of the LHC ring, and the y-axis points upward. Cylindrical coordinates (r, φ) are used in the transverse plane, φ being the azimuthal angle around the beam pipe. The pseudorapidity is defined in terms of the polar angle θ as η = − ln tan(θ/2).. –3–. JHEP09(2014)145. original parameterization [1] and a recent development [20] are referred to as ResBosBLNY (NLO+NNLL) and ResBos-GNW (NNLO+NNLL), respectively, in this paper. Further predictions at O(αS2 ) and including resummation terms at next-to-next-to-leadinglogarithmic accuracy (NNLO+NNLL) were also obtained [21], primarily focusing on the φ?η observable. The Pythia [2] and Herwig [3] generators use the parton shower approach to describe the low-pZ T region and include an O(αS ) matrix element for the emission of one hard parton. The NLO Monte Carlo generators Mc@nlo [22] and Powheg [23] consistently incorporate NLO QCD matrix elements into the parton shower frameworks of Herwig or Pythia. The Alpgen [24] and Sherpa [25] generators implement tree-level matrix elements for the generation of multiple hard partons in association with the boson for various parton multiplicities. The generators listed above are used in performing the measurement, as described in section 4. The generators contain phenomenological parameters which are not constrained by the theory but can be adjusted to improve their description of the measured distributions. The ATLAS measurement is thus compared to the current state-of-the-art models. In section 10, the low-pZ T region is used to adjust the parton shower parameters in Pythia, used as full event generator or interfaced to Powheg..
(5) steel and plastic scintillator tiles, and end-cap (1.5 < |η| < 3.2) and forward (|η| < 4.9) sections included in the liquid argon end-cap cryostats, and using copper and tungsten as absorbing material, respectively. The MS, covering a range of |η| < 2.7, consists of three stations of drift tubes and cathode-strip chambers, which allow precise muon track measurements and of resistiveplate and thin-gap chambers for muon triggers and additional measurements of the φ coordinate.. Event simulation. The response of the ATLAS detector to generated Monte Carlo (MC) events is simulated [27] using Geant4 [28] for the description of the ATLAS detector geometry, and the interaction of particles with the material defined by that geometry. These samples are used to model the signal, estimate the backgrounds and to correct the observed pZ T spectrum for detector effects back to the particle level, a procedure hereafter referred to as unfolding. The MC signal samples used as baseline for the measurement are obtained using the Powheg generator version r1556 interfaced with Pythia6.425 to model the parton shower, hadronization and underlying event with parameters set according to tune AUET2B [29]. Powheg events are generated using the CT10 parton distribution function (PDF) set [30]. The predicted pZ T distribution is then modified to match that of Pythia6.425 with the AMBT1 tune [31], denoted by Pythia6-AMBT1, which agrees with the data within 5% accuracy [8]. These samples are referred to as Powheg+Pythia6. Additional signal samples, used for comparison, are based on Pythia6.425 with tune AUET2B and PDF set MRSTMCal [32] (referred to as Pythia6-AUET2B); [email protected] with the CT10 PDF set, interfaced to Herwig6.520 to model the parton shower and hadronization, and to Jimmy4.31 [33] for the simulation of multiple interactions, with parameters set according to tune AUET2 [34]; and finally Sherpa1.4.0 with the CT10 PDFs. The MC generators used in tuning studies described in section 10 are Pythia version 8.176 [35, 36] and Powheg version r2314. Background processes include W ± → `± ν, Z → τ + τ − and bb̄, cc̄ → `± + X and are generated with Pythia6-AUET2B. The tt̄ background sample is based on Mc@nlo interfaced to Herwig+Jimmy. Backgrounds from weak boson pair production are simulated using Herwig+Jimmy, tuned with AUET2. All generators are interfaced to Photos2.154 [37] and Tauola2.4 [38] to simulate QED final-state radiation (FSR) and τ -lepton decays, except Sherpa and Pythia8, which rely on their internal treatment. Photoninduced dilepton production, i.e. the double dissociative process q q̄ → `+ `− and inelastic photon-induced pp → `+ `− , is simulated using Horace [39] and Herwig++ [40], interfaced to the MRST2004qed PDFs [41]. The MC events are simulated with additional interactions in the same or neighbouring bunch crossings to match the pile-up conditions during LHC operation, and are weighted to reproduce the distribution of the average number of interactions per bunch crossing in data.. –4–. JHEP09(2014)145. 4.
(6) 5. Event reconstruction and selection. 6. Background estimation. The background to the observed Z signal includes contributions from Z/γ ∗ → τ + τ − , W → `ν, gauge boson pair production, single top quark and tt̄ production, and multijet production. The electroweak and top quark background contributions are estimated from simulation and normalized using theoretical cross sections calculated at NNLO accuracy. For the multijet background, which dominates at low pZ T , the leptons originate from semileptonic decays or from hadrons or photons misidentified as electrons, which cannot be simulated accurately and are determined using data-driven methods. In the electron channel, the multijet background fraction is determined from the electron isolation distribution observed in data. The isolation variable, x, is defined as the transverse energy contained in a cone of size ∆R = 0.3 around the electron energy cluster (excluding the electron itself), divided by the electron transverse energy. On average, isolated electrons from Z/γ ∗ → e+ e− decays are expected at lower values of x than multijet background events. The signal distribution, S(x), is given by the simulation and shifted to. –5–. JHEP09(2014)145. Electrons are reconstructed from energy deposits measured in the EM calorimeter and matched to ID tracks. They are required to have pT > 20 GeV and |η| < 2.47 excluding 1.37 < |η| < 1.52, which corresponds to the transition region between the barrel and end-cap EM calorimeters. The electrons are identified using shower shape, track-cluster matching and transition radiation criteria [42]. The Z/γ ∗ → e+ e− event trigger requires two such electrons with pT > 12 GeV. Muons are reconstructed from high-quality MS segments matched to ID tracks. They are required to have pT > 20 GeV, |η| < 2.4 and to be isolated to suppress background from heavy-flavour decays. The isolation requires the sum of transverse momenta of additional tracks with pT > 1 GeV and within a cone of p size ∆R ≡ (∆η)2 + (∆φ)2 = 0.2 around the muon to be less than 10% of the muon pT . The Z/γ ∗ → µ+ µ− event trigger requires one muon with pT > 18 GeV. Events are required to have at least one primary vertex reconstructed from at least three tracks with pT > 500 MeV, and to contain exactly two oppositely charged same flavour leptons, selected as described above, with invariant mass satisfying 66 GeV < m`` < 116 GeV (` = e, µ). This broad interval is chosen to minimize the impact of QED FSR on the signal acceptance. The total selected sample consists of 1228863 Z/γ ∗ → e+ e− and 1816784 Z/γ ∗ → µ+ µ− candidate events. Monte Carlo events are corrected to take into account differences with data in lepton reconstruction, identification and trigger efficiencies, as well as energy and momentum scale and resolution. The efficiencies are determined using a tag-and-probe method based on reconstructed Z and W events [42]. The isolation requirement used in the muon channel induces significant pZ T dependence in the muon selection efficiency, and the efficiency determination is repeated in each pZ T bin. The energy resolution and scale corrections are obtained comparing the lepton pair invariant mass distribution in data and simulation [43, 44]..
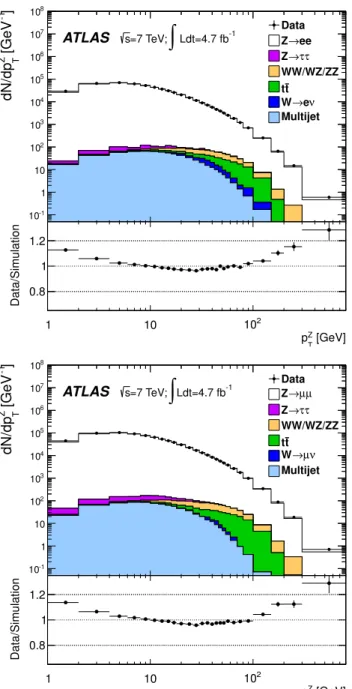
(7) In the muon channel, the multijet background is estimated using muon isolation information in signal- and background-dominated invariant-mass regions. Four two-dimensional regions are defined, characterized by a mass window and according to whether both muons pass or fail the isolation cut described in section 5. The signal region (region A), the two control regions (regions B and C) and the multijet region (region D) are defined as follows: Region A (signal region):. 66 GeV < mµµ < 116 GeV,. isolated. Region B:. 47 GeV < mµµ < 60 GeV,. isolated. Region C:. 66 GeV < mµµ < 116 GeV,. non-isolated. Region D (multijet region):. 47 GeV < mµµ < 60 GeV,. non-isolated. Assuming the mµµ and isolation distributions are not correlated, the number of multijet events in the signal region is determined from the number of events observed in regions B, C and D, as nA = nB × nC /nD , where nB , nC and nD are corrected for the residual contribution from electroweak and top processes. In an alternative method, the multijet background is assumed to be dominated by heavy-flavour decays, and its normalization is derived from the number of observed SS muon pairs, corrected by the expected OS/SS ratio in heavy-flavour jet events, as predicted by Pythia. Since the results of the two methods differ by more than their estimated uncertainty, the background normalization used for this channel is defined as the average of the two computations, and its uncertainty as their half difference, giving an expected fraction of (0.11 ± 0.06)%. The pZ T shape of the multijet background is defined from the control sample with the inverted isolation cut (region D); using that obtained from the SS sample instead has negligible impact on the measurement result. Figure 1 shows the pZ T distributions for data and Monte Carlo samples including the experimental corrections discussed in section 5 as well as the background estimates, in the electron and muon channels.. –6–. JHEP09(2014)145. match the data in the signal-dominated low-x region. A jet-enriched sample is extracted from data by requiring electron candidates to fail the track-cluster matching or shower shape criteria in the first EM calorimeter layer, but otherwise pass the analysis selections, giving B(x). This distribution is corrected for the residual contribution from electroweak and top quark backgrounds, which are estimated using simulation. The multijet background normalization is then given by a fit of D(x) = qB(x) + (1 − q)S(x), where D(x) is the isolation distribution observed in data and q is the fitted background fraction. The above procedure is repeated, separating events with same charge sign (SS) and opposite charge sign (OS) leptons in the background-enriched sample, and varying ∆R between 0.2 and 0.4. The average of the results and their envelope define the multijet background Z fraction and its uncertainty, yielding q = (0.14+0.10 −0.05 )%. The pT shape of the background is assumed to follow that of the background-enriched sample; this assumption is verified by repeating the procedure in three coarse pZ T bins. The uncertainty on the shape is defined from the difference between the SS and OS samples..
(8) T. dN/dpZ [GeV -1]. 108 107. ATLAS. s=7 TeV;. ∫ Ldt=4.7 fb. Data Z →ee Z →τ τ WW/WZ/ZZ. -1. 106 105. tt W →eν Multijet. 104 103 102 10 1. Data/Simulation. 1.2 1 0.8 1. 102. 10. pZ [GeV]. T. dN/dpZ [GeV -1]. T. 108 107. ATLAS. ∫. Data Z →µµ. -1. s=7 TeV; Ldt=4.7 fb. Z →τ τ WW/WZ/ZZ. 106 5. 10. tt W →µν Multijet. 104 103 102 10 1. Data/Simulation. 10-1. 1.2 1 0.8 1. 10. 102 pZ [GeV] T. pZ T. Figure 1. Distributions of for data and simulation, and their ratios, in the electron channel (top) and muon channel (bottom). The plots show statistical uncertainties only.. 7. Unfolding and systematic uncertainties. The normalized differential cross section as a function of pZ T is defined as fid fid Z fid ∗ (1/σ )(dσ /dpT ), where σ is the inclusive pp → Z/γ cross section measured within the fiducial acceptance defined by requiring pT > 20 GeV and |η| < 2.4 for the decay leptons; the invariant mass of the pair must satisfy 66 < m`` < 116 GeV. In addition to the rapidity-inclusive measurement, the measurement is performed for 0 ≤ |yZ | < 1, 1 ≤ |yZ | < 2 and 2 ≤ |yZ | < 2.4.. –7–. JHEP09(2014)145. 10-1.
(9) –8–. JHEP09(2014)145. The measurement is performed for three definitions of the particle-level final-state kinematics. The Born and bare kinematics are defined from the decay lepton kinematics before and after FSR, respectively. The dressed kinematics are defined by combining the bare momentum of each lepton with that of photons radiated within a distance smaller than ∆R = 0.1. Conversion factors from the Born to the bare and dressed levels are defined from the ratio of the corresponding particle-level pZ T distributions and denoted by Z Z kbare (pT ) and kdressed (pT ), respectively. The Z/γ ∗ transverse momentum is reconstructed from the measured lepton fourmomenta. The pZ T range is divided into 26 bins of varying width between 0 GeV and 800 GeV, with finer granularity in the low-pZ T range, as shown in tables 1–3. The bin purity, defined as the fraction of reconstructed events for which pZ T falls in the same bin at reconstruction and particle level, is everywhere above 50%. The total background is subtracted from the observed pZ T distribution. The electroweak background cross sections are assigned a 5% uncertainty derived by varying the PDFs within their uncertainties and from QCD renormalization and factorization scale variations; in addition, a relative uncertainty of 1.8% on the total integrated luminosity is taken into account. The normalization of the top background was verified comparing data and miss ), defined for each event as the total simulation at high missing transverse energy (ET transverse momentum imbalance of the reconstructed objects. An uncertainty of 12% is miss > 100 GeV and 20 < pZ < 120 GeV, assigned comparing data and simulation for ET T where this background contribution dominates. The multijet background uncertainty is discussed in section 6. The pZ T distribution is subsequently corrected for resolution effects and QED final-state radiation back to the Born level, as well as for the differences between the reconstructionand particle-level fiducial acceptance, with an iterative Bayesian unfolding method [45– 47]; three iterations are used. The response matrix used for the unfolding is defined as a two-dimensional histogram correlating the Born-level and reconstructed pZ T distriZ butions. The prior probability distribution for the Born-level pT distribution is defined from the modified Powheg+Pythia6 prediction described in section 4, and matches that of Pythia6-AMBT1. The statistical uncertainty on the unfolded spectrum is obtained by generating random replicas of the reconstruction-level pZ T distribution. For each trial, Poisson-distributed fluctuations are applied to the number of entries in each bin, and the measurement procedure is repeated. The obtained ensemble of fluctuated measurement results is used to fill a covariance matrix, including correlations between the bins introduced by the unfolding and normalization procedure. The relative statistical uncertainty remains below 0.6% for pZ T < 30 GeV in both channels, and below 1.1% up to 150 GeV. The uncertainty induced by the size of the MC samples is determined by applying the same method to the response matrix, and stays below 0.4% and 0.5% up to pZ T = 150 GeV in the muon and electron channel, respectively, reaching 2% for the bin 300 < pZ T < 800 GeV. Systematic uncertainties from experimental sources such as trigger, reconstruction and identification efficiency corrections, energy scale and resolution corrections, and the background normalization and pT distribution are evaluated by repeating the analysis varying.
(10) –9–. JHEP09(2014)145. the corresponding parameters within their uncertainties and comparing to the nominal result. For each channel, the impact of a given source of uncertainty is evaluated preserving correlations across the measurement range. The uncertainty on the normalization of the electroweak and top quark backgrounds is treated as fully correlated between the two channels. The electron- and muon-specific uncertainties are uncorrelated between channels. In the electron channel, the uncertainties on the trigger, reconstruction and identification efficiency corrections are propagated preserving their correlations across lepton η and pT . These sources contribute a relative uncertainty of the order of 10−4 up to pZ T = 100 GeV and less than 0.2% over the full measurement range. The uncertainty induced by the background subtraction is typically 0.1%, except around pZ T = 100 GeV where it reaches 0.3% because of the top quark background contribution. The uncertainty induced by charge misidentification, estimated from the difference between the results obtained with and without an opposite-sign requirement on the leptons, amounts to less than 0.2% over the whole pZ T range. The dominant experimental uncertainties in the electron channel arise from the electron energy scale, resolution, mis-modelling of the electron energy tails caused by uncertainties in the treatment of electron multiple scattering in Geant4 and in passive detector material. The combined contribution from energy scale and resolution uncertainties to the total systematic uncertainty is typically 0.3% per bin between 4 GeV and 70 GeV, and reaches about 2% at the end of the spectrum. The uncertainty from the energy tails amounts to 0.8% at most, contributing mainly at very low pZ T and at very high Z pT where the statistical uncertainty dominates. In the muon channel, the trigger, reconstruction and isolation efficiency corrections contribute an uncertainty of 0.6% on average, spanning 0.2% to 1.7% across the measurement range. The momentum scale and resolution uncertainties amount to 0.2%, except in the last three pZ T bins where they stay below 1.5%. The uncertainty contributed by the Z background subtraction is below 0.1% over the whole pZ T range except around pT = 100 GeV where it reaches 0.13% because of the top quark background contribution. The dominant contribution to the systematic uncertainties for both channels comes from the unfolding method. Two effects are addressed: the bias of the result towards the prior, and the dependence of the result on the theoretical calculation used to determine the response matrix. The first item is evaluated by repeating the measurement using the nominal result as the prior. The difference between the nominal result and this iteration is less than 0.1% up to 100 GeV, and less than 1.3% for the rest of the distribution. The second effect is evaluated by unfolding the pZ T distribution using an alternative response matrix, ∗ + − constructed from a Z/γ → ` ` sample obtained with Mc@nlo instead of Powheg, and modified to match the Pythia6-AMBT1 spectrum as it was done for Powheg. A systematic uncertainty of about 0.3% over the whole pZ T range is assigned from the difference between the two results. The PDF uncertainties are estimated by reweighting the baseline sample to each of the CT10 PDF error sets [30] and repeating the unfolding. In each bin, the sum in quadrature of deviations with respect to the nominal result is used to define the associated uncertainty, which is below 0.1% up to 60 GeV and below 0.3% over the remaining pZ T range. The unfolding systematic uncertainties are assumed to be fully correlated between the electron and muon channels..
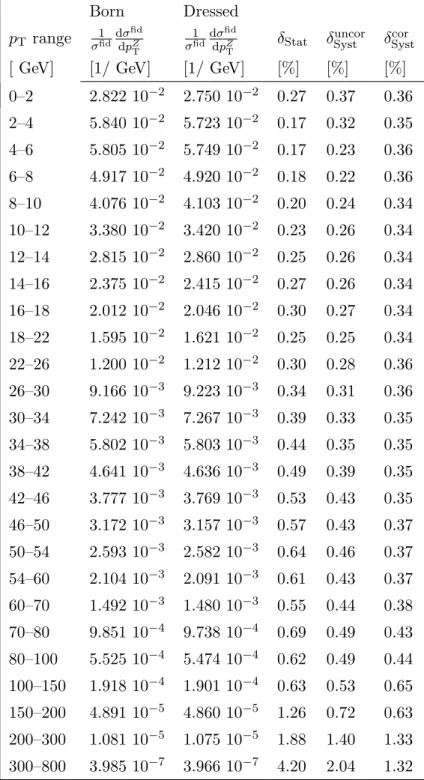
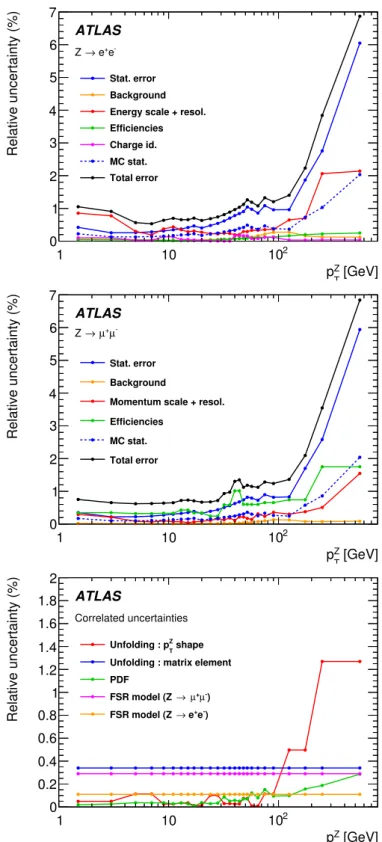
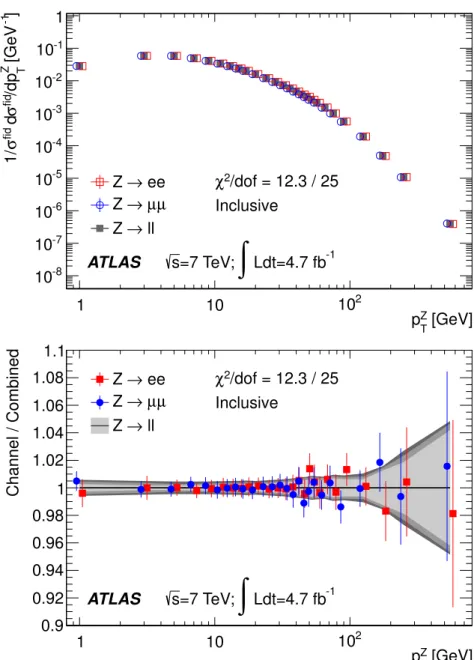
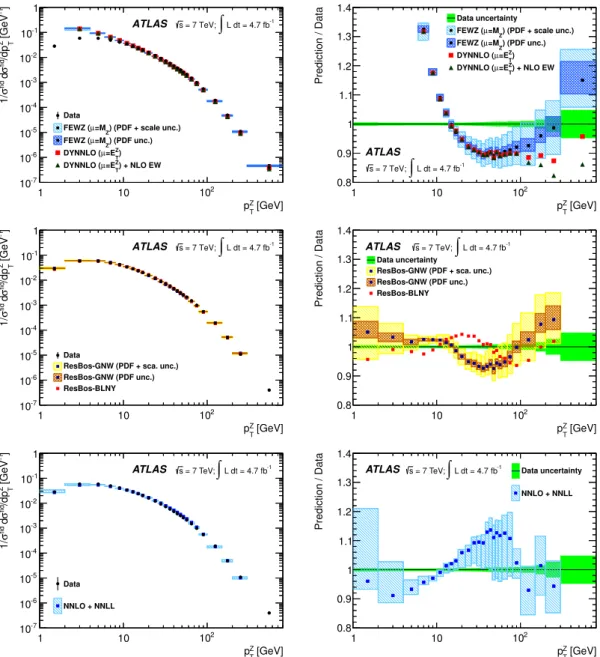
(11) 8. Results. ∗ + − The inclusive normalized cross sections (1/σ fid )(dσ fid /dpZ T ) measured in the Z/γ → e e and Z/γ ∗ → µ+ µ− channels are presented in table 1 including statistical, uncorrelated and correlated systematic uncertainties. The sizes of the correlated uncertainties depend on the channel because of different resolutions and background levels. The measurement results are reported at Born level and factors kbare and kdressed are given to translate to the bare and dressed levels. In each channel, the total uncertainty is between 0.5% and 1% Z for pZ T < 30 GeV, below 1.5% per bin up to pT = 150 GeV and rises to 7% at the end of the spectrum. The electron- and muon-channel cross sections are combined using χ2 minimization, following the best linear unbiased estimator prescription (BLUE) [48, 49]. The combination is performed for the Born-level and dressed-level distributions. When building the χ2 , the measurement uncertainties are categorized into uncorrelated and correlated sources. Table 2 presents the combined results for the inclusive measurement for Born level and dressed lepton kinematics. The combined precision is between 0.5% and 1.1% for pZ T < 150 2 GeV, rising to 5.5% towards the end of the spectrum. The combination has χ /dof = 12.3/25 (χ2 per degree of freedom). The individual channels are compared to the combined result in figure 3. The measurements are repeated in three exclusive boson rapidity bins, namely 0 ≤ |yZ | < 1, 1 ≤ |yZ | < 2 and 2 ≤ |yZ | < 2.4. The combined results, corrected to the Born level, are given in table 3 with statistical, correlated and uncorrelated systematic uncertainties for the three rapidity bins. The measurement results in each channel and their combination are illustrated in figures 4–6.. 9. Comparison to QCD predictions. In figure 7, the Born-level combined result is compared to theoretical predictions at fixed order from Fewz and Dynnlo, to ResBos and to the NNLO+NNLL calculation of ref. [21]. Fewz, Dynnlo and ResBos use the CT10 PDFs, while the NNLO+NNLL calculation of ref. [21] uses the CTEQ6m PDFs [50].. – 10 –. JHEP09(2014)145. The uncertainty arising from the accuracy of the theoretical description of QED FSR Z is obtained by comparing kbare (pZ T ) and kdressed (pT ) as predicted by Photos and Sherpa. The differences obtained for kbare (pZ T ) are representative of the QED uncertainty in the muon channel, and amount to 0.3% across the pZ T distribution. From the differences obZ tained for kdressed (pT ), a 0.1% uncertainty is assigned to the electron channel. Photoninduced dilepton production is significant only in the lowest pZ T bin (0-2 GeV), where it contributes 0.4%. The cross sections obtained for this process when evaluating the MRST2004qed PDFs in the current and constituent quark mass schemes differ by 30%, and contribute an uncertainty of 0.1% to the measurement in this bin. Figure 2 presents the contributions from the different uncertainties to the inclusive pZ T measurement integrated over the Z rapidity..
(12) Born 2.811 5.840 5.806 4.908 4.074 3.381 2.815 2.374 2.014 1.598 1.199 9.164 7.236 5.806 4.666 3.760 3.216 2.604 2.097 1.501 9.820 5.599 1.920 4.809 1.085 3.910. pT range. [ GeV]. 0–2 2–4 4–6 6–8 8–10 10–12 12–14 14–16 16–18 18–22 22–26 26–30 30–34 34–38 38–42 42–46 46–50 50–54 54–60 60–70 70–80 80–100 100–150 150–200 200–300 300–800. 0.916 0.935 0.969 1.002 1.025 1.040 1.055 1.060 1.060 1.052 1.033 1.021 1.007 0.997 0.992 0.990 0.977 0.982 0.972 0.966 0.959 0.955 0.957 0.953 0.950 0.949. 0.974 0.980 0.990 1.000 1.007 1.012 1.016 1.017 1.017 1.016 1.010 1.006 1.003 1.000 0.999 0.998 0.995 0.996 0.994 0.992 0.989 0.991 0.991 0.994 0.995 0.995. 0.42 0.26 0.26 0.28 0.31 0.35 0.37 0.42 0.47 0.40 0.48 0.54 0.62 0.70 0.78 0.84 0.90 1.04 0.98 0.86 1.08 0.96 0.96 1.86 2.76 6.05. [%]. δStat. 0.85 0.76 0.39 0.31 0.43 0.49 0.42 0.38 0.38 0.32 0.31 0.33 0.38 0.40 0.45 0.49 0.53 0.59 0.55 0.52 0.56 0.50 0.74 1.02 2.51 3.12. [%]. uncor δSyst. 2.836 5.833 5.800 4.929 4.082 3.375 2.814 2.376 2.011 1.593 1.201 9.172 7.256 5.800 4.619 3.795 3.137 2.586 2.113 1.484 9.886 5.449 1.917 4.982 1.074 4.047. Born 10−2 10−2 10−2 10−2 10−2 10−2 10−2 10−2 10−2 10−2 10−3 10−3 10−3 10−3 10−3 10−3 10−3 10−3 10−3 10−4 10−4 10−4 10−5 10−5 10−7. 0.953 0.964 0.982 1.002 1.014 1.023 1.031 1.032 1.032 1.029 1.018 1.010 1.006 0.999 0.997 0.992 0.990 0.987 0.986 0.982 0.976 0.979 0.976 0.975 0.974 0.958. kbare 0.974 0.980 0.990 1.000 1.007 1.012 1.016 1.017 1.016 1.016 1.010 1.006 1.003 1.000 0.999 0.998 0.995 0.996 0.994 0.992 0.989 0.991 0.991 0.994 0.995 0.995. kdressed. Z/γ ∗ → µ+ µ− [1/ GeV]. 10−2. 1 dσ fid σ fid dpZ T. 0.35 0.22 0.22 0.24 0.27 0.30 0.33 0.35 0.39 0.33 0.39 0.44 0.50 0.56 0.63 0.68 0.73 0.82 0.79 0.72 0.89 0.81 0.83 1.70 2.58 5.84. [%]. δStat. 0.50 0.43 0.35 0.35 0.44 0.45 0.46 0.46 0.48 0.47 0.50 0.53 0.54 0.58 0.63 0.68 0.66 0.68 0.65 0.71 0.78 0.83 0.83 1.11 1.99 3.20. [%]. uncor δSyst. 0.36 0.35 0.36 0.36 0.34 0.34 0.34 0.34 0.34 0.34 0.36 0.36 0.35 0.35 0.35 0.35 0.37 0.37 0.38 0.39 0.44 0.46 0.67 0.64 1.33 1.35. ee [%] 0.36 0.34 0.36 0.36 0.34 0.34 0.34 0.34 0.34 0.34 0.36 0.36 0.35 0.35 0.35 0.34 0.37 0.36 0.36 0.36 0.39 0.39 0.62 0.60 1.34 1.30. µµ [%]. cor δSyst. Common cor δSyst. Z ∗ + − Table 1. The measured normalized cross section (1/σ fid )(dσ fid /dpZ and Z/γ ∗ → µ+ µ− channels, and T ) in bins of pT for the Z/γ → e e correction factors to the bare- and dressed-level cross sections. The relative statistical and total uncorrelated systematic uncertainties are given for each channel as well as the correlated systematic uncertainties.. 10−2 10−2 10−2 10−2 10−2 10−2 10−2 10−2 10−2 10−2 10−3 10−3 10−3 10−3 10−3 10−3 10−3 10−3 10−3 10−4 10−4 10−4 10−5 10−5 10−7. kbare. kdressed. Z/γ ∗ → e+ e− [1/ GeV]. 10−2. 1 dσ fid σ fid dpZ T. JHEP09(2014)145. – 11 –.
(13) Dressed. pT range. 1 dσ fid σ fid dpZ T. 1 dσ fid σ fid dpZ T. δStat. uncor δSyst. cor δSyst. [ GeV]. [1/ GeV]. [1/ GeV]. [%]. [%]. [%]. 0–2. 2.822 10−2. 2.750 10−2. 0.27. 0.37. 0.36. 2–4. 5.840 10−2. 5.723 10−2. 0.17. 0.32. 0.35. 4–6. 5.805 10−2. 5.749 10−2. 0.17. 0.23. 0.36. 6–8. 4.917. 10−2. 10−2. 0.18. 0.22. 0.36. 8–10. 4.076 10−2. 4.103 10−2. 0.20. 0.24. 0.34. 10−2. 10−2. 0.23. 0.26. 0.34. 4.920. 10–12. 3.380. 3.420. 12–14. 2.815 10−2. 2.860 10−2. 0.25. 0.26. 0.34. 14–16. 2.375. 10−2. 10−2. 0.27. 0.26. 0.34. 16–18. 2.012 10−2. 2.046 10−2. 0.30. 0.27. 0.34. 18–22. 1.595. 10−2. 10−2. 0.25. 0.25. 0.34. 22–26. 1.200 10−2. 1.212 10−2. 0.30. 0.28. 0.36. 26–30. 9.166. 10−3. 10−3. 0.34. 0.31. 0.36. 30–34. 7.242 10−3. 7.267 10−3. 0.39. 0.33. 0.35. 34–38. 5.802. 10−3. 10−3. 0.44. 0.35. 0.35. 38–42. 4.641 10−3. 4.636 10−3. 0.49. 0.39. 0.35. 42–46. 3.777. 10−3. 10−3. 0.53. 0.43. 0.35. 46–50. 3.172 10−3. 3.157 10−3. 0.57. 0.43. 0.37. 50–54. 2.593. 10−3. 10−3. 0.64. 0.46. 0.37. 54–60. 2.104 10−3. 2.091 10−3. 0.61. 0.43. 0.37. 60–70. 1.492. 10−3. 1.480. 10−3. 0.55. 0.44. 0.38. 70–80. 9.851. 10−4. 9.738. 10−4. 0.69. 0.49. 0.43. 80–100. 5.525 10−4. 5.474 10−4. 0.62. 0.49. 0.44. 10−4. 10−4. 0.63. 0.53. 0.65. 2.415 1.621 9.223 5.803 3.769 2.582. 100–150. 1.918. 1.901. 150–200. 4.891 10−5. 4.860 10−5. 1.26. 0.72. 0.63. 200–300. 1.081. 10−5. 10−5. 1.88. 1.40. 1.33. 300–800. 3.985 10−7. 3.966 10−7. 4.20. 2.04. 1.32. 1.075. Table 2. The measured normalized combined (electron and muon channels) cross section (1/σ fid )(dσ fid /dpZ T ), inclusive in rapidity. The cross sections at Born and dressed levels are given as well as the relative statistical (δStat ) and total systematic (δSyst ) for uncorrelated and correlated sources.. – 12 –. JHEP09(2014)145. Born.
(14) Relative uncertainty (%). 7 ATLAS 6 5. Z → e+eStat. error Background. 4. Energy scale + resol. Efficiencies. 3. Charge id. MC stat.. 2. Total error. 0 1. 10. 102 pZ [GeV]. Relative uncertainty (%). T. 7 ATLAS 6 5. Z → µ+µStat. error Background. 4 3. Momentum scale + resol. Efficiencies MC stat.. 2. Total error. 1 0 1. 10. 102 pZ [GeV]. Relative uncertainty (%). T. 2 1.8. ATLAS. 1.6. Correlated uncertainties. 1.4 1.2. Unfolding : pZ shape T. Unfolding : matrix element PDF. 1. FSR model (Z → µ+µ-). 0.8. FSR model (Z → e+e-). 0.6 0.4 0.2 0 1. 10. 102 pZ [GeV] T. Figure 2. Summary of uncertainties for the yZ -integrated measurement, given as a percentage of the central value of the bin. Electron channel (top), muon channel (middle), correlated uncertainties (bottom).. – 13 –. JHEP09(2014)145. 1.
(15) T. 10-1 10-2 10-3 10-4 10-5. Z → ee Z → µµ Z → ll. 10-6 10-7. ATLAS. -8. 10. 1. χ2/dof = 12.3 / 25 Inclusive. s=7 TeV;. ∫ Ldt=4.7 fb. -1. 102. 10. pZ [GeV]. Channel / Combined. T. 1.1 Z → ee Z → µµ Z → ll. 1.08 1.06 1.04. χ2/dof = 12.3 / 25 Inclusive. 1.02 1 0.98 0.96 0.94 0.92. ATLAS. s=7 TeV;. ∫ Ldt=4.7 fb. 0.9 1. 10. -1. 102. pZ [GeV] T. Z Figure 3. The measured inclusive normalized cross section (1/σ fid )(dσ fid /dpZ T ) as a function of pT for the electron and muon channels and the combined result (top). Ratio of the electron and muon channels to the combined result (bottom). The uncertainty bands represent the statistical, total uncorrelated and total uncertainties, from light gray to dark gray respectively.. – 14 –. JHEP09(2014)145. 1/σ fid dσ fid/dpZ [GeV -1]. 1.
(16) 2.792 5.763 5.784 4.974 4.134 3.424 2.859 2.412 2.028 1.609 1.199 9.113 7.165 5.707 4.554 3.747 3.140 2.575 2.040 1.457 9.557 5.413 1.859 4.794 1.124 4.768. 10 10−2 10−2 10−2 10−2 10−2 10−2 10−2 10−2 10−2 10−2 10−3 10−3 10−3 10−3 10−3 10−3 10−3 10−3 10−3 10−4 10−4 10−4 10−5 10−5 10−7. 0.37 0.23 0.23 0.26 0.28 0.31 0.35 0.37 0.42 0.35 0.41 0.46 0.53 0.59 0.66 0.73 0.79 0.88 0.81 0.73 0.92 0.83 0.83 1.67 2.38 5.02. [%] 0.34 0.31 0.23 0.22 0.24 0.26 0.27 0.27 0.29 0.27 0.29 0.31 0.35 0.38 0.44 0.47 0.48 0.52 0.48 0.46 0.55 0.53 0.54 0.74 1.40 2.00. [%]. uncor δSyst. 0.36 0.34 0.35 0.34 0.34 0.35 0.34 0.35 0.35 0.34 0.35 0.35 0.35 0.34 0.35 0.35 0.38 0.36 0.37 0.39 0.43 0.47 0.57 0.51 1.43 1.50. [%]. cor δSyst. 2.781 5.802 5.782 4.868 4.047 3.381 2.823 2.385 2.034 1.606 1.217 9.275 7.339 5.880 4.709 3.745 3.156 2.568 2.125 1.494 9.979 5.566 1.974 4.990 1.018 3.048. 10 10−2 10−2 10−2 10−2 10−2 10−2 10−2 10−2 10−2 10−2 10−3 10−3 10−3 10−3 10−3 10−3 10−3 10−3 10−3 10−4 10−4 10−4 10−5 10−5 10−7. −2. [1/ GeV]. 1 dσ fid σ fid dpZ T. Born. 2.704 5.680 5.720 4.872 4.074 3.423 2.876 2.427 2.070 1.634 1.228 9.340 7.363 5.883 4.704 3.739 3.134 2.556 2.110 1.481 9.845 5.509 1.954 4.959 1.011 3.028. 10 10−2 10−2 10−2 10−2 10−2 10−2 10−2 10−2 10−2 10−2 10−3 10−3 10−3 10−3 10−3 10−3 10−3 10−3 10−3 10−4 10−4 10−4 10−5 10−5 10−7. −2. [1/ GeV]. T. 0.42 0.26 0.25 0.28 0.31 0.34 0.38 0.40 0.44 0.39 0.47 0.52 0.59 0.66 0.74 0.82 0.86 0.99 0.92 0.87 1.08 0.99 1.00 2.03 3.17 8.02. [%]. 1 ≤ |yZ | < 2 Dressed 1 dσ fid δStat σ fid dpZ 0.48 0.39 0.27 0.27 0.30 0.32 0.32 0.32 0.35 0.32 0.36 0.41 0.46 0.49 0.51 0.57 0.62 0.67 0.59 0.64 0.71 0.69 0.70 0.99 2.05 3.67. [%]. uncor δSyst. 0.37 0.35 0.39 0.38 0.34 0.34 0.35 0.34 0.35 0.35 0.36 0.35 0.35 0.35 0.35 0.38 0.37 0.36 0.35 0.39 0.40 0.48 0.71 0.69 1.20 1.03. [%]. cor δSyst. 2.71 5.68 5.64 4.71 3.95 3.22 2.66 2.27 1.99 1.60 1.23 9.68 7.82 6.34 5.09 4.38 3.57 3.00 2.66 1.82 1.14 5.96 1.98 5.08 9.09 1.47. 10 10−2 10−2 10−2 10−2 10−2 10−2 10−2 10−2 10−2 10−2 10−3 10−3 10−3 10−3 10−3 10−3 10−3 10−3 10−3 10−3 10−4 10−4 10−5 10−6 10−7. −2. [1/ GeV]. 1 dσ fid σ fid dpZ T. Born. 2.63 5.53 5.56 4.70 3.97 3.27 2.71 2.33 2.03 1.64 1.24 9.81 7.90 6.34 5.09 4.40 3.55 2.99 2.65 1.80 1.12 5.89 1.96 5.05 9.12 1.45. 10 10−2 10−2 10−2 10−2 10−2 10−2 10−2 10−2 10−2 10−2 10−3 10−3 10−3 10−3 10−3 10−3 10−3 10−3 10−3 10−3 10−4 10−4 10−5 10−6 10−7. −2. [1/ GeV]. T. 1.3 0.8 0.8 0.8 0.9 1.0 1.1 1.3 1.4 1.2 1.4 1.7 1.8 2.0 2.2 2.4 2.6 2.9 2.7 2.5 3.3 3.1 3.3 6.7 10.9 34.0. [%]. 2 ≤ |yZ | < 2.4 Dressed 1 dσ fid δStat σ fid dpZ 1.0 0.7 0.5 0.6 0.6 0.7 0.7 0.7 0.8 0.6 0.8 0.8 0.9 1.0 1.2 1.2 1.4 1.5 1.3 1.3 1.6 1.4 1.5 2.8 4.4 15.8. [%]. uncor δSyst. 0.5 0.4 0.5 0.5 0.4 0.4 0.4 0.5 0.5 0.5 0.6 0.6 0.5 0.5 0.4 0.4 0.4 0.6 0.4 0.4 0.7 0.8 2.1 2.2 0.8 0.9. [%]. cor δSyst. Table 3. The measured normalized combined (electron and muon channels) cross section (1/σ fid )(dσ fid /dpZ T ), for 0 ≤ |yZ | < 1, 1 ≤ |yZ | < 2 and 2 ≤ |yZ | < 2.4. The cross sections at Born and dressed levels are given as well as the relative statistical (δStat ) and systematic (δSyst ) uncertainties for uncorrelated and correlated sources.. 10 10−2 10−2 10−2 10−2 10−2 10−2 10−2 10−2 10−2 10−2 10−3 10−3 10−3 10−3 10−3 10−3 10−3 10−3 10−3 10−4 10−4 10−4 10−5 10−5 10−7. −2. 2.861 5.874 5.834 4.972 4.106 3.385 2.819 2.375 1.997 1.587 1.187 9.065 7.143 5.707 4.559 3.757 3.150 2.584 2.052 1.466 9.646 5.458 1.874 4.826 1.126 4.783. −2. [1/ GeV]. [ GeV]. 0–2 2–4 4–6 6–8 8–10 10–12 12–14 14–16 16–18 18–22 22–26 26–30 30–34 34–38 38–42 42–46 46–50 50–54 54–60 60–70 70–80 80–100 100–150 150–200 200–300 300–800. [1/ GeV]. 1 dσ fid σ fid dpZ T T. 0 ≤ |yZ | < 1 Dressed 1 dσ fid δStat σ fid dpZ. pT range. Born. JHEP09(2014)145. – 15 –.
(17) T. 10-1 10-2 10-3 10-4 10-5. Z → ee Z → µµ Z → ll. 10-6 10-7. ATLAS. 10-8 1. χ2/dof = 19.3 / 25 0 ≤ |y | < 1 Z. s=7 TeV;. ∫ Ldt=4.7 fb. -1. 102. 10. pZ [GeV]. Channel / Combined. T. 1.1 Z → ee Z → µµ Z → ll. 1.08 1.06 1.04. χ2/dof = 19.3 / 25 0 ≤ |y | < 1 Z. 1.02 1 0.98 0.96 0.94 0.92. ATLAS. s=7 TeV;. ∫ Ldt=4.7 fb. 0.9 1. 10. -1. 102. pZ [GeV] T. Figure 4. The measured normalized cross section (1/σ fid )(dσ fid /dpZ T ) for 0 ≤ |yZ | < 1, as a Z function of pT for the electron and muon channels and the combined result (top). Ratio of the electron and muon channels to the combined result (bottom). The uncertainty bands represent the statistical, total uncorrelated and total uncertainties, from light gray to dark gray respectively.. – 16 –. JHEP09(2014)145. 1/σ fid dσ fid/dpZ [GeV -1]. 1.
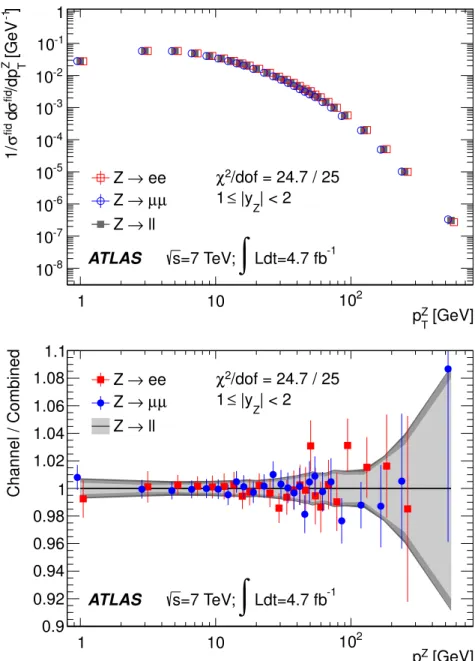
(18) T. 10-1 10-2 10-3 10-4 10-5. Z → ee Z → µµ Z → ll. 10-6 10-7. ATLAS. -8. 10. 1. χ2/dof = 24.7 / 25 1 ≤ |y | < 2 Z. s=7 TeV;. ∫ Ldt=4.7 fb. -1. 102. 10. pZ [GeV]. Channel / Combined. T. 1.1 Z → ee Z → µµ Z → ll. 1.08 1.06 1.04. χ2/dof = 24.7 / 25 1 ≤ |y | < 2 Z. 1.02 1 0.98 0.96 0.94 0.92. ATLAS. s=7 TeV;. ∫ Ldt=4.7 fb. 0.9 1. 10. -1. 102. pZ [GeV] T. Figure 5. The measured normalized cross section (1/σ fid )(dσ fid /dpZ T ) for 1 ≤ |yZ | < 2, as a Z function of pT for the electron and muon channels and the combined result (top). Ratio of the electron and muon channels to the combined result (bottom). The uncertainty bands represent the statistical, total uncorrelated and total uncertainties, from light gray to dark gray respectively.. – 17 –. JHEP09(2014)145. 1/σ fid dσ fid/dpZ [GeV -1]. 1.
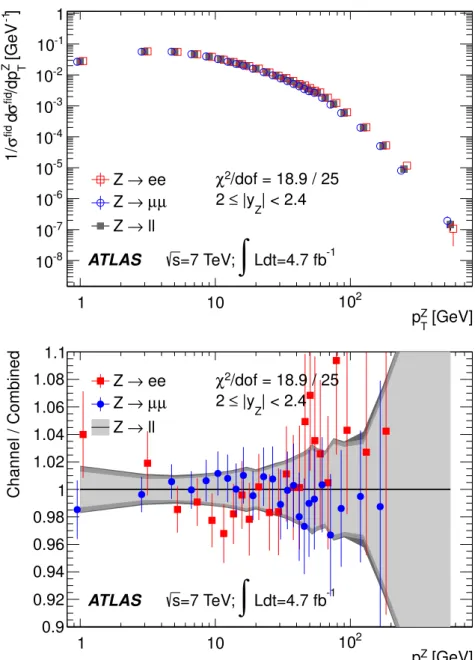
(19) T. 10-1 10-2 10-3 10-4 10-5. Z → ee Z → µµ Z → ll. -6. 10. -7. 10. 10-8. ATLAS 1. χ2/dof = 18.9 / 25 2 ≤ |y | < 2.4 Z. s=7 TeV;. ∫ Ldt=4.7 fb. -1. 102. 10. pZ [GeV]. Channel / Combined. T. 1.1 Z → ee Z → µµ Z → ll. 1.08 1.06 1.04. χ2/dof = 18.9 / 25 2 ≤ |y | < 2.4 Z. 1.02 1 0.98 0.96 0.94 0.92. ATLAS. s=7 TeV;. ∫ Ldt=4.7 fb. 0.9 1. 10. -1. 102. pZ [GeV] T. Figure 6. The measured normalized cross section (1/σ fid )(dσ fid /dpZ T ) for 2 ≤ |yZ | < 2.4, as a Z function of pT for the electron and muon channels and the combined result (top). Ratio of the electron and muon channels to the combined result (bottom). The uncertainty bands represent the statistical, total uncorrelated and total uncertainties, from light gray to dark gray respectively.. – 18 –. JHEP09(2014)145. 1/σ fid dσ fid/dpZ [GeV -1]. 1.
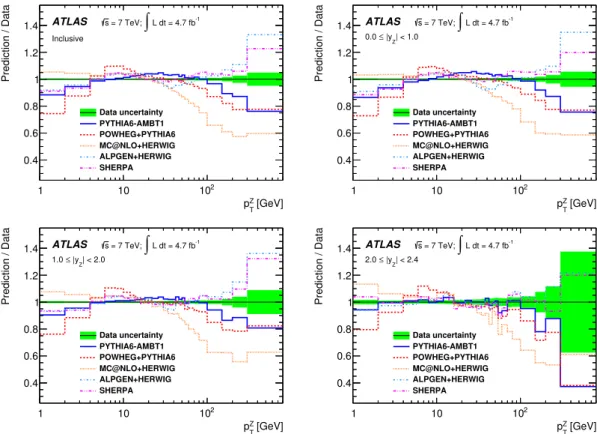
(20) 10. Tuning of PYTHIA8 and POWHEG + PYTHIA8. The parton shower tunes presented below are performed to determine the sensitivity of the measured pZ T cross sections presented here to parton shower model parameters in state-ofthe-art MC generators, and to constrain the models by trying to achieve precise predictions of vector boson production. The ATLAS φ?η measurement [16] is also exploited as it is highly correlated to pZ T and is hence sensitive to the same model components. The Pythia8 generator with the pT -ordered, interleaved parton shower is chosen for these studies. Pythia8 is used in standalone mode and in a configuration interfaced to Powheg. To minimize dependence on QED final-state corrections, the tunes use the dressed-level measurement results. The study is restricted to the low pZ T range, where Z parton shower effects dominate. The tunes are performed for pT < 26 GeV, which is found to be most sensitive to the model parameters described below, and φ?η < 0.29, which covers. – 19 –. JHEP09(2014)145. The uncertainty on the predictions, estimated from the PDF uncertainties and renormalization and factorization scale variations, are in all cases much larger than the measurement uncertainties. The disagreement between the data and the Fewz and Dynnlo predictions is larger than the data uncertainties, reaching 10% around 50 GeV and diverging at low pZ T as expected from the absence of resummation effects in these calculations. Fewz and Dynnlo agree with each other when using QCD renormalization and factorization scales, µR and µF , defined as µR = µF = mZ and leading-order electroweak perturbative accuracy. The influence of the QCD scale choice is studied with Dynnlo by using the Z , defined as the sum in quadrature of m and pZ . The resultalternative dynamic scale ET Z T Z > 30 GeV, but the normalization ing pZ shape is in better agreement with the data for p T T remains low by 10% in this region. NLO electroweak corrections to Z+jet production [51] are applied to the dynamic-scale Dynnlo prediction and lead to a decrease of the cross section of 10% in the highest pZ T bin. The ResBos-GNW prediction agrees with the data within 5–7%; the prediction uncertainties are defined from PDF, renormalization scale and factorization scale variations. The ResBos-BLNY prediction, to which the previous ATLAS measurements [8, 9, 16] were compared, is included for reference. The NNLO+NNLL calculation following ref. [21] matches the data within 10–12%. The uncertainties on this prediction are defined from resummation, renormalization and factorization scale variations; PDF uncertainties are neglected. In both cases, the prediction uncertainties are almost sufficient to cover the difference with the data. Figure 8 shows the ratio of the pZ T distributions predicted by different generators to the combined measurements performed inclusively in Z rapidity, and in the three exclusive Z rapidity bins described above. The Pythia and Powheg generators agree with the data to within 5% in the 2 < pZ T < 60 GeV range, and to within 20% over the full range. Mc@nlo shows a similar level of agreement with the data for pZ T < 30 GeV but develops a discrepancy up to around 40% at the end of the spectrum. Sherpa and Alpgen agree with the data to within about 5% for 5 < pZ T < 200 GeV, but tend to overestimate the distribution near the end of the spectrum..
(21) 10-1. s = 7 TeV;. Prediction / Data. ATLAS. ∫ L dt = 4.7 fb. -1. T. 1/σfid dσfid/dp Z [GeV -1]. 1. 10-2 10-3. 1.4 Data uncertainty FEWZ (µ=M ) (PDF + scale unc.). 1.3. Z. FEWZ (µ=M ) (PDF unc.) Z. DYNNLO (µ=EZ) T. 1.2. DYNNLO (µ=EZ) + NLO EW T. 1.1 10-4. Data. 1. FEWZ (µ=M ) (PDF + scale unc.). 10-5. Z. FEWZ (µ=M ) (PDF unc.) Z. DYNNLO (µ=EZ). 10-6. 0.9. T. DYNNLO (µ=EZ) + NLO EW. 10-7. 1. 0.8 1. 102. 10. ATLAS s = 7 TeV;. T. ∫ L dt = 4.7 fb. -1. 102. 10. pZ [GeV]. ATLAS 10-1. s = 7 TeV;. T. Prediction / Data. 1. ∫ L dt = 4.7 fb. -1. T. 1/σfid dσfid/dp Z [GeV -1]. T. 10-2 10-3. 1.4 ATLAS 1.3 1.2. s = 7 TeV;. ∫ L dt = 4.7 fb. -1. Data uncertainty ResBos-GNW (PDF + sca. unc.) ResBos-GNW (PDF unc.) ResBos-BLNY. 1.1 10-4 10-5 10-6 10-7. 1. Data ResBos-GNW (PDF + sca. unc.) ResBos-GNW (PDF unc.) ResBos-BLNY. 1. 0.9 0.8 1. 102. 10. 102. 10. pZ [GeV]. pZ [GeV]. ATLAS. 10-1. s = 7 TeV;. T. Prediction / Data. 1. ∫ L dt = 4.7 fb. -1. T. 1/σfid dσfid/dpZ [GeV -1]. T. 10-2 10-3. ATLAS. s = 7 TeV;. 1.3. ∫ L dt = 4.7 fb. -1. Data uncertainty NNLO + NNLL. 1.2 1.1. 10-4. 1. 10-5. Data. 10-6. NNLO + NNLL. 10-7. 1.4. 1. 0.9. 10. 0.8 1. 102 pZT [GeV]. 10. 102 pZT [GeV]. Figure 7. Left: comparison of the pZ T distributions predicted by different computations: Fewz and Dynnlo (top), ResBos (middle) and the NNLO+NNLL calculation of ref. [21] (bottom) with the Born-level combined measurement, inclusively in yZ . Right: ratios between these predictions and the combined measurement.. a similar transverse momentum range. The measurement inclusive in rapidity is used for the tuning, and the compatibility of the tuned predictions with the data in the separate rapidity bins is then evaluated. For Pythia8, the parton shower model components under consideration include the strong coupling constant used for the parton shower evolution αSISR (mZ ), and the parton shower lower cut-off pT0 in the non-perturbative regime, implemented as a smooth damping factor p2T /(p2T0 + p2T ). To populate the region below pT0 , the partons initiating the hard scattering process are assumed to have a primordial transverse momentum kT following. – 20 –. JHEP09(2014)145. pZ [GeV].
(22) ATLAS. s = 7 TeV;. Prediction / Data. Prediction / Data. 1.4. ∫ L dt = 4.7 fb. -1. Inclusive. 1.2 1 0.8. 0.4 1. ATLAS. -1. Z. 1 Data uncertainty PYTHIA6-AMBT1 POWHEG+PYTHIA6 MC@NLO+HERWIG ALPGEN+HERWIG SHERPA. 0.4 102. ∫ L dt = 4.7 fb. 1.2. 0.6. 10. s = 7 TeV;. 0.0 ≤ |y | < 1.0. 0.8. Data uncertainty PYTHIA6-AMBT1 POWHEG+PYTHIA6 MC@NLO+HERWIG ALPGEN+HERWIG SHERPA. 0.6. 1.4. 1. 102. 10. pZ [GeV]. 1.4. ATLAS. s = 7 TeV;. ∫ L dt = 4.7 fb. -1. 1.0 ≤ |y | < 2.0 Z. 1.2 1 0.8 0.6 0.4 1. T. Prediction / Data. Prediction / Data. T. -1. 1. 1 T. ∫ L dt = 4.7 fb. Z. 0.4. pZ [GeV]. s = 7 TeV;. 1.2. 0.6. 102. ATLAS. 2.0 ≤ |y | < 2.4. 0.8. Data uncertainty PYTHIA6-AMBT1 POWHEG+PYTHIA6 MC@NLO+HERWIG ALPGEN+HERWIG SHERPA. 10. 1.4. Data uncertainty PYTHIA6-AMBT1 POWHEG+PYTHIA6 MC@NLO+HERWIG ALPGEN+HERWIG SHERPA. 10. 102 pZ [GeV] T. pZ T. Figure 8. Ratio of the distribution predicted by different MC generators to the Born-level combined measurement, for the inclusive measurement and for 0 ≤ |yZ | < 1, 1 ≤ |yZ | < 2 and 2 ≤ |yZ | < 2.4.. a Gaussian distribution with tunable width. The Pythia8 parton shower also includes QED emissions, but the corresponding cut-off values and coupling strength are left to the program defaults. The steerable parameters not used in the tuning are set to the values defined by the tune 4C [35]. Powheg calculates the hardest (highest pT ) QCD radiation provided that it is above a transverse momentum threshold p2T,min , which is a steerable parameter in the program. Below p2T,min , Powheg generates events without extra radiation and the phase space is populated by Pythia8. Therefore, the upper limit of the Pythia8 parton shower should match the Powheg cut-off value. The tunes are performed using p2T,min = 4 GeV2 , corresponding to pZ T = 2 GeV. In addition, in order to avoid discontinuities in the matched spectrum, the αS (mZ ) value used to calculate the QCD radiation in Powheg should match αSISR (mZ ) in Pythia; αS (mZ ) = 0.118 is used as in the CT10 PDFs. Correspondingly the running of αS in the parton shower calculation is set to NLO. The tuning of Powheg+Pythia8 hence only varies the shower cut-off and the primordial kT in Pythia8. The other steerable parameters not used in the tuning are set to the values defined by the 4C tune. The tunes are performed using the Professor [52] package, which interpolates the dependence of MC predictions on the model parameters as originally proposed in ref. [53]. Predictions for the pZ T distribution are generated at randomly chosen parameter settings. – 21 –. JHEP09(2014)145. pZ [GeV].
(23) Parameter. Variation Range Pythia8+Powheg tune. 1.0–2.5. 0.5–2.5. 0.120–0.140. 0.118. 0.5–2.5. 0.5–3.0. LO. NLO. tune 4C. tune 4C. —. 4.0. Primordial kT [GeV] ISR αSISR (mZ ) ISR cut-off [GeV] ISR αS order Pythia8 base tune Powheg cut-off [GeV2 ]. Table 4. Parameter ranges and model switches used in the tuning of Pythia8 and Pythia8+Powheg described in section 10. Pythia8 Primordial kT [GeV] ISR αSISR (mZ ) ISR cut-off [GeV] χ2min /dof. Powheg+Pythia8 pZ φ?η T. pZ T. φ?η. 1.74 ± 0.03. 1.73 ± 0.03. 1.75 ± 0.03. 1.75 ± 0.04. 0.1233 ± 0.0003. 0.1238 ± 0.0002. 0.118 (fixed). 0.118 (fixed). 0.66 ± 0.14. 0.58 ± 0.07. 2.06 ± 0.12. 1.88 ± 0.12. 23.9/19. 59.9/45. 18.5/20. 68.2/46. ? Table 5. Results of the Pythia8 and Powheg+Pythia8 tuning to the pZ T and φη data.. (anchor points) in the ranges indicated in table 4. A fourth-order polynomial is used to approximate the generator predictions between the anchor points. The optimal parameter values are determined using a χ2 minimization between the interpolated generator response and the data. ? The sensitivity of the generator parameters to the pZ T and φη measurements is probed by performing tunes of Pythia8 and Powheg+Pythia8 to each measurement separately. As shown in table 5 both measurements have comparable sensitivity and yield compatible tuned parameter values. As a further check of the compatibility between the pZ T and ? Z ? φη measurements, the pT -tuned and φη -tuned predictions are compared to the measured pZ T distribution. The tuning uncertainty is obtained from variations of the eigenvector components of the parameters error matrix over a range covering ∆χ2 = χ2min /dof. Figure 9 shows that the tuned predictions agree with the measured cross sections within 2% for pZ T < 50 GeV, and with each other within the tuned parameter uncertainties. ? Since the pZ T and φη observables provide similar sensitivity to the parton shower parameters and to avoid correlations between these measurements, the final tune optimally combines the most precise independent single measurements, namely the muon channel ? pZ T measurement, and the electron channel φη measurement. The same tuning range is used. Table 6 shows the tune results and figure 10 shows the comparison of the tuned predictions to the data. The final tunes are referred to as AZ and AZNLO for Pythia8 and Powheg+Pythia8 respectively. The tuned predictions agree with the measurement. – 22 –. JHEP09(2014)145. Variation Range Pythia8 tune.
(24) Prediction/Data. ATLAS. Data uncertainty PYTHIA8 Z φη*-tuned. 1.05. PYTHIA8 pZ-tuned T. 1. s = 7 TeV;. ∫ Ldt = 4.7 fb. -1. 1. 10. 102 pZ [GeV]. Prediction/Data. T. ATLAS. Data uncertainty POWHEG+PYTHIA8 Z φη*-tuned. 1.05. POWHEG+PYTHIA8 pZ-tuned T. 1. 0.95 s = 7 TeV;. 1. ∫ Ldt = 4.7 fb. -1. 10. 102 pZ [GeV] T. Figure 9. Comparison of the Pythia8 (top) and Powheg+Pythia8 (bottom) tuned predictions based on the φ?η and pZ T measurements with the data, for dressed kinematics. The vertical dashed lines show the upper limit of the tuning range.. to better than 2% in the range used for the tuning, and below pZ T = 50 GeV. The primordial kT and ISR cut-off parameters are essentially constrained by the data in the region pZ T < 12 GeV and not affected by the choice of upper bound for the tuning range. In contrast, αSISR (mZ ) is tightly constrained for a given choice of range but its tuned value varies by 2% when increasing the upper bound to 50 GeV. At higher transverse momentum, discrepancies of around 15% for Pythia8 and 20% for Powheg+Pythia8 remain,. – 23 –. JHEP09(2014)145. 0.95.
(25) Tune Name Primordial kT [GeV] ISR αSISR (mZ ) ISR cut-off [GeV] χ2min /dof. Pythia8. Powheg+Pythia8. Base tune. AZ. AZNLO. 4C. 1.71 ± 0.03. 1.75 ± 0.03. 2.0. 0.1237 ± 0.0002. 0.118 (fixed). 0.137. 0.59 ± 0.08. 1.92 ± 0.12. 2.0. 45.4/32. 46.0/33. —. Prediction/Data. Prediction/Data. ATLAS. Data uncertainty. 1.1. PYTHIA8 4C PYTHIA8 AZ. 1. ATLAS. Data uncertainty. 1.1. PYTHIA8 4C PYTHIA8 AZ. 1 0.9 0.9 0.8. s = 7 TeV;. ∫. -1. Ldt = 4.7 fb. 1. 10. s = 7 TeV;. 102 pZ [GeV]. ∫ Ldt = 4.7 fb. -1. 10-2. 10-1. ATLAS. Data uncertainty. 1.1. Prediction/Data. Prediction/Data. T. POWHEG+PYTHIA8 4C POWHEG+PYTHIA8 AZNLO. 1. ATLAS. Data uncertainty. 1.1. 1 Z φη*. POWHEG+PYTHIA8 4C POWHEG+PYTHIA8 AZNLO. 1 0.9 0.9 0.8. s = 7 TeV;. 1. ∫ Ldt = 4.7 fb. -1. 10. s = 7 TeV;. 102 pZ [GeV] T. ∫ Ldt = 4.7 fb. 10-2. -1. 10-1. 1 Z φη*. ? Figure 10. Comparison of tuned predictions to the pZ T and φη differential cross sections, for dressed kinematics and in the full rapidity range. Comparison of the Pythia8 generator with the ? 4C and AZ tunes to the muon-channel pZ T data and electron-channel φη data (top). Comparison of the Powheg+Pythia8 set-up with the 4C and AZNLO tunes to the same data (bottom). The vertical dashed lines show the upper limit of the tuning range.. indicating the limited accuracy of the NLO signal matrix element and suggesting the need for contributions from higher parton multiplicity. Tuned predictions based on the parameter values given in table 6 are produced in the different Z rapidity bins and compared to the measured cross sections with the aim of assessing how accurately the tune based on the inclusive measurement reproduces the data in each Z rapidity bin. The results are shown in figure 11. A satisfactory description. – 24 –. JHEP09(2014)145. Table 6. Final Pythia8 and Powheg+Pythia8 tuning results, and comparison to the Pythia8 base tune..
(26) Prediction/Data. Prediction/Data. Data uncertainty 0 ≤ |y | < 1. ATLAS. Z. PYTHIA8 4C. 1.2. PYTHIA8 AZ. 1. Data uncertainty 0 ≤ |y | < 1. 1.2. POWHEG+PYTHIA8 AZNLO. 1. 0.8 s = 7 TeV;. 0.8. ∫ Ldt = 4.7 fb. -1. 1. 10. s = 7 TeV;. 1. -1. 10. T. Prediction/Data. Prediction/Data. Data uncertainty 1 ≤ |y | < 2. ATLAS. Z. PYTHIA8 4C PYTHIA8 AZ. 1. Data uncertainty 1 ≤ |y | < 2. s = 7 TeV;. 1.2. POWHEG+PYTHIA8 AZNLO. 0.8. ∫ Ldt = 4.7 fb. -1. 1. 10. s = 7 TeV;. 102 pZ [GeV]. 1. ∫ Ldt = 4.7 fb. -1. 10. Data uncertainty 2 ≤ |y | < 2.4. ATLAS. Z. PYTHIA8 4C PYTHIA8 AZ. 102 pZ [GeV] T. Prediction/Data. Prediction/Data. T. 1. Data uncertainty 2 ≤ |y | < 2.4. ATLAS. Z. POWHEG+PYTHIA8 4C. 1.2. POWHEG+PYTHIA8 AZNLO. 1. 0.8 s = 7 TeV;. 1. ATLAS. Z. POWHEG+PYTHIA8 4C. 1. 0.8. 1.2. 102 pZ [GeV]. 0.8. ∫ Ldt = 4.7 fb. -1. 10. s = 7 TeV;. 102 pZ [GeV] T. 1. ∫ Ldt = 4.7 fb. -1. 10. 102 pZ [GeV] T. Figure 11. Tuned predictions based on table 6 for Pythia8 (left) and Powheg+Pythia8 (right) for 0 ≤ |yZ | < 1 (top), 1 ≤ |yZ | < 2 (middle) and 2 ≤ |yZ | < 2.4 (bottom), compared to the corresponding combined measurements, for dressed kinematics. The vertical dashed lines show the upper limit of the tuning range.. across rapidity is obtained in the case of Pythia8; in the case of Powheg+Pythia8, the prediction at low pZ T undershoots the data for 0 ≤ |yZ | < 1, and overshoots the data for 2 ≤ |yZ | < 2.4. The inclusive tune thus appears as a compromise between the different |yZ | regions in this case. The sensitivity of the parton shower tune to other model components provided in Pythia8, such as multiple parton interactions (MPI), which affect the event overall hadronic activity, was studied by varying the corresponding parameters. No effect on. – 25 –. JHEP09(2014)145. 102 pZ [GeV]. ∫ Ldt = 4.7 fb. T. 1.2. ATLAS. Z. POWHEG+PYTHIA8 4C.
(27) 11. Conclusion. A measurement of the Z/γ ∗ transverse momentum spectrum in the Z/γ ∗ → e+ e− and Z/γ ∗ → µ+ µ− channels with the ATLAS detector is presented, using 4.7 fb−1 of LHC √ proton-proton collision data at a centre-of-mass energy of s = 7 TeV. Normalized differZ ential cross sections as a function of pZ T are measured for the range 0 < pT < 800 GeV and the individual channel results are combined. The measurement is performed inclusively in rapidity, and for 0 ≤ |yZ | < 1, 1 ≤ |yZ | < 2 and 2 ≤ |yZ | < 2.4. The large data sample allows a fine binning in pZ T with a typical uncertainty on the combined result better than Z 1% for pT < 100 GeV, rising to 5% towards the end of the spectrum. The cross-section measurements are compared to pQCD and resummed predictions. While Fewz and Dynnlo do not include resummation and the observed disagreement at low pZ T is expected, ResBos and the NNLO+NNLL prediction of ref. [21] marginally agree with the data given the large uncertainties on these predictions. The data are also compared to predictions from Pythia6-AUET2B, Powheg+Pythia6-AUET2B, MC@NLO, Alpgen and Sherpa. The Pythia and Powheg generators agree with the data to within 5% in the range 2 < pZ T < 60 GeV and to within 20% over the full range, whereas Mc@nlo shows a deficit of about 40% at the end of the measured spectrum. Alpgen and Sherpa provide good agreement over a larger range, pZ T < 200 GeV, but overestimate the high end of the distribution. These patterns are compatible with what was observed for the φ?η measurement. Electroweak corrections and the choice of a dynamic QCD scale were found to have a significant impact on the predictions at high pZ T ; incorporating these improvements provides a better description of the measured distribution in the high pZ T region. Z The pT and φ?η measurements were used to tune the Pythia8 and Powheg+Pythia8 generators. Both measurements can be interpreted consistently in terms of the Z/γ ∗ bosons. – 26 –. JHEP09(2014)145. the parton shower parameters is found. In order to compensate for the changes in energy and particle flow induced by the modifications in the parton shower and primordial kT parameters, the pT threshold for the QCD 2 → 2 scattering processes used in MPI is changed from 2.085 GeV (tune 4C) to 2.18 GeV for Pythia8, following the underlying event data measured in Drell-Yan events by ATLAS [54]. For the Powheg+Pythia8 configuration, the interleaving of MPI in the parton shower model in Pythia8 is adapted to also properly take into account the Powheg emissions. It is tuned in the same way as Pythia8 in standalone mode and an optimized value of 2.00 for the low-pT regularization of MPI is found. Finally, comparing tunes based on the native Pythia8 QED final-state corrections with Pythia8 results using Photos for QED final-state radiation, the results are found insensitive to the differences in the QED FSR implementations. ? A consistent description of the pZ T and φη data is reached with a single tune. Both observables are also found to provide similar sensitivity to the parameters of interest. The inclusive tune provides an accurate description of the different rapidity bins in the case of Pythia8, while the agreement versus |yZ | is slightly worse in the case of Powheg+Pythia8..
(28) transverse momentum distribution and provide similar sensitivity to parton shower model parameters. The tuned predictions are in agreement with the data within 2% for pZ T below 50 GeV. The best description is provided by Pythia8, which is also able to describe the different rapidity intervals with a single tune.. Acknowledgments. Open Access. This article is distributed under the terms of the Creative Commons Attribution License (CC-BY 4.0), which permits any use, distribution and reproduction in any medium, provided the original author(s) and source are credited.. References [1] C. Balázs and C.P. Yuan, Soft gluon effects on lepton pairs at hadron colliders, Phys. Rev. D 56 (1997) 5558 [hep-ph/9704258] [INSPIRE]. [2] T. Sjöstrand, S. Mrenna and P.Z. Skands, PYTHIA 6.4 physics and manual, JHEP 05 (2006) 026 [hep-ph/0603175] [INSPIRE]. [3] G. Corcella et al., HERWIG 6: an event generator for hadron emission reactions with interfering gluons (including supersymmetric processes), JHEP 01 (2001) 010 [hep-ph/0011363] [INSPIRE].. – 27 –. JHEP09(2014)145. We thank CERN for the very successful operation of the LHC, as well as the support staff from our institutions without whom ATLAS could not be operated efficiently. We acknowledge the support of ANPCyT, Argentina; YerPhI, Armenia; ARC, Australia; BMWF and FWF, Austria; ANAS, Azerbaijan; SSTC, Belarus; CNPq and FAPESP, Brazil; NSERC, NRC and CFI, Canada; CERN; CONICYT, Chile; CAS, MOST and NSFC, China; COLCIENCIAS, Colombia; MSMT CR, MPO CR and VSC CR, Czech Republic; DNRF, DNSRC and Lundbeck Foundation, Denmark; EPLANET, ERC and NSRF, European Union; IN2P3-CNRS, CEA-DSM/IRFU, France; GNSF, Georgia; BMBF, DFG, HGF, MPG and AvH Foundation, Germany; GSRT and NSRF, Greece; ISF, MINERVA, GIF, I-CORE and Benoziyo Center, Israel; INFN, Italy; MEXT and JSPS, Japan; CNRST, Morocco; FOM and NWO, Netherlands; BRF and RCN, Norway; MNiSW and NCN, Poland; GRICES and FCT, Portugal; MNE/IFA, Romania; MES of Russia and ROSATOM, Russian Federation; JINR; MSTD, Serbia; MSSR, Slovakia; ARRS and MIZŠ, Slovenia; DST/NRF, South Africa; MINECO, Spain; SRC and Wallenberg Foundation, Sweden; SER, SNSF and Cantons of Bern and Geneva, Switzerland; NSC, Taiwan; TAEK, Turkey; STFC, the Royal Society and Leverhulme Trust, United Kingdom; DOE and NSF, United States of America. The crucial computing support from all WLCG partners is acknowledged gratefully, in particular from CERN and the ATLAS Tier-1 facilities at TRIUMF (Canada), NDGF (Denmark, Norway, Sweden), CC-IN2P3 (France), KIT/GridKA (Germany), INFN-CNAF (Italy), NL-T1 (Netherlands), PIC (Spain), ASGC (Taiwan), RAL (U.K.) and BNL (U.S.A.) and in the Tier-2 facilities worldwide..
(29) [4] K. Melnikov and F. Petriello, Electroweak gauge boson production at hadron colliders through O(αs2 ), Phys. Rev. D 74 (2006) 114017 [hep-ph/0609070] [INSPIRE]. [5] R. Gavin, Y. Li, F. Petriello and S. Quackenbush, FEWZ 2.0: a code for hadronic Z production at next-to-next-to-leading order, Comput. Phys. Commun. 182 (2011) 2388 [arXiv:1011.3540] [INSPIRE]. [6] Y. Li and F. Petriello, Combining QCD and electroweak corrections to dilepton production in FEWZ, Phys. Rev. D 86 (2012) 094034 [arXiv:1208.5967] [INSPIRE]. [7] M. Klasen and M. Brandt, Parton densities from LHC vector boson production at small and large transverse momenta, Phys. Rev. D 88 (2013) 054002 [arXiv:1305.5677] [INSPIRE].. [9] ATLAS collaboration, Measurement of the transverse momentum distribution of W bosons √ in pp collisions at s = 7 TeV with the ATLAS detector, Phys. Rev. D 85 (2012) 012005 [arXiv:1108.6308] [INSPIRE]. [10] CMS collaboration, Measurement of the rapidity and transverse momentum distributions of √ Z bosons in pp collisions at s = 7 TeV, Phys. Rev. D 85 (2012) 032002 [arXiv:1110.4973] [INSPIRE]. √ [11] ATLAS collaboration, Improved luminosity determination in pp collisions at s = 7 TeV using the ATLAS detector at the LHC, Eur. Phys. J. C 73 (2013) 2518 [arXiv:1302.4393] [INSPIRE]. [12] A. Banfi, S. Redford, M. Vesterinen, P. Waller and T.R. Wyatt, Optimisation of variables for studying dilepton transverse momentum distributions at hadron colliders, Eur. Phys. J. C 71 (2011) 1600 [arXiv:1009.1580] [INSPIRE]. [13] D0 collaboration, V.M. Abazov et al., Measurement of the shape of the boson transverse √ momentum distribution in pp̄ → Z/γ ∗ → e+ e− + X events produced at s = 1.96 TeV, Phys. Rev. Lett. 100 (2008) 102002 [arXiv:0712.0803] [INSPIRE]. [14] D0 collaboration, V.M. Abazov et al., Measurement of the normalized Z/γ ∗ → µ+ µ− √ transverse momentum distribution in pp̄ collisions at s = 1.96 TeV, Phys. Lett. B 693 (2010) 522 [arXiv:1006.0618] [INSPIRE]. [15] CDF collaboration, T. Aaltonen et al., Transverse momentum cross section of e+ e− pairs in √ the Z-boson region from pp̄ collisions at s = 1.96 TeV, Phys. Rev. D 86 (2012) 052010 [arXiv:1207.7138] [INSPIRE]. [16] ATLAS collaboration, Measurement of angular correlations in Drell-Yan lepton pairs to √ probe Z/γ ∗ boson transverse momentum at s = 7 TeV with the ATLAS detector, Phys. Lett. B 720 (2013) 32 [arXiv:1211.6899] [INSPIRE]. [17] LHCb collaboration, Measurement of the cross-section for Z → e+ e− production in pp √ collisions at s = 7 TeV, JHEP 02 (2013) 106 [arXiv:1212.4620] [INSPIRE]. [18] S. Catani, L. Cieri, G. Ferrera, D. de Florian and M. Grazzini, Vector boson production at hadron colliders: a fully exclusive QCD calculation at NNLO, Phys. Rev. Lett. 103 (2009) 082001 [arXiv:0903.2120] [INSPIRE]. [19] S. Catani and M. Grazzini, An NNLO subtraction formalism in hadron collisions and its application to Higgs boson production at the LHC, Phys. Rev. Lett. 98 (2007) 222002 [hep-ph/0703012] [INSPIRE].. – 28 –. JHEP09(2014)145. [8] ATLAS collaboration, Measurement of the transverse momentum distribution of Z/gamma* √ bosons in proton-proton collisions at s = 7 TeV with the ATLAS detector, Phys. Lett. B 705 (2011) 415 [arXiv:1107.2381] [INSPIRE]..
(30) [20] M. Guzzi, P.M. Nadolsky and B. Wang, Nonperturbative contributions to a resummed leptonic angular distribution in inclusive neutral vector boson production, Phys. Rev. D 90 (2014) 014030 [arXiv:1309.1393] [INSPIRE]. [21] A. Banfi, M. Dasgupta, S. Marzani and L. Tomlinson, Predictions for Drell-Yan φ∗ and QT observables at the LHC, Phys. Lett. B 715 (2012) 152 [arXiv:1205.4760] [INSPIRE]. [22] S. Frixione and B.R. Webber, Matching NLO QCD computations and parton shower simulations, JHEP 06 (2002) 029 [hep-ph/0204244] [INSPIRE]. [23] S. Alioli, P. Nason, C. Oleari and E. Re, NLO vector-boson production matched with shower in POWHEG, JHEP 07 (2008) 060 [arXiv:0805.4802] [INSPIRE].. [25] T. Gleisberg et al., Event generation with SHERPA 1.1, JHEP 02 (2009) 007 [arXiv:0811.4622] [INSPIRE]. [26] ATLAS collaboration, The ATLAS experiment at the CERN Large Hadron Collider, 2008 JINST 3 S08003 [INSPIRE]. [27] ATLAS collaboration, The ATLAS simulation infrastructure, Eur. Phys. J. C 70 (2010) 823 [arXiv:1005.4568] [INSPIRE]. [28] GEANT4 collaboration, S. Agostinelli et al., GEANT4: a simulation toolkit, Nucl. Instrum. Meth. A 506 (2003) 250 [INSPIRE]. [29] ATLAS collaboration, ATLAS tunes of PYTHIA 6 and PYTHIA 8 for MC11, ATL-PHYS-PUB-2011-009 (2011). [30] H.-L. Lai et al., New parton distributions for collider physics, Phys. Rev. D 82 (2010) 074024 [arXiv:1007.2241] [INSPIRE]. √ [31] ATLAS collaboration, Charged particle multiplicities in pp interactions at s = 0.9 and 7 TeV in a diffractive limited phase-space measured with the ATLAS detector at the LHC and new PYTHIA6 tune, ATLAS-CONF-2010-031 (2010). [32] A. Sherstnev and R.S. Thorne, Parton distributions for LO generators, Eur. Phys. J. C 55 (2008) 553 [arXiv:0711.2473] [INSPIRE]. [33] J.M. Butterworth, J.R. Forshaw and M.H. Seymour, Multiparton interactions in photoproduction at HERA, Z. Phys. C 72 (1996) 637 [hep-ph/9601371] [INSPIRE]. [34] ATLAS collaboration, New ATLAS event generator tunes to 2010 data, ATL-PHYS-PUB-2011-008 (2011). [35] R. Corke and T. Sjöstrand, Interleaved parton showers and tuning prospects, JHEP 03 (2011) 032 [arXiv:1011.1759] [INSPIRE]. [36] T. Sjöstrand, S. Mrenna and P.Z. Skands, A brief introduction to PYTHIA 8.1, Comput. Phys. Commun. 178 (2008) 852 [arXiv:0710.3820] [INSPIRE]. [37] P. Golonka and Z. Was, PHOTOS Monte Carlo: a precision tool for QED corrections in Z and W decays, Eur. Phys. J. C 45 (2006) 97 [hep-ph/0506026] [INSPIRE]. [38] S. Jadach, Z. Was, R. Decker and J.H. Kuhn, The τ decay library TAUOLA: version 2.4, Comput. Phys. Commun. 76 (1993) 361 [INSPIRE]. [39] C.M. Carloni Calame, G. Montagna, O. Nicrosini and A. Vicini, Precision electroweak calculation of the production of a high transverse-momentum lepton pair at hadron colliders, JHEP 10 (2007) 109 [arXiv:0710.1722] [INSPIRE].. – 29 –. JHEP09(2014)145. [24] M.L. Mangano, M. Moretti, F. Piccinini, R. Pittau and A.D. Polosa, ALPGEN, a generator for hard multiparton processes in hadronic collisions, JHEP 07 (2003) 001 [hep-ph/0206293] [INSPIRE]..
Figure
+7


Documento similar
63 Department of Physics and Astronomy, Iowa State University, Ames IA, United States of America. 64 Joint Institute for Nuclear Research, JINR Dubna,
6 High Energy Physics Division, Argonne National Laboratory, Argonne, IL, United States of America 7 Department of Physics, University of Arizona, Tucson, AZ, United States of
6 High Energy Physics Division, Argonne National Laboratory, Argonne, IL, United States of America 7 Department of Physics, University of Arizona, Tucson, AZ, United States of
78 Department of Physics and Astronomy, University College London, London, United Kingdom. 79 Louisiana Tech University, Ruston
87 The University of Michigan, Department of Physics, 2477 Randall Laboratory, 500 East University, Ann Arbor, MI 48109-1120, United States 88 Michigan State University, Department
4 (a) Department of Physics, Ankara University, Ankara, Turkey; (b) Istanbul Aydin University, Istanbul, Turkey; (c) Division of Physics, TOBB University of Economics and
64 Department of Physics and Astronomy, Iowa State University, Ames IA, United States of America. 65 Joint Institute for Nuclear Research, JINR Dubna,
In order to derive limits on new physics, the expected number of signal events for the event selections are estimated using simulated signal samples, taking into account uncer-
