Distribution and activity patterns in an intertidal grazer assemblage: influence of temporal and spatial organization on interspecific associations
18
0
0
Texto completo
(2) s. 120. Mar Ecol Prog Ser 431: 119–136, 2011. behavioral patterns (Palmer 1995). Thus, beyond individual and within-species variation, species can adopt different strategies to cope with the same general landscape of environmental and resource (e.g. food, shelter) heterogeneity (Pulliam 1989, Chapman & Underwood 1992, Legendre et al. 1997, Schmitz 2009). These behavioral patterns will in turn have effects on predation risks perceived by individuals, on the spatial patterns they exert on their resources, and on intraand/or interspecific interactions within their guild. Within guilds of grazing mollusks, which commonly are the most diverse taxa in temperate and tropical rocky shores (Lubchenco & Gaines 1981, Hawkins & Hartnoll 1983, Rivadeneira et al. 2002, Coleman et al. 2006), strikingly different activity and movement patterns have been observed among coexisting species (e.g. Branch 1981, Hawkins & Hartnoll 1983 for review). These behavioral repertoires can generate differential patterns of distribution and abundance in the guild (Underwood & Chapman 1996, Chapman 2000, Olabarria et al. 2002) and account for differences in specific grazing impacts, which cannot be inferred from their diets alone (Branch 1981, Chapman & Underwood 1992, Jenkins et al. 2005, Coleman et al. 2006). Comparatively few studies have evaluated how activity and movement patterns relate to intra- and interspecific spatial distributions and how these patterns vary when individuals are actively foraging or resting. This type of information can shed light on the biotic and/or abiotic processes that structure these assemblages and provide the basis for elaborate hypotheses about the role of species in ecosystem function (e.g. Schmitz 2009). For instance, species that present different foraging activities (e.g. diurnal versus nocturnal) are less likely to compete for shelter or engage in direct interference when grazing (Carothers & Jaksic 1984, Loreau 1992), although they could still compete for a common food resource (Jaksic 1982, Carothers & Jaksic 1984). Conversely, a species could compete and interfere with one species while foraging and with a different species or set of species while seeking shelter. Thus, the degree of spatial or temporal overlap during resting and foraging conditions within the guild can be very informative about interspecific interaction strength between species pairs, assemblage structure and the consumption pressure the species exert on their prey. The coast of central Chile is characterized by a semidiurnal tidal regime of ~1.70 m amplitude and the predominance of rocky shores directly exposed to wave action (Castilla 1981, Finke et al. 2007). Approximately 10 to 24 species comprise the intertidal mollusk grazer assemblage along the coast of Chile (Rivadeneira et al. 2002), with roughly 7 to 9 common species coexisting locally at mid to high intertidal lev-. els (Otaíza & Santelices 1985, Santelices et al. 1986). Extensive analysis of stomach contents and grazer abundance conducted at a site in central Chile showed ample overlap in the diet of the most common species (Santelices et al. 1986), with all species consuming epilithic, green and crustose (calcareous and fleshy) algae. Slight differences in diet between species were partly related to morphological differences in their radula (as suggested by Steneck & Watling 1982), but also to habitat and behavioral differences (Santelices et al. 1986). Slight differences in diet, together with large differences in body size and biomass, can lead to marked differences in the impact these species can have on algal assemblages (see Wieters et al. 2003, Aguilera & Navarrete 2007). Furthermore, previous studies (e.g. Santelices et al. 1986) and field observations suggest patchiness in the micro-scale (cm) spatial distribution of some species, apparently related to the spatial structure of the habitat. Further research on grazer diets conducted by Camus et al. (2008) at multiple sites in northern Chile has highlighted the high frequency (> 40%) at which invertebrate items are included in the diet of most grazer species (see also Otaíza & Santelices 1985, Aguilera 2005, Aguilera & Navarrete 2007), including a high representation of individuals of other herbivores within the same guild (Aguilera 2005, Camus et al. 2008). This high level of intraguild predation (sensu Polis & Holt 1992), together with low levels of cannibalism (Camus et al. 2008), suggest that interspecific interactions within the grazer guild might be more important and more complex than previously envisioned. In the present study, we examined the spatial patterns of distribution and activity of the 4 most common grazer species present in central Chile, which inhabit the mid –low to the high intertidal zone (i.e. 0.5 to 3.0 m), in order to evaluate the spatial and temporal (i.e. behavioral) associations within the molluscan assemblage. We also evaluated the level of variation in activity and spatial patterns between sites located a few kilometers apart and compared them to among-species variability. Considering the ample diet overlap among the 4 species, and potential patchiness in the distribution of some species at micro-scales, we hypothesized that, if interspecific interactions are important: (1) species should exhibit different patterns of diel foraging activity; (2) those that do overlap in activity rhythms should exhibit negative spatial associations while foraging and resting, unless they use different resting microhabitats (e.g. flat surfaces versus crevices); and (3) there should be no spatial associations between gregarious and non-aggregated species during resting, but they could exhibit negative (or positive) associations while foraging..
(3) Aguilera & Navarrete: Grazer distribution, activity and interspecific patterns. MATERIALS AND METHODS Grazer assemblage and study sites. The study was conducted at 2 sites located in central Chile, Pelancura (33° 33’ S, 71° 37’ W) and Las Cruces (32° 43’ S, 71° 38’ W), which are separated by ~5 km. Pelancura is an extensive rocky shore directly exposed to the prevailing southwestern swell. Las Cruces, where most observations were conducted, is located ~500 m south of the marine reserve of the Estación Costera de Investigaciones Marinas (ECIM). This stretch of coastline faces toward the south–southeast whereas Pelancura faces west, and so the latter receives more direct breaking waves than Las Cruces. The sites show a similar intertidal species composition, which conforms well to the general pattern reported for other sites in central Chile (see Santelices et al. 1986, Fernández et al. 2000, Broitman et al. 2001). The most common molluscan herbivores at the mid intertidal levels are chitons (~2 species; Otaíza & Santelices 1985, Aguilera & Navarrete 2007), scurrinid limpets (~2–4 species; see Espoz et al. 2004), fissurellid limpets (~3–4 species; see Oliva & Castilla 1986) and a pulmonate limpet species. In this study we concentrated on the 4 most abundant species in terms of total biomass: the chiton Chiton granosus, the pulmonate limpet Siphonaria lessoni, the scurrinid limpet Scurria araucana and the keyhole limpet Fissurella crassa. Additional observations were also conducted on Scurria ceciliana, which, in certain habitats (i.e. mussel beds), can be more abundant than S. araucana. Because F. crassa is commercially exploited, abundance of large adult individuals is generally low at open-access shores compared with in reserves (Oliva & Castilla 1986). Therefore, we also recorded the behavior of large individuals inside the ECIM marine reserve. Spatial distribution. To quantify grazer density, we counted all individuals in fifty 30 × 30 cm quadrats, haphazardly positioned along 15 m transects at midintertidal levels at each study site in October and November 2007, and again in April 2008 at both study sites. To determine whether individuals were randomly distributed (i.e. spatially independent), aggregated or more uniformly distributed over the platforms, we followed 2 approaches. The first approach was density based. We positioned contiguous quadrats of 3 different sizes (15 × 15 cm, 30 × 30 cm and 50 × 50 cm) along 15 m transects parallel to the shoreline in the mid intertidal zone of Las Cruces and counted the number of individuals of all target species in each quadrat. These preliminary surveys gave us information about the quadrat size (‘grain’) that was most appropriate to describe distributional patterns of the focal species through autocorrelation analyses (e.g. Fortin & Dale. 121. 2005). Briefly, when autocorrelation using the first distance class is not significant (random distribution of grazers in space) or is negative, it is considered an indication that the sampling unit size is larger than the spatial pattern, or that the quadrat size scale includes more than one process (Fortin 1999). Thus, 50 × 50 cm quadrats were considered uninformative for all focal species (results not shown). Quadrats 15 × 15 cm in size were informative only for Scurria ceciliana, whereas 30 × 30 cm quadrats were appropriate for all focal species (see ‘Results’). Hence, we conducted surveys using 30 × 30 cm quadrats during daytime low tide and the subsequent night-time low tide on the same rocky platforms (45 quadrats for each phase). In addition, the percentage of rock encompassed by crevices was measured using a 30 × 30 cm quadrat with 81 intersection points. A similar procedure was conducted at Pelancura, but for simplicity we present correlograms for Las Cruces only. The second approach was based on linear interindividual (nearest neighbor, NN) distances (see Clark & Evans 1954, Pielou 1961). Previous studies have used this sampling procedure to describe spatial patterns and interspecific associations in mobile grazers (see Branch 1976, Underwood 1976, Levings & Franks 1982). We delimited 4 adjacent 3 × 3 m areas at Pelancura and Las Cruces and then randomly sampled individuals of each species, measuring the linear distance (cm) to the closest conspecific during the day in one area and at night in the other area (number of individuals sampled for each area: 25 Fissurella crassa, 150 Siphonaria lessoni, 90 Chiton granosus and 50 Scurria araucana). In the third and fourth 3 × 3 m areas we recorded NN distances to heterospecific individuals during the day and at night, respectively (individuals sampled for each area: 23 F. crassa, 200 S. lessoni, 80 C. granosus and 52 S. araucana). In this manner, we obtained independent data sets for intra- and interspecific NN distances during the day and at night. We measured distances when individuals were motionless, either resting or feeding. Thus, the distribution of individuals could change over time but, through random sampling throughout a tidal cycle, we could compare foraging and resting phases. Activity rhythms. Field: Observations to characterize activity rhythms were conducted at Las Cruces in December 2007 and April to October 2008, and in November and December 2007 and April to June 2008 at Pelancura. A total of 50 adults (100 for Siphonaria lessoni) of each species (mean length ± SD: Chiton granosus = 5.5 ± 0.37 cm; Fissurella crassa = 7.1 ± 3.9 cm; Scurria araucana = 2.6 ± 1.2 cm; S. lessoni = 0.97 ± 0.07 cm) were marked with bee tags carefully glued directly to the shell (fifth-plate of chitons), without dislodging the individuals from the substratum and caus-.
(4) 122. Mar Ecol Prog Ser 431: 119–136, 2011. ing as little disturbance as possible. Then, we monitored the number of active (foraging) and inactive (resting) individuals at 15 min intervals for ≥3 h during 2 to 3 consecutive days/nights. Laboratory: Because of the difficulty of observing individuals during high tides on wave-exposed platforms, we also quantified the activity of individuals under laboratory conditions. Approximately 10 to 12 (20 for Siphonaria lessoni) individuals of each species were collected during low tides at Las Cruces and placed in separate ‘arenas’ at the ECIM laboratory. Experimental arenas consisted of 40 × 40 cm concrete blocks with a 20 × 8 × 4 cm crevice carved in the center to provide shelter. The arenas were surrounded with a 10 cm high fence made of coarse plastic mesh to prevent animals from abandoning the blocks, and the units were randomly placed inside separate aquaria with running seawater and air. High and low tides were simulated by completely immersing and completely exposing arenas to air following the natural tidal cycle observed at the time of experiments. Food was provided ad libitum in the form of a mix of Ulva spp. and fronds of the corticated alga Mazzaella laminarioides, which were directly glued to acrylic plates and affixed to concrete blocks. Microalgae were allowed to settle and grow on the block, thus providing an additional source of food. The number of individuals inside the experimental arenas was chosen according to the natural density of individuals observed in the field when animals are resting: 6 Chiton granosus, 10 S. lessoni, 2 Scurria araucana and 2 Fissurella crassa. There were 2 replicates per species. We recorded the number of active individuals at 3 h intervals throughout the day and night for 7 consecutive days. Displacement and homing behavior. To describe the spatial extension of displacement of individuals while foraging and to quantify the degree of homing behavior (resting place fidelity), we used 2 different but complementary methodologies. First, we recorded changes in the position of marked individuals (the same individuals as those used for assessing activity rhythms in the field) using triangulation in an x–y coordinate system (Focardi & Chelazzi 1990). To this end, we fixed a 5 m measuring tape to a gently sloping 13 m platform located at Las Cruces and registered the position of individuals along this x-axis. With another measuring tape, extended perpendicular to the first axis, we recorded the position of the individuals along the y-axis. The position of individuals was recorded every 12 h, according to the resting–foraging phases observed for most species, during diurnal and nocturnal low tides for 7 consecutive days. Displacement was calculated as the minimum Euclidean distance (diagonal) between consecutive positions. The activity phase for nocturnal foragers (see ‘Results’) was defined. as the change in position between the diurnal initial location (Dj), the nocturnal location (Nj), and the following diurnal location (Dj+1) (Focardi & Chelazzi 1990). For diurnal foragers, the initial location was nocturnal (Nj ). Second, to obtain more precise estimates of displacement and homing behavior, we recorded the distance (paths) traveled by marked individuals (the same individuals as those used for assessing activity rhythms in the field) at intervals of 15 to 30 min for 3 to 5 h during the low tide, over 5 to 7 consecutive days. The distance traveled was measured from the site where individuals were observed inactive at the first low tide (resting site), which was marked with epoxy and considered as a ~5 cm diameter around the individual, in the case of solitary individuals, and as an oval ca. 5 to 10 cm in diameter around a clump of individuals in the case of aggregations. Observations were conducted during 2 separate weeks in April 2008 for Scurria araucana and Siphonaria lessoni (Las Cruces), and during 2 separate weeks in April 2009 for Chiton granosus and S. lessoni (Las Cruces). For Fissurella crassa, observations were conducted during 1 wk in October, November and December 2008. Because most F. crassa marked at Las Cruces were lost (probably to human gathering), we conducted observations on this species inside the ECIM marine reserve. Although studies on other systems have shown seasonal variation in behavioral patterns (e.g. Gray & Hodgson 1997), we did not detect differences in spatial patterns, activity rhythms or displacement distances among surveys or in comparison with previous studies by Serra et al. (2001) on F. crassa inside the ECIM marine reserve or by Aguilera & Navarrete (2007) on C. granosus on other exposed platforms. Therefore, data from different surveys were pooled for analyses (see below). With this information we computed an index of relative homing error (RHE) (Focardi & Chelazzi 1990) as: RHE = HE/L, where HE corresponds to homing error (i.e. Dj minus Dj+1 for nocturnal foragers, and Nj minus Nj+1 for diurnal foragers), and L = length of foraging excursion. Animals with RHE = 0 exhibit a strong homing performance and RHE = 1 a complete dispersive pattern. Data analysis. The spatial structure of grazer density was analyzed using Moran’s I spatial correlograms (Sokal & Oden 1978, Fortin & Dale 2005) separately for each species and day/night surveys. As recommended (Rossi et al. 1992, Erlandsson et al. 2005), we only interpreted distances less than half the transect length because correlograms do not represent significant information at lags longer than this scale because of the decrease in degrees of freedom (few distance pairs) (Legendre & Fortin 1989). To determine whether autocorrelation coefficients were significant at α = 0.05, we used bootstrapping (Manly 1997), which com-.
(5) Aguilera & Navarrete: Grazer distribution, activity and interspecific patterns. pares the autocorrelation statistic (Moran’s I) calculated for the observed data with the distribution of values obtained by randomly sampling the data set and recalculating the coefficients 1000 times. Before examining individual significance values in the correlogram, we performed a global test by checking whether the correlogram contained at least one significant correlation after probabilities were adjusted using a Bonferroni correction for multiple tests (α = 0.05/number of distance classes). Before analyses, data were normalized to zero mean and unit variance to remove outliers. To evaluate the degree of positive/negative spatial association among grazer species and between grazers and crevices (percent cover at the 30 × 30 cm scale), we used simple Pearson linear correlations (r). In general, NN distances are difficult to analyze by conventional statistics because of non-independence due to the existence of reflexive NN pairs (i.e. when 2 points are mutual nearest neighbors; see Cox 1981). Moreover, changes in mean or median distance between conditions (day/night) or species can occur because of changes in distribution or density, which makes it difficult to interpret results of null hypothesis tests. Therefore, we first visually examined the distribution of conspecific NN distances between the resting and foraging phases, among species and between the 2 sites. We determined the general form of the spatial distribution by calculating the mean NN distance (dA, where d is the distance in cm from a given individual to its nearest neighbor and A is the total survey area) and compared it with the expected (E) NN distance based on a random distribution model: dE = 1⁄2√ρ where ρ is the density of individuals within the survey area (Clark & Evans 1954). Thus, the R-statistic = dA/dE provides a measure of the level of aggregation (R close to 0) or random (R close to 1) or uniform (R close to 2.15 for perfect overdispersion) distribution (Clark & Evans 1954, see also Fortin & Dale 2005). Because no large differences were observed between sites (see ‘Results’), for the sake of space we present NN distribution figures for Las Cruces only. Interspecific NN distances are also complex to analyze because the expected distance between 2 species, in the absence of any interaction, depends on the distributions of the 2 intraspecific distances (Dixon 1994). Therefore, we used 2 complementary approaches. First, we visually examined NN distributions and changes in the median and mean intra- versus interspecific distances during resting and foraging. Second, we estimated the degree of segregation between all possible pairs of species during resting and foraging following the general method of NN abundance proposed by Pielou (1961). The method is based on the relative abundance of conspecific and heterospecific neighbors within a certain distance from focal individ-. 123. uals. Thus, 2 species are segregated if the ratio of conspecific to heterospecific nearest neighbors is greater than expected by chance and attracted when the ratio is less than expected. The Sij index proposed by Dixon (1994), based on the observed frequency of conspecific neighbors relative to the expected frequency of each species was calculated as: Sij = log(nii /nij)/(Ni –1)/Nj, where nii is the number of grazer species i with conspecific neighbors i, and nij is the number of grazer species i with heterospecific neighbors j, Ni and Nj are the total number of grazers considered of species i and j, respectively. Thus, Sij < 0 indicates interspecific spatial segregation, Sij > 0 an attraction and Sij = 0 a random pattern. A 2 df significance test proposed by Dixon (1994), which takes into account reflexive points, was used to test whether the observed segregation index was different from randomly labeling species positions. To determine differences in grazer activity in the laboratory trials between immersed individuals (high tide) and those exposed to air (low tide), we conducted a 2-way ANOVA on log + 1 transformed proportions of active animals, considering tide condition and grazer species as fixed factors. Log transformation was necessary to achieve homoscedasticity. For this analysis, we only considered those records in which animals were observed active during the daily phase of activity. Position of individuals between successive field surveys in the x–y coordinate system allowed us to estimate orientation of grazer displacements while foraging. Thus, circular statistics (i.e. mean, variance and concentration; Batschelet 1981) were computed with Oriana version 3.0 (Kovach Computing). Mean values are presented ± SE.. RESULTS Spatial distribution The grazers Chiton granosus, Siphonaria lessoni, Scurria araucana and Scurria ceciliana were the most abundant species in terms of number of individuals at mid intertidal levels at the 2 study sites (Fig. 1), whereas the larger keyhole limpet Fissurella crassa was found at much lower densities. Small-bodied species of chitons, snails and limpets, pooled together as ‘other grazers’ (Austrolittorina araucana, Nodilittorina peruviana, Chiton cumingsi, C. barnesii and Onchidiella sp.) accounted for 48.2 and 49.6% of overall molluscan grazer density at Las Cruces and Pelancura, respectively. Contiguous quadrat sampling revealed different spatial patterns among species and, in some cases, marked diel variability within species. Only small differences in spatial distribution patterns were observed.
(6) 124. Mar Ecol Prog Ser 431: 119–136, 2011. Las Cruces Pelancura. Siphonaria Scurria lessoni araucana. 1. Day 0.075 –0.090. O gr th az er er s. 0.1. gr Chi an to o n Si sus ph le on ss a on ria i S ar cu au rr ca ia n Sc a ce u ci rri lia a n Sc a va u ria rri bi a l Sc is ze ur br ria in Fi a ss cr ur as el sa la. Log10 density (ind./900 cm–2). 10. Table 1. Pearson linear correlations (r) between molluscan grazer densities, and between grazer density (ind./900 cm2) and crevice cover (%) measured in 30 × 30 cm quadrats, for day and night low tides at Las Cruces (first line) and Pelancura (second line). Significant correlations (p < 0.05) are in bold. Fig. 1. Benthic grazers (means + SE) measured with 30 × 30 cm contiguous quadrats in the mid-intertidal zone of Pelancura and Las Cruces. ‘Other grazers’ is the pooled number of small or rare mollusk species at the mid-intertidal level (Austrolittorina araucana, Nodilittorina peruviana, Chiton cummingsi, C. barnesii and Onchidella sp.). Dotted line: density of 1 ind./900 cm2. between sites (Table 1). Here we describe the correlogram-based patterns observed at Las Cruces and note the differences with Pelancura. During daytime at Las Cruces, the distribution of Chiton granosus while resting (see below) was patchy at the scale of the smallest distance class (30 to 60 cm; Fig. 2b) and no other significant structure was observed at other spatial scales (Fig. 2a,b). The distribution of C. granosus during daytime was significantly positively correlated with the distribution of crevices along the same platform at both sites (Table 1). At night, C. granosus individuals spread out slightly, showing a patchy distribution at ~90 cm as they left the crevices to forage (scale where correlogram crosses from positive to negative autocorrelation values, see Fig. 2b). In this case, a positive correlation was observed at ~300 cm (Moran’s I = 0.298, p = 0.0069), which is probably the mean distance between aggregations of feeding individuals. Nonsignificant correlations were observed during this phase between C. granosus and crevice cover at both sites (Table 1). Consequently, a weakly negative, although non-significant, correlation between day and night quadrat densities was observed in this species (Fig. 2a). In the case of Siphonaria lessoni, daytime correlograms, when individuals were actively foraging, showed weak spatial aggregation over scales of ~250 cm (Fig. 2d). We interpret this as the scale separating aggregations of individuals. A generally similar trend was observed at nighttime, when they were usu-. Fissurella Crevice crassa. –0.104 0.031. 0.495 0.327. 0.560 0.326. Chiton granosus. 0.454 0.261. –0.179 –0.110. 0.395 –0.107. S. lessoni. 0.177 –0.055. –0.204 –0.151. S. araucana. 0.113 0.216 Night –0.269 –0.038. F. crassa. 0.136 0.031. 0.348 0.220. –0.028 0.217. 0.102 –0.001. –0.372 –0.108. 0.157 0.012. S. lessoni. 0.188 0.227. 0.274 0.226. S. araucana. –0.162 –0.066. C. granosus. F. crassa. ally found resting inside crevices, but the scale of aggregations was reduced to ~30 cm (Fig. 2d). Significant positive correlations between day and night quadrat densities also suggest that individuals have similar spatial distributions while resting and foraging (see Fig. 2c). Furthermore, this pulmonate limpet showed a significant positive correlation with crevice cover during daytime at Las Cruces, but this correlation was negative at Pelancura during this phase. Correlations in this species were non-significant but positive during nighttime at the 2 sites (Table 1). In the case of Scurria araucana, the correlogram for daytime observations, when individuals were largely resting, showed a spatial structure similar to that of S. lessoni, with aggregations of ~250 cm. At nighttime, the spatial distribution appeared to be random, without indication of aggregation at the smallest (30 cm) spatial scales (Fig. 2e,f), and there was no significant association with crevice cover at either site (Table 1). The most contrasting spatial patterns were observed in Fissurella crassa, which showed no significant structure at any spatial scale, either during daytime or nighttime observations (Fig. 2h). Spatial interspecific associations among grazers were consistent between study sites for most species pairs (Table 1). The density of Chiton granosus and Fissurella crassa showed a strong positive correlation both during daytime, when they were resting in crevices, and during nighttime, when they were forag-.
(7) 125. Aguilera & Navarrete: Grazer distribution, activity and interspecific patterns. Chiton granosus r = –0.179 p = 0.344. a. 20. Day Night. 1. Day Significant Non-significant. b. Night Significant Non-significant. 0.6. 15. 0.2 0 –0.2. 10 5. –0.6. 0. –1 0. 200. 400. 600. 800. 1000. 100. 200. 300. 400. 500. 100. 200. 100. 200. 300. 400. 500. 100. 200. 300. 400. 500. Siphonaria lessoni c. 40. r = 0.451 p = 0.012. 1 0.6. 30. 0.2 0 –0.2. 20 10. –0.6 –1. 0 0. 200. 400. 600. 800. 1000. Scurria araucana 10. r = 0.149 p = 0.431. e. 8. Moran's I. No. of individuals. d. 1. 300. 400. 500. f. 0.6 6 0.2 0 – 0.2. 4 2. – 0.6 –1. 0 0. 200. 400. 600. 800. 1000. Fissurella crassa 4. r = –0.038 p = 0.841. g. 1. 3. h. 0.6 0.2 0 –0.2. 2 1. – –0.6 0. –1 0. 200. 400. 600. 800. 1000. Distance (cm) Fig. 2. Density of species along the wave exposed platforms (a,c,e,g) and corresponding Moran’s I spatial correlograms (b,d,f,h) of the 4 molluscan grazer species: Chiton granosus, Siphonaria lessoni, Scurria araucana and Fissurella crassa. Density was measured with 30 × 30 cm quadrats in the mid-intertidal zone at Las Cruces. Pearson’s correlation coefficients and significance levels between day and night sampling are also presented. Solid symbols in correlograms indicate significant correlations (α = 0.05) after random permutation tests (1000 permutations) and Bonferroni correction. See text for details.
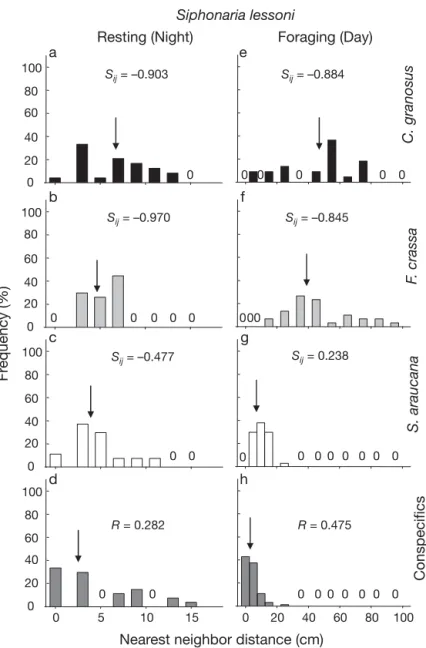
(8) 126. Mar Ecol Prog Ser 431: 119–136, 2011. S. araucana Conspecifics. Frequency (%). F. crassa. S. lessoni. ing (Table 1). Similarly, the density of Scurria Chiton granosus araucana was strongly and positively associForaging (Night) Resting (Day) e a ated with the density of Siphonaria lessoni Sij = –0.775 100 Sij = –0.686 during daytime, but the relationship disap80 peared during nighttime when S. lessoni was 60 resting (Table 1). In contrast, F. crassa was negatively, but weakly, associated with S. 40 lessoni during daytime and particularly at 20 nighttime at the 2 study sites. Correlations 00 0 0 0 0 0 between the other species fluctuated in direcb f tion between daytime and nighttime observa100 Sij = 0.044 Sij = 0.131 tions. Non-significant correlations were obser80 ved between S. lessoni and C. granosus and 60 between S. lessoni and S. araucana at the 2 study sites (Table 1). 40 In general, Euclidian NN distances among 20 0 0 0 0 0 conspecifics changed between the foraging 0 and resting phases for most species (Figs. 3–6, c g 100 panels d and h). In the case of Chiton granosus Sij = 0.054 Sij = –0.041 and Siphonaria lessoni, we observed a high 80 frequency of individuals in contact with each 60 other (distance zero, median NN = 0) during 40 the resting phase (87.9 and 57.1% for daytime 20 and nighttime observations, respectively). 0 0 0 0 0 00 0 0 Consequently, the R-statistic (Clark & Evans d h 1954) indicated a significantly aggregated 100 distribution for both species, although it was 80 slightly stronger in C. granosus than in S. lesR = 0.440 R = 0.156 60 soni (Figs. 3 & 4, compare panels d and h). When foraging at night, C. granosus spread 40 out from the aggregations, increasing the me20 dian distance between individuals to 3.54 cm, 0 0 0 0 0 which was also reflected in the R-statistic, but 0 10 20 30 40 50 0 10 20 30 40 50 they still conformed to an aggregated distriNearest neighbor distance (cm) bution (Fig. 3h). In contrast, S. lessoni did not Fig. 3. Frequency distribution of nearest neighbor (NN) distances (cm) for substantially change NN distances when forthe chiton Chiton granosus at mid-intertidal levels at Las Cruces during aging and the R-statistic showed virtually no resting (a–d) and foraging (e–h). Distances to individuals of other grazer change (see Fig. 4h). Thus, the NN distances species and to conspecific individuals are shown in different panels. Arrows indicate the median NN distance. The segregation index (Sij; see for the chiton and pulmonate limpet are in Dixon 1994) is presented for all heterospecific comparisons, where negageneral agreement with the quadrat-based tive values indicate segregation and positive values indicate attraction. analyses, suggesting the existence of tight The R-statistic (Clarke & Evans 1954) is presented for conspecific NN disaggregations in these species at the scale of tances, where values close to 0 indicate aggregated pattern whereas quadrat size (ca. 30 cm) and significant spatial those close to 1 indicate a random pattern of distribution. Full species names in Fig. 1 structures again at around 300 cm, probably reflecting patchiness of aggregations. In the apparent when measuring individual distances. The case of Scurria araucana, few individuals were in confrequency of individuals in contact with each other was tact with each other (<10% zero distances), the median also low (16.6%) in Fissurella crassa. Individuals of distance was ~5.4 cm (Fig. 5d) and the R-statistic this species tend to be at a median distance of 5.5 cm showed values that suggested a nearly random distribapart during resting (mean = 12.6 ± 2.24 cm) and ution. When foraging, the median distance increased the R-statistic showed a nearly random distribution to 7.0 cm, but the R-statistic still conformed to a nearly (Fig. 6d). However, while foraging, the inter-individual random distribution (Fig. 5h). The positive correlation distance increased to a median of 28.0 cm (mean = (aggregated pattern) at the scale of quadrat size and 30.7 ± 2.87 cm) and the R-statistic showed a more unithe spatial structure at scales of ~250 cm shown by the form distribution (Fig. 6h). quadrat-based correlogram (see Fig. 2f) were not.
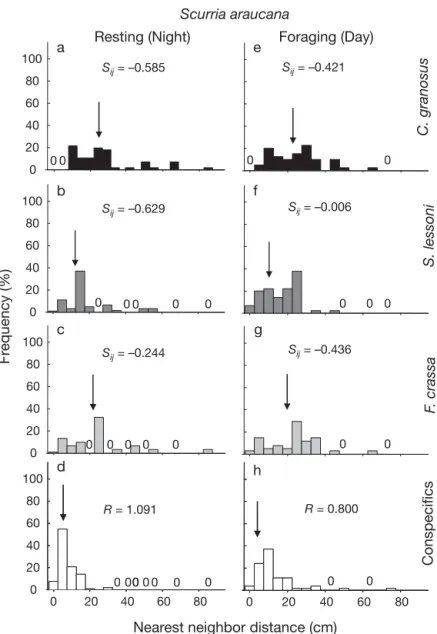
(9) Aguilera & Navarrete: Grazer distribution, activity and interspecific patterns. 127. diel difference was similar to that observed in Las Cruces (Table 2). Resting (Night) Foraging (Day) The values of the Sij segregation index a e (Dixon 1994) were in general agreement with 100 Sij = –0.903 Sij = –0.884 observed differences in median heterospecific 80 NN distances. In the case of Chiton granosus 60 during the resting phase (Fig. 3, left panels), the median distances to Scurria araucana and 40 Fissurella crassa (Fig. 3b,c) were only slightly 20 larger (median = 3.5 and 5.0 cm, respectively) 0 0 0 0 0 0 0 than distances to conspecifics (median = 0 cm, b f see Fig 3b–d), whereas distances to Siphonaria 100 Sij = –0.970 Sij = –0.845 lessoni (Fig. 3a) were over 25.0 cm larger than 80 those between conspecifics (compare Fig. 3a 60 and 3d). Similarly, Sij values showed a high level of segregation between resting C. gra40 nosus and S. lessoni and a slight attraction of C. 20 granosus to S. araucana and particularly F. 0 0 0 0 0 000 0 crassa. When C. granosus individuals were c g 100 foraging (Fig. 3, right panels) and tended to Sij = 0.238 Sij = –0.477 be slightly more dispersed (median = 3.15 cm; 80 Fig. 3h), interspecific distances to S. araucana 60 and F. crassa were further reduced (median = 40 4.2 and 4.4 cm, respectively). Distances to 20 S. lessoni in this activity phase were also 0 0 0 0 0 0 0 0 0 0 shorter than when individuals were resting 0 (compare Fig. 3e and 3h), but remained larger d h 100 than distances to other species (Fig. 3f,g). Sim80 ilarly, the segregation index showed larger R = 0.282 R = 0.475 segregation from S. lessoni and attraction to F. 60 crassa. Resting S. lessoni were observed in 40 close proximity to S. araucana and F. crassa, 20 although they were never in direct contact 0 0 0 0 0 0 0 0 0 with the latter (Fig. 4b,c). The Sij index showed 0 0 5 10 15 0 20 40 60 80 100 high segregation from F. crassa and low levels Nearest neighbor distance (cm) of segregation from S. araucana (Fig. 4b,c), but because of low sample size (n = 40), the estiFig. 4. Frequency distribution of nearest neighbor distances (cm) for the mated index for F. crassa must be interpreted pulmonate limpet Siphonaria lessoni at mid-intertidal levels at Las Cruces with caution. In agreement with observations during resting (a–d) and foraging (e–h). See Fig. 3 legend for details. Full species names in Fig. 1 on chitons as the focal species, the distances between S. lessoni and C. granosus were much In general, the spatial distribution of grazers belarger than to conspecifics (Fig. 4a) and the Sij index sugtween the study sites tended to be consistent for each gests strong segregation between these species. Interspecies (Table 2), with generally slight variations in the estingly, because active (foraging) S. lessoni showed R-statistic, probably attributed to slight differences in an aggregated distribution, interspecific distances to density (see Fig. 1) and micro-scale habitat conditions foraging F. crassa increased slightly and the Sij index suggested strong segregation during this activity phase between these sites. The species Chiton granosus and (Fig. 4). In the case of the limpet S. araucana as a focal Siphonaria lessoni had aggregated patterns of distribspecies, we observed only slight changes in median inution and similar diel differences at Las Cruces and terspecific distances during resting or foraging (Fig. 5). Pelancura whereas Scurria araucana conformed to a The Sij index suggested a pattern of segregation from nearly random distribution and Fissurella crassa to a more uniform distribution at both sites (Table 2). The C. granosus and F. crassa during resting and foraging, largest difference between sites was observed in respectively (see Fig. 5a,c,e,g), and from S. lessoni only S. lessoni, which exhibited a stronger nighttime aggrewhen resting (Fig. 5b). F. crassa tended to stay in close gation at Pelancura than at Las Cruces, but the general proximity to C. granosus at resting, even closer than the. S. araucana. Conspecifics. Frequency (%). F. crassa. C. granosus. Siphonaria lessoni.
(10) 128. Mar Ecol Prog Ser 431: 119–136, 2011. individuals found active during day or night low tides (Fig. 7). Averaging across surveys Resting (Night) Foraging (Day) and sites, neap–spring tidal cycle had no a e 100 effect on grazer activity, except for a slight Sij = –0.421 Sij = –0.585 increase in the diurnal activity of Scurria 80 araucana during neap tides compared with 60 spring tides (Fig. 8a,b). Chiton granosus 40 and Fissurella crassa showed well-defined 20 cycles of nocturnal activity and resting dur0 0 00 0 ing the day whereas Siphonaria lessoni exhibited daytime activity (Fig. 8a,b). In b f 100 general, chitons were active between 20:00 = –0.006 S Sij = –0.629 ij 80 and 04:30 h, both during spring and neap tides. F. crassa showed peak activity after 60 sunset, around 19:00 h and between 03:00 40 and 05:00 h in the morning, and S. lessoni 20 were active at dusk, around 05:30 h, as well 0 0 0 0 00 0 0 0 as during mid-morning and afternoon low c g tides. Although we could not make detailed 100 Sij = –0.436 high tide observations, movement and forSij = –0.244 80 aging of S. lessoni clearly decreased with incoming tides. S. araucana showed the 60 most variable activity rhythm: this species 40 exhibited both day and nighttime activity, 20 particularly during neap tide (Fig. 8a). 0 0 0 0 0 0 0 0 Laboratory results showed similar day/ d h night activity patterns to those observed in 100 the field (Fig. 8c) and only slight differences 80 R = 0.800 R = 1.091 between low (emersion) and high (immer60 sion) tides (Fig. 8d). The largest differences 40 between field and laboratory observations were observed in Scurria araucana and 20 0 0 0 00 0 00 0 0 Siphonaria lessoni. The former was slightly 0 0 20 40 60 80 0 20 40 60 80 more active during daytime than nighttime hours in the laboratory than in the field and Nearest neighbor distance (cm) slightly more active when immersed than Fig. 5. Frequency distribution of nearest neighbor distances (cm) for the when exposed to air (Fig. 8c,d). In the case scurrinid limpet Scurria araucana at mid-intertidal levels at Las Cruces of S. lessoni, individuals were mostly active during resting (a–d) and foraging (e–h). See Fig. 3 legend for details. Full during daytime, as observed in the field, species names in Fig. 1 but on some occasions activity extended to early nighttime hours (~20:00 h) in the laboratory (see median distance to conspecifics (median = 0.5 cm to C. Fig. 8c). No differences in activity were observed in granosus versus 5.5 cm to conspecifics; Fig. 6). In accorthis species when immersed or exposed to air (Fig. 8d). dance, the segregation index showed attraction between Consequently, a 2-way ANOVA showed no significant these species during this activity phase (Fig. 6a). At differences between activity in immersion and air night, when F. crassa were foraging, distances to conexposure for any of the species (Table 3). specifics increased (Fig. 6h) and distances to heterospecifics decreased considerably, rendering a pattern of attraction with all other grazers (Fig. 6e–g). Displacements and homing behavior. Conspecifics. F. crassa. Frequency (%). S. lessoni. C. granosus. Scurria araucana. Activity rhythms Daily activity of the 4 focal species recorded in the field were remarkably similar between sites in terms of diel variation in activity as well as in the percentages of. Through discrete (changes in position between consecutive low tides) and semi-continuous (every 15 min for 3 h on 5 consecutive days) observations, we characterized patterns of displacement and distances traveled of each species (Fig. 9). Both types of measure-.
(11) Aguilera & Navarrete: Grazer distribution, activity and interspecific patterns. Fissurella crassa Resting (Day). a. e. Sij = 0.434. Foraging (Night) Sij = 0.689. C. granosus. 100 80 60 40 20. 100. b. 0. 0 0. f. Sij = –0.814. 0. Sij = 0.467. S. lessoni. 0. 0. 80. 40 20 0 100. 0. 0. c. 0. 0. 0 0. g. Sij = –0.487. 0 0. 0. Sij = 0.643. S. araucana. Frequency (%). 60. 80 60 40 20. 100. 0. 0. 0 0. 0. h. d. 80. R = 1.152. Conspecifics. 0. R = 1.530. 60 40 20 0. 0 0. 10. 20. 0 30. 40. 50. 0. 10. 129. During foraging excursions, individuals showed a predominant angle of orientation (Raleigh’s z = 11.09, 6.48 and 7.26 for Chiton granosus, Siphonaria lessoni and Scurria araucana, respectively, p < 0.001). The statistic could not be calculated for Fissurella crassa. The 0–180° axis (insets in Fig. 9a–c) corresponded to the sea–land axis on the platforms and 0 and 110° to the main direction of incoming waves. The mean displacement vectors of C. granosus, S. araucana and S. lessoni were 115.6 ± 11.3°, 123.6 ± 12.9° and 183.6 ± 15.2°, respectively, suggesting that the first 2 species oriented foraging toward incoming waves whereas S. lessoni foraged away from incoming waves (Fig. 9a,b,d insets). Contrasting patterns of homing behaviors were observed among species. Fissurella crassa exhibited a remarkably tight and persistent homing behavior over the 3 mo of observations (RHE = 0.0; Fig. 9d). Other species exhibited more moderate homing behavior, with the majority of individuals returning to their homes after foraging excursions (Chiton granosus and S. araucana; Fig. 9a,c). In the case of Siphonaria lessoni, ~48% of individuals returned to their original position after foraging whereas the rest relocated to different resting sites from day to day (Fig. 9b).. DISCUSSION 20. 30. 40. 50. Our results show that the spatial distributions of grazers varied among species, Fig. 6. Frequency distribution of nearest neighbor distances (cm) for the from aggregated for Chiton granosus and keyhole limpet Fissurella crassa at mid-intertidal levels at Las Cruces during Siphonaria lessoni to a much more disresting (a–d) and foraging (e–h). See Fig. 3 legend for details. Full species persive pattern for Fissurella crassa and names in Fig. 1 Scurria araucana (Table 4a). In most cases, individuals dispersed slightly from aggregation when ments gave similar results. We used the more extenforaging, except for S. lessoni, which tended to forage sive discrete observations based on the x–y grid to estiin conspecific aggregations. A strong positive associamate orientation angles, but as this method tended to tion was observed between C. granosus and F. crassa underestimate the extension of foraging bouts, we during resting (day) and foraging (night) whereas a used semi-continuous observations to estimate excurconsistent negative association (segregation) was obsion distances and homing behavior. Mean displaceserved between these nocturnally active species and ment distances were 60.1 ± 5.2 cm in Fissurella crassa, the diurnally active pulmonate S. lessoni (Table 4b). 54.2 ± 5.9 cm in Chiton granosus, 24.6 ± 3.7 cm in SiphOnly slight differences in spatial distribution and activonaria lessoni and only 6.5 ± 3.9 cm, with a maximum displacement of 16 cm, in Scurria araucana (Fig. 9c). In ity patterns were observed between sites. Distance of the case of F. crassa and C. granosus, ~8.0% of individforaging excursions varied widely, from over 60 cm in uals moved beyond 100 cm while foraging (Fig. 9a,d) F. crassa to less than 7 cm in S. araucana, the most seswhereas only 5.3% of S. lessoni individuals reached sile of the 4 species studied. Homing behavior also this distance (Fig. 9b). changed among grazers, from extreme fidelity in. Nearest neighbor distance (cm).
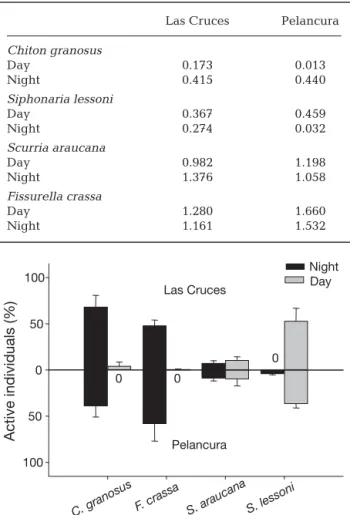
(12) 130. Mar Ecol Prog Ser 431: 119–136, 2011. Table 2. R-statistic of aggregation for conspecific nearest neighbour distances recorded at Las Cruces and Pelancura during daytime and nighttime low tides. Values close to 0 indicate an aggregated pattern whereas values close to 1 indicate a random pattern of distribution. Values close to 2.149 (the theoretical maximum) indicate an even and widely spaced distance among individuals Las Cruces. Pelancura. Chiton granosus Day Night. 0.173 0.415. 0.013 0.440. Siphonaria lessoni Day Night. 0.367 0.274. 0.459 0.032. Scurria araucana Day Night. 0.982 1.376. 1.198 1.058. Fissurella crassa Day Night. 1.280 1.161. 1.660 1.532 Night Day. 100. Active individuals (%). Las Cruces 50 0 0. 0. 0. 50 Pelancura 100. s. osu. C.. n gra. a. can. ssa. ra F. c. S. au . ar. S.. i. son. les. Fig. 7. Activity (% of individuals, mean + SE) of Chiton granosus, Fissurella crassa, Scurria araucana and Siphonaria lessoni, recorded at nighttime and during the daytime at Pelancura and Las Cruces. A total of 50 individuals of each species (100 for S. lessoni ) were marked with numbered bee tags glued to the shell and activity was recorded during December 2007 and from April 2008 to October 2008 in Las Cruces, and during November and December 2007 and through April 2008 to June 2008 in Pelancura. F. crassa to moderate fidelity in C. granosus and comparatively low fidelity in S. lessoni. Overall, our predictions, based on the assumption that interspecific competition was an important process structuring spatial and behavioral patterns in the guild, were only partially held. Thus, taken together, results suggest that interspecific interactions could be important in this guild, but that they involve some and not all species. Here we discuss whether differences in activity patterns of the small-bodied S. lessoni might result. from interference with the large F. crassa and whether spatial segregation might help reduce interference competition with chiton aggregations for the use of shelters.. Individual spatial distribution and behavioral patterns Spatial patterns of distribution have been studied using different methodologies (e.g. Chapman & Underwood 1992, Underwood & Chapman 1996, Fortin & Dale 2005), which place emphasis on different aspects and driving processes of the spatial distribution. We utilized 2 common methodologies, one based on the distribution of density (quadrat-based) and one based on distances among individuals (NN distances). In all species but Scuria araucana, significant autocorrelation values at the smallest scale (i.e. 30 × 30 cm quadrats) corresponded well with the highly clumped distribution of distances among individuals detected with the NN method. In the case of S. araucana, the quadrat method indicated spatial aggregation within the 30 cm quadrat scale, but inter-individual distances, measured at much finer scale, did not show an aggregated pattern. Similarly, we observed non-significant autocorrelation values for Fissurella crassa, which is usually indicative that the grain size used (30 × 30 cm) was not appropriate to detect the spatial structure in this species, but our results using larger (50 × 50) or smaller (15 × 15 cm) quadrats also failed to show significant spatial structure at day or night. It could also be indicative that densities are too low to correctly interpret the correlograms (Fortin & Dale 2005), or that the spatial structure is significant only at much larger spatial scales. In this case, as in the case of S. araucana, the NN method might be more informative than the quadrat method. Thus, the 2 methods operate at different scales and thereby capture different processes (see Fortin & Dale 2005), one (NN) focuses mostly on individual decisions that generate spatial associations, usually over small spatial scales, and the other on processes affecting the spatial distribution of abundance, usually over larger spatial scales. Description of spatial patterns must therefore be explored with diverse methodologies (e.g. Legendre & Fortin 1989, Legendre et al. 1997, Fortin 1999) to gain insight into the potential processes underlying natural landscapes. We observed changes in the spatial distribution of most grazers studied between resting and foraging phases (summarized in Table 4a). Chitons commonly aggregate inside crevices at day and disperse slightly when foraging at night. Dispersion during foraging may be the result of quasi-random search for food by individuals, but it may also reduce intraspecific com-.
(13) 131. Aguilera & Navarrete: Grazer distribution, activity and interspecific patterns. Field surveys a. b. Neap tides. 80. Spring tides. Night Day. 60. Active individuals (%). 40. 20. 0. Laboratory trials 80. Night Day. c. d Immersed Air exposed. 60. 40. 20 0. 0. s. osu. C.. n gra. a. can. ssa. ra F. c. au . ar. S. i. son. s . le. S. s. osu. C.. n gra. a. can. ssa. ra F. c. S. au . ar. S.. i. son. les. Fig. 8. Activity (% of individuals, mean + SE) of Chiton granosus, Fissurella crassa, Scurria araucana and Siphonaria lessoni, recorded in the field at mid-intertidal levels at Las Cruces and Pelancura (pooled data) during (a) neap and (b) spring tides, and in laboratory trials at ECIM during (c) daytime and nighttime hours and (d) immersed in water and exposed to air Table 3. 2-way ANOVA comparing activity of grazers in laboratory trials, with condition (immersed in water versus exposed to air) and species (4 species) as fixed factors Source. df. MS. F. p. Condition Species Condition × Species Residual. 1 3 3 8. 0.012 0.046 0.010 0.322. 0.31 1.15 0.27. 0.590 0.385 0.844. petition among individuals, probably reducing interference during food acquisition (Schoener 1983, Folmer et al. 2010). However, the other gregarious species, the pulmonate limpet Siphonaria lessoni, maintained an aggregated distribution when foraging during daytime hours. We observed tighter aggregations at Las Cruces than at Pelancura in S. lessoni during the active phase, which can be related to differences in density or perhaps to small-scale variation in topography between sites. However, the spatial patterns recorded still conform to an aggregated distribu-. tion at both sites. This may also account for the stronger correlation with crevice cover at Las Cruces than Pelancura, which suggests that aggregations tended to be near crevices even when animals were foraging. It is possible that in this species, unlike in chitons, there is a net benefit to foraging in tight groups (e.g. reducing predation risks; Coleman et al. 2004), but this possibility must be further evaluated experimentally. The distribution while foraging may also reflect other individual processes. Indeed, we observed S. lessoni individuals commonly engaging in crosscopulation during the activity phase (see also Hodgson 1999). Like chitons and Siphonaria lessoni, Fissurella crassa utilizes crevices when resting during the day but, contrary to the former species, their spatial distribution is dispersive, which is reinforced by their generally low density (see Oliva & Castilla 1986). During the foraging phase, the distribution of keyhole limpets tends to be more uniform, which could be related to the large foraging displacements (60.1 ± 5.2 cm) and perhaps.
(14) 132. Mar Ecol Prog Ser 431: 119–136, 2011. 0. a. 100. b. 50 40. 0. 50 40. 90. 270. 270. 80. 20 10. 60. 90. 30. 30. 20 180. 180. 10. 0. 0 0 20 40 60 80 100 120 140 160180. 0 20 40 60 80 100 120 140 160 180. Displacement (cm). Displacement (cm). 40. Frequency (%). 20 0. c. 0. d. 50. 100. 50. 40. 40 270. 30. 80. 90. 30 20. 20 10 0. 60. 10. 180. 0 0. 2. 4. 6. 0. 8 10 12 14 16. 40. 20. 40. 60. 80 100 120 140. Displacement (cm). Displacement (cm). 20 0 0. 0.2. 0.4. 0.6. 0.8. 1.0. 0. 0.2. 0.4. 0.6. 0.8. 1.0. Relative homing error Fig. 9. Frequency distribution of relative homing error (RHE) of (a) Chiton granosus, (b) Siphonaria lessoni and (c) Scurria araucana, recorded through semi-continuous sampling in Las Cruces, and (d) Fissurella crassa, recorded inside the ECIM marine reserve. Values of RHE close to 0 show perfect homing behavior whereas those close to 1.0 show dispersive excursions. For S. lessoni, pooled data of 2 separate assessments were considered for this analysis. Insets show the distribution of displacement lengths (cm) and the polar graph shows the distribution of individual orientation (not estimated for F. crassa) recorded through discrete positioning of animals during 7 consecutive days on an x–y plane at Las Cruces. Means and SD (dashed lines) of orientation angles are also shown in the polar graphs. Each individual is represented by one data point. to intraspecific interference among foraging individuals. Although the short displacements at foraging (ca. 7.0 cm) by Scurria araucana did not permit differentiation of spatial distributions between day and night, the observed interindividual segregation in this species may also be an indication of intraspecific interference, but in this case for spatial territories (see Stimson 1970, Branch 1976, 1981). Most individuals of this limpet species feed on microalgae in the neighborhood of the homing scar, in a manner which resemble ‘gardener’ limpets on the South African coasts (Branch 1981, McQuaid & Froneman 1993). However, although most grazers show some level of homing behavior (discussed below) and individual home scars are common in flat platforms for S. araucana, we did not observe aggressive encounters in the field in any of the species studied. Thus, further experiments are needed to evaluate the effect of intraspecific interference on the dis-. tribution of F. crassa and S. araucana and determine whether it sets homing strategies in these species. All species show some level of homing behavior, but individuals of Fissurella crassa had the highest fidelity to resting places (see also Serra et al. 2001). Because F. crassa individuals commonly rest solitarily, they may have individual-specific trail recognition cues (e.g. mucus trails) to ensure the return to the same home (Chelazzi et al. 1988, Davies & Hawkins 1998). In turn, gregarious grazers Chiton granosus and Siphonaria lessoni might be able to use trails from different individuals to return home after foraging excursions (Chelazzi et al. 1987). This could account for the high variability in estimates of the homing indices for these species. Unfortunately, our semi-discrete information on individual positions does not allow us to examine the use of specific trails by individuals. Differences in mechanisms used to return to fixed homes be-.
(15) Aguilera & Navarrete: Grazer distribution, activity and interspecific patterns. 133. common, whereas when competition for food is high, diurnal activity should predominate. This hypothesis assumes that nocturnal activity is the most suitable time to forage because of low desiccation or other stresses and, therefore, inferior competitors (usually those a) Intra-specific spatial and activity of smaller body size) would be forced Species Spatial pattern Activity phase D N D N to feed during the more stressful daytime hours. Thus, the diurnal activity C. granosus Aggregated Dispersed Resting Foraging of S. lessoni may be related to hisF. crassa Dispersed Dispersed Resting Foraging torical interspecific competition with S. lessoni Aggregated Aggregated Foraging Resting the nocturnal grazers C. granosus and S. auracana Dispersed Dispersed Foraging– Foraging– resting resting F. crassa, but as we hypothesize below and has been suggested before b) Interspecific spatial patterns (Carothers & Jaksic 1984), interference Species C. granosus F. crassa S. lessoni in the use of crevices (shelters against R F R F R F desiccation) or while feeding on inF. crassa + + dividual plants, instead of food exS. lessoni – – – – ploitation, might be the most relevant S. auracana 0 0 0 0 – + mechanism. Unfortunately, our laboratory experiments show that activity rhythms in these species are rather tween solitary and gregarious species deserve further fixed; therefore, it is difficult to directly test the attention. hypothesis of ‘competition past’ (sensu Connell 1980) Marked differences in day and night activity on activity patterns. Individuals of the limpet S. araucana showed more plastic diel activity. They might be rhythms were observed among species (see Table 3a). able to partition the time individuals spend foraging Chitons and Fissurella crassa have well-defined nocturnal activity, which contrasts with the diurnal activity during day and night to compensate for seasonal or of Siphonaria lessoni. In contrast, the limpet Scurria short-term changes in environmental conditions, such araucana showed activity in both diurnal and nocturas rock moisture or wave action (Gray & Hodgson 1997, Ng & Williams 2006), or in response to predation nal hours. It has been suggested that nocturnal activity is an adaptive response of intertidal grazers to avoid risks. Although this species does not display active thermal stress and/or visual (diurnal) predators escape responses in the presence of predators (Espoz & (Branch & Cherry 1985, Little 1989, Chelazzi et al. Castilla 2000), future experimental studies could 1987). Diurnal activity can expose intertidal species to examine whether individuals respond to the presence high thermal and desiccation stresses at low tides, of predators by changing diel activity rhythms. We which occur toward the sun summit (Finke et al. 2007). have shown that changes in activity patterns in this Resting in moist and shaded crevices could then signifgrazer assemblage were small or nonexistent between icantly reduce these stresses (Branch & Cherry 1985, sites separated by a few kilometers, but an interesting Williams & Morritt 1991, Harper & Williams 2001). If and unresolved issue is whether these patterns remain environmental stress is the main driver of nocturnal the same at regional or biogeographical scales, where grazers, then one should expect the diurnal pulmonate environmental and ecological scenarios change more limpet S. lessoni to be more tolerant of temperature significantly. The question is whether behavioral patand desiccation conditions than keyhole limpets and terns in this molluscan assemblage are hard-wired chitons, as has been shown in other pulmonate species responses, largely determined by ancestry (see Lind(Branch & Cherry 1985, Marshall & McQuaid 1991, berg 2007 for patellogastropods), or whether they are 1994). Perhaps the tight aggregations observed while dependent on the local environmental condition to foraging are partly a behavioral response to sustain which species could rapidly adapt. As we consider activity under harsh conditions. But these propositions below, information on the variation of grazers’ bemust be further evaluated. It has also been previously havior between communities separated by hundreds hypothesized that interspecific competition for food to thousands of kilometers could shed light on these has selected for diurnal or nocturnal activity in grazers issues. (Little 1989). According to Little (1989), when comIt is well known that distributional and behavioral petition for food is low, nighttime feeding should be strategies of grazers can have important consequences Table 4. (a) Intraspecific spatial and activity patterns during daytime (D) and nighttime (N). (b) Interspecific spatial patterns for the grazers during resting (R) and foraging (F) phases. Spatial patterns were estimated according to nearest neighbour distances and quadrat-based methods. +: positive association; –: negative association; 0: non-significant association. Species: Chiton granosus, Siphonaria lessoni, Scurria araucana and Fissurella crassa.
(16) 134. Mar Ecol Prog Ser 431: 119–136, 2011. on the spatial distribution of food resources (Chapman & Underwood 1992, Johnson et al. 2008). Distributions of molluscan grazers at the micro scale and homing can greatly account for spatial autocorrelation or patchiness in food distribution (Johnson et al. 2008). Our results on spatial patterns show that gregarious grazers during resting also tend to maintain aggregated patterns during foraging (although more loosely in Chiton granosus), which concentrates grazing activity at 30 to 45 cm around shelters. Moreover, our results on the orientation of grazers showed that C. granosus and Siphonaria lessoni revisited the same algal patches in successive foraging bouts, which could further reinforce a highly patchy distribution of grazing intensity (M. A. Aguilera & S. A. Navarrete unpubl. data). The sedentary behavior and dispersed distribution of S. araucana guarantees a spatially patchy grazing by this limpet, but their real effects on maintaining homing scars must still be experimentally demonstrated. In contrast, grazing impact by F. crassa must be more spatially extended and more uniform over space. Thus, despite their relatively similar food diets (Santelices et al. 1986, Camus et al. 2008), the impacts of these species on the algal assemblage and therefore their functional roles (Schmitz 2008) might still be quite different.. Spatial and temporal interspecific association The observed segregated spatial association during resting and foraging between the gregarious species Siphonaria lessoni and Chiton granosus (summarized in Table 4b) is only partly in line with our predictions. Chitons and S. lessoni have different diel foraging activities and also they commonly aggregate in different crevices during resting in the mid to high intertidal zones, which could be a direct consequence of interference through aggressive behavior (not seen) or crowding effects inside crevices as animals leave or enter the shelters, as seen among other gregarious species (Branch 1976). Thus, segregation in activity does not seem sufficient to reduce and completely eliminate spatial segregation (see Carothers & Jaksic 1984). Differences in body size (chitons are larger than S. lessoni) might produce asymmetry in this interaction (i.e. strong differences in the magnitude of effects between the species), but our data cannot resolve this issue. It is interesting that S. lessoni tends to forage during the day at a distance ~30 cm further from its own resting sites, which also accounts for positive spatial association with crevices during this phase, and ~45 cm from aggregations of resting chitons, which could be related to food shortage in areas adjacent to chiton crevices (Aguilera & Navarrete 2007) and there-. fore the possibility of exploitative competition for food between these species occurring at very small spatial scales. Segregation during both resting and foraging between S. lessoni and solitary F. crassa was also apparent. The small body size of S. lessoni compared with F. crassa might determine strong asymmetry in encounters when acquiring food, or during the brief times when individuals overlap during initiation and termination of foraging. Indeed, a study in southern Chile has suggested the existence of strong interspecific competition between S. lessoni and another large keyhole limpet, Fissurella picta (Godoy & Moreno 1989), and direct interference might be one of the mechanisms. Again, these spatial patterns and observations reinforce the idea that diurnal activity in S. lessoni could be an evolutionary response to reduce encounters with larger nocturnal foragers. In this context, it is interesting to note that the same species has been reported as having nocturnal activity in the Atlantic Patagonia, where large grazers and, therefore, potential competitors are virtually absent (see Olivier & Penchaszadeh 1968, López-Gappa et al. 1996). Further observations over biogeographic scales, together with carefully designed transplant experiments, could shed light into the potential for competition to set patterns of diel activity. We observed positive spatial association between chitons and F. crassa during both resting and foraging (see Table 4b). Contrary to our predictions, these species utilize the same microhabitats during resting (i.e. crevices) and also forage at the same time (see Table 4a). This suggests that competition (e.g. interference) between these species is less intense than among conspecific individuals. Taken together, our results suggest that interference competition driven by shelter use and modulated by differences in body size may determine the spatial and temporal organization of some of the grazers in the guild. This interaction may also translate into changes in the distribution of the algae consumed by these species. Further experiments should thus examine grazer effects under different contexts of interspecific coexistence. Although detailed manipulative experiments are needed to elucidate whether activity and spatial distributional patterns are modified by competitive interactions, our study provides information regarding the most likely and important type of interactions in this grazer guild, interference competition, and the species that might be most affected. Similarly, results demonstrate that, despite high diet overlap (see Santelices et al. 1986), there are sharp and sometimes conspicuous interspecific differences in spatial distribution, mobility and foraging behavior, which could very likely translate into important differences in the functional roles played by each grazer species in algal assemblages and the entire community. This information.
(17) Aguilera & Navarrete: Grazer distribution, activity and interspecific patterns. 135. (eds) Behavioural adaptation to intertidal life. Plenum sheds light on the roles played by individual behavior Press, New York, NY, p 173–184 and competitive interactions in shaping functional Clark PJ, Evans FC (1954) Distance to nearest neighbor as a ➤ structure in the molluscan grazer assemblage (see measure of spatial relationships in populations. Ecology Branch 1981), both at ecological and evolutionary 35:445–453 scales. ➤ Coleman RA, Browne M, Theobalds T (2004) Aggregation as Acknowledgements. We greatly appreciate comments by B. Broitman (CEAZA-UCN), M. Thiel and E. Wieters on an earlier version of the manuscript. This paper is in partial fulfillment of the PhD degree of M.A.A. and was made possible thanks to a scholarship by Comisión Nacional de Ciencia y Tecnología (CONICYT). Support from the Andrew Mellon Foundation to M.A.A. is also greatly appreciated. We thank ‘ECIMinianos’ and ‘Chango-LAB’ for camaraderie and friendship. Financial support for these studies was provided by Fondecyt Grant no. 1070335 and Fondap Fondecyt 15001-001 to S.A.N. LITERATURE CITED. ➤. ➤. ➤. ➤ ➤. ➤. ➤. ➤. Aguilera M (2005) Cirripedios en la dieta del molusco herbívoro Chiton granosus Frembly (1827) (Mollusca:Placophora) presente en el intermareal rocoso de Iquique, Norte de Chile. Invest Mar 33:109–113 Aguilera A, Navarrete S (2007) Effects of Chiton granosus (Frembly, 1827) and other molluscan grazers on algal succession in wave exposed mid-intertidal rocky shores of central Chile. J Exp Mar Biol Ecol 349:84–98 Batschelet E (1981) Circular statistics in biology. Academic Press, London Branch GM (1976) Interspecific competition experienced by South African Patella species. J Anim Ecol 45:507–529 Branch GM (1981) The biology of limpets: physical factors, energy flow and ecological interactions. Oceanogr Mar Biol Annu Rev 19:235–380 Branch GM, Cherry MI (1985) Activity rhythms of the pulmonate limpet Siphonaria capensis Q. and G. as an adaptation to osmotic stress, predation and wave action. J Exp Mar Biol Ecol 87:153–168 Broitman BR, Navarrete SA, Smith F, Gaines SD (2001) Geographic variation of southeastern Pacific intertidal communities. Mar Ecol Prog Ser 224:21–34 Camus PA, Daroch K, Opazo FL (2008) Potential for omnivory and apparent intraguild predation in rocky intertidal herbivore assemblages from northern Chile. Mar Ecol Prog Ser 361:35–45 Carothers JH, Jaksic FM (1984) Time as niche difference: the role of interference competition. Oikos 42:403–406 Castilla JC (1981) Perspectivas de investigación en estructura y dinámica de comunidades intermareales rocosas de Chile Central. II. Depredadores de alto nivel trófico. Medio Ambiente 5:190–215 Chapman MG (2000) Poor design of behavioural experiments gets poor results: examples from intertidal habitats. J Exp Mar Biol Ecol 250:77–95 Chapman M, Underwood A (1992) Foraging behaviour of marine benthic grazers. In: John DM, Hawkins SJ, Price JH (eds) Plant –animal interactions in the marine benthos. Clarendon Press, Oxford, p 289–317 Chelazzi G, Della Santina P, Parpagnoli D (1987) The trail following in the chiton Acanthopleura gemmata: operational and ecological problems. Mar Biol 95:539–545 Chelazzi G, Focardi S, Deneubourg JL (1988) Analysis of movement pattern and orientation mechanism in intertidal chitons and gastropods. In: Chelazzi G, Vannini G. ➤ ➤ ➤ ➤ ➤ ➤. ➤ ➤ ➤. ➤ ➤ ➤. ➤ ➤. ➤. a defense: limpet tenacity changes in response to simulated predator attack. Ecology 85:1153–1159 Coleman RA, Underwood AJ, Benedetti-Cecchi L, Aberg P and others (2006) A continental scale evaluation of the role of limpet grazing on rocky shores. Oecologia 147:556–564 Connell JH (1980) Diversity and the coevolution of competitors, or the ghost of competition past. Oikos 35:131–138 Cox TF (1981) Reflexive nearest neighbours. Biometrics 37:367–369 Davies MS, Hawkins SJ (1998) Mucus from marine molluscs. Adv Mar Biol 34:1–71 Dixon P (1994) Testing spatial segregation using a nearest neighbor contingency table. Ecology 75:1940–1948 Erlandsson J, McQuaid C, Kostylev V (2005) Contrasting spatial heterogeneity of sessile organisms within mussel (Perna perna) beds in relation to topographic variability. J Exp Mar Biol Ecol 314:79–97 Espoz C, Castilla JC (2000) Escape responses of four Chilean intertidal limpets to seastars. Mar Biol 137:887–892 Espoz C, Lindberg DR, Castilla JC, Simison BW (2004) Los patelogastrópodos intermareales de Chile y Perú. Rev Chil Hist Nat 77:257–283 Fernández M, Jaramillo E, Marquet P, Moreno C and others (2000) Diversity, ecology and biogeography of Chilean benthic nearshore ecosystems: an overview and needs for conservation. Rev Chil Hist Nat 73:629–662 Finke GR, Navarrete SA, Bozinovic F (2007) Tidal regimes of temperate coasts and their influences on aerial exposure for intertidal organisms. Mar Ecol Prog Ser 343:57–62 Fletcher WJ, Underwood AJ (1987) Interspecific competition among subtidal limpets: effect of substratum heterogeneity. Ecology 68:387–400 Focardi S, Chelazzi G (1990) Ecological determinants of bioeconomics in three intertidal chitons (Acanthopleura spp). J Anim Ecol 59:347–362 Folmer EO, Olff H, Piersma T (2010) How well do food distributions predict spatial distributions of shorebirds with different degrees of self-organization? J Anim Ecol 79:747–756 Fortin MJ (1999) Effects of sampling unit resolution on the estimation of spatial autocorrelation. Ecoscience 6: 636–641 Fortin MJ, Dale M (2005) Spatial analysis: a guide for ecologists. Cambridge University Press, Cambridge Godoy C, Moreno C (1989) Indirect effects of human exclusion from the rocky intertidal in southern Chile: a case of cross-linkage between herbivores. Oikos 54:101–106 Gray D, Hodgson AN (1997) Temporal variation in foraging behaviour of Patella granularis (Patellogastropoda) and Siphonaria concinna (Basommatophora) on a South African shore. J Molluscan Stud 63:121–130 Harper KD, Williams G (2001) Variation in abundance and distribution of the chiton Achantopleura japonica and associated molluscs on a seasonal tropical, rocky shore. J Zool 253:293–300 Hawkins SJ, Hartnoll RG (1983) Grazing of intertidal algae by marine invertebrates. Oceanogr Mar Biol Annu Rev 21: 195–282 Hodgson AN (1999) The biology of siphonariid limpets (Gastropoda: Pulmonata). Oceanogr Mar Biol Annu Rev 37: 245–288.
Figure


+7


Documento similar
Consequently, OMVs may enhance copper toxicity in bacterial interactions by concentrating the metal and ensure more focused transport and intervention of the metal during
Since such powers frequently exist outside the institutional framework, and/or exercise their influence through channels exempt (or simply out of reach) from any political
In a survey of 1,833 business management undergraduates in six Ibero-American countries, factor analysis identified three approaches to stakeholder relations, behaviors, and
The objective of this study was to describe the relationships between mean daytime and nighttime ambulatory BP, BP variability, and nocturnal decline in BP with subjects
To put Theorem 2.1 into perspective, recall that there exist analogous structure results for cohomogeneity one actions on closed smooth manifolds, on closed topological manifolds and
Representation of the positive relationship among fruit abundance and frugivore activity (resource tracking) at local and landscape spatial scales, showing also the concordance
The thesis consists of three main parts, in which we have studied activity dynamics in the fruit fly Drosophila melanogaster, sleep-wake dynamics in the zebrafish Danio rerio and
Since, at a behavioral lev- el, mice with triplication of this gene present increases in spontaneous locomotive activity and changes in spatial learning; at
