Clean development mechanism : profitability drivers and sustainable development profiles
116
0
0
Texto completo
(2) PONTIFICIA UNIVERSIDAD CATOLICA DE CHILE ESCUELA DE INGENIERIA. CLEAN DEVELOPMENT MECHANISM: PROFITABILITY DRIVERS AND SUSTAINABLE DEVELOPMENT PROFILES. CONSTANZA PAZ ALBORNOZ PAVEZ. Members of the Committee: DAVID WATTS CASIMIS HUGH RUDNICK VAN DE WYNGARD YARELA FLORES ARÉVALO JOSÉ LUIS ALMAZÁN CAMPILLAY. Thesis submitted to the Office of Research and Graduate Studies in partial fulfillment of the requirements for the Degree of Master of Science in Engineering. Santiago de Chile, 2014.
(3) A mi familia y amigos por todo su apoyo.
(4) AGRADECIMIENTOS En el presente trabajo es un esfuerzo en el que directa o indirectamente participaron varias personas, aconsejándome, leyendo mi trabajo, corrigiéndolo, teniéndome paciencia en los período de crisis y acompañándome en los de felicidad. En primer lugar quiero agradecer al Profesor David Watts por haber confiado en mí y haberme permitido trabajar bajo su dirección. En particular agradezco el constante apoyo, la dedicación y todas las correcciones que me brindó a lo largo de todo este proceso para mejorar mi trabajo. Realmente creo que no podría haber tenido un mejor guía. Agradezco a mi mamá por el constante apoyo y por haberme ayudado a formarme como persona y como estudiante. Sin toda tu ayuda jamás habría logrado llegar a donde estoy. Agradezco a mi papá y a Koky por toda la preocupación a pesar de la distancia y por siempre estar pendientes de cómo avanzaba mi trabajo. Gracias también a mis amigos que me apoyaron y escucharon durante momentos de frustración y que se alegraron también con cada uno de mis avances. Por último agradezco también a todos aquellos que de alguna u otra manera hicieron esto más fácil y que constantemente me animaron a seguir adelante. A todos ustedes mi más sincero agradecimiento.. i.
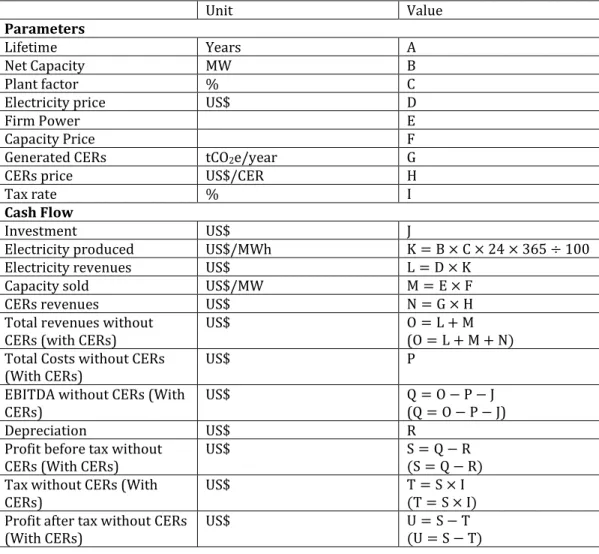
(5) GENERAL INDEX Page AGRADECIMIENTOS ..................................................................................................... i GENERAL INDEX ........................................................................................................... ii INDEX OF TABLES ....................................................................................................... iv INDEX OF FIGURES ..................................................................................................... vi RESUMEN....................................................................................................................... ix ABSTRACT ..................................................................................................................... xi IMPORTANT TERMINOLOGY .................................................................................. xiii 1 Introduction OF THE RESEARCH ............................................................................. xv 1.1 Motivation: Climate Change and the Kyoto Protocol ........................................... xv 1.2 Literature Review and the Contribution of this Research ................................... xvii 1.3 Hypothesis ....................................................................................................... xxii 1.4 Methodology for the Study ................................................................................ xxiii 1.4.1 Methodology for the Study of Profitability Drivers (Article 1) .................. xxiii 1.4.2 For the Study of Sustainable Development (Article 2) ............................... xxiv 1.5 Main Results, General Conclusions and Recommendations............................... xxv 2 Profitability drivers for Clean Development Mechanism (CDM) renewable energy projects in Latin America and a case study in Chile ......................................................... 1 Abstract ......................................................................................................................... 1 2.1 Introduction ........................................................................................................... 2 2.2 Background on investment additionality for renewable energy ............................. 6 2.2.1 Previous Studies on investment additionality .................................................. 6 2.2.2 Different criteria to define investment additionality ........................................ 8 2.2.3 Investment additionality for renewable energy projects .................................. 9 2.3 Valuation of renewable energy CDM projects in Latin America ......................... 10 2.3.1 Sample for the study....................................................................................... 10 2.3.2 Methodology .................................................................................................. 11 2.3.3 Cash flow model ............................................................................................ 12 2.4 Results and Discussions ........................................................................................ 13. ii.
(6) 2.4.1 Previous to the cash flow evaluation .............................................................. 13 2.4.2 Projects in the study: hydro, wind and biomass ............................................. 17 2.4.3 Analysis of IRR benchmark and influence of CERs revenues ...................... 19 2.4.4 Sensitivity analysis and key drivers of profitability for Latin America ......... 23 2.4.5 Inclusion of a residual value in the cash flow ................................................ 26 2.4.6 Case study: Renewable energy performance in Chile.................................... 29 2.5 Recommendations and Conclusions ..................................................................... 37 3 Sustainable Development Profiles through CDM Renewable Energy projects in Latin America ............................................................................................................. 41 Abstract ....................................................................................................................... 41 3.1 Introduction ......................................................................................................... 42 3.2 Overview of the CDM portfolio............................................................................ 44 3.2.1 CDM: Distribution of projects and its challenges .......................................... 45 3.2.2 CDM: Trade-off in favor of cost effective emission reductions leaving behind sustainable development ......................................................................................... 48 3.3 Analysis of sustainable development benefits due to renewable energy projects 49 3.3.1 Previously used methodologies for sustainability assessment ....................... 49 3.3.2 Methodology used for the analysis ................................................................ 50 3.3.3 Criteria for evaluating sustainable development benefits in projects’ PDDs 54 3.4 Findings of the sustainability evaluation for renewable energy projects in Latin America: In spite of renewable energy’s good performance, technology transfer is left behind ......................................................................................................... 56 3.4.1 Sustainable development benefits of all CDM projects in the region ............ 56 3.4.2 Sustainable development benefits by host country ........................................ 59 3.4.3 Sustainable development benefits by project size.......................................... 65 3.4.4 Sustainable development benefits by type of project ..................................... 67 3.4.5 Trends in sustainable development during the first commitment period ....... 68 3.4.6 Summary and discussion of findings ............................................................. 71 3.5 Policy implications for CDM to promote sustainable development ..................... 73 3.6 Conclusions ......................................................................................................... 76 4 References. ............................................................................................................. 78. iii.
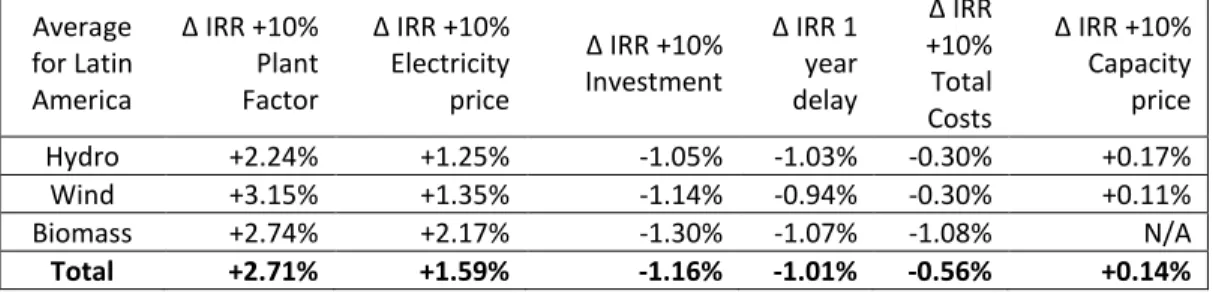
(7) INDEX OF TABLES Page Table 2.1 : Cash-Flow Model.......................................................................................... 12 Table 2.2 : IRR Benchmark for hydro, wind and biomass projects in Latin America .... 14 Table 2.3 : Trends of CERs’ volume, value and price from 2005-2011 ......................... 17 Table 2.4 : Description of projects’ parameters and differences between original and calculated IRR.......................................................................................................... 18 Table 2.5 : Description of average registered capacity, average investment cost and average plant factor by country ............................................................................... 19 Table 2.6 : Key drivers of profitability for Latin America (all projects in the sample) .. 24 Table 2.7 : Projects in the sample including a residual value ......................................... 28 Table 2.8 : Main parameters used on hydro cash flows replicas for Chile ..................... 32 Table 2.9 : Main parameters used on wind cash flows replicas for Chile ...................... 32 Table 2.10: Cash flow model for hydro projects ............................................................ 33 Table 2.11: Cash flow model for wind projects .............................................................. 35 Table 3.1: Nº of Projects, Capacity and Issued CERs by region. Source: Author’s calculations based on projects’ information from UNEP Risϕe and UNFCCC. .... 46 Table 3.2: Nº of Projects, Capacity and Issued CERs by region and type of technology48 Table 3.3: Sample of renewable energy projects used for the study. Source: Author’s calculations based on projects’ information from UNEP Risϕe and UNFCCC. .... 53 Table 3.4: Scope of work for categories and sub-categories of benefits. Source: Own elaboration from information taken from Ellis et al., 2007; Olsen and Fenhann, 2008; Nussbaumer, 2009. ........................................................................................ 54 Table 3.5: Sustainable development benefits for all projects as a percentage of the number of projects and the annual emission reductions. Source: Author’s calculations based on projects’ information from UNEP Risϕe and UNFCCC. .... 57. iv.
(8) Table 3.6: Average number of sustainable development benefits according to type of technology. Source: Author’s calculations based on projects’ information from UNEP Risϕe and UNFCCC. ................................................................................... 68. v.
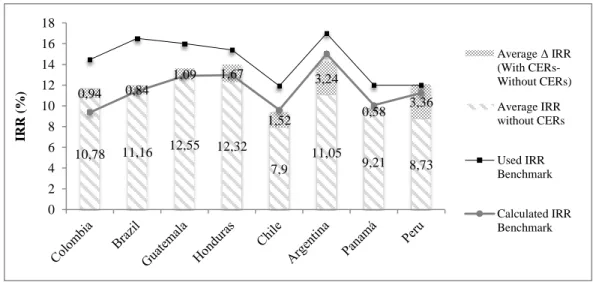
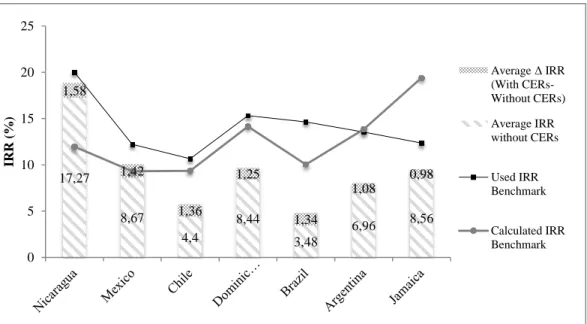
(9) INDEX OF FIGURES Page Fig. 2.1: Average Δ IRR (With CERs – Without CERs), used IRR benchmark and calculated IRR benchmark by country for hydro projects ....................................... 21 Fig. 2.2: Average Δ IRR (With CERs – Without CERs), used IRR benchmark and calculated IRR benchmark by country for wind projects ........................................ 22 Fig. 2.3: Average Δ IRR (With CERs – Without CERs), used IRR benchmark and calculated IRR benchmark by country for biomass projects ................................... 22 Fig. 2.4 : Key drivers of profitability based on impact on IRR of sensitivity analysis for large and small-scale hydro projects ........................................................................ 25 Fig. 2.5 : Key drivers of profitability based on impact on IRR of sensitivity analysis for large and small-scale wind projects ......................................................................... 25 Fig. 2.6 : Key drivers of profitability based on impact on IRR of sensitivity analysis for large and small-scale biomass projects .................................................................... 26 Fig. 2.7 : Plant Factor vs. Investment IRR curves for hydro projects ............................. 34 Fig. 2.8 : Electricity Price vs. Investment IRR curves for hydro projects ...................... 34 Fig. 2.9: Plant Factor vs. Investment IRR curves for wind projects ............................... 35 Fig. 2.10: Electricity Price vs. Investment IRR curves for wind projects ....................... 36 Fig. 2.11: Change of Assumptions: from Monte Redondo Wind Farm to Totoral Wind Farm ......................................................................................................................... 37 Fig. 3.1: Issued kCERs from Latin America’s top 6 countries. Source: Author’s calculations based on projects’ information from UNEP Risϕe and UNFCCC. .... 53 Fig. 3.2: Categories and sub-categories for the classification of sustainable development benefits. Source: Own elaboration from information taken from Ellis et al., 2007; Olsen and Fenhann, 2008; Nussbaumer, 2009. ....................................................... 54 Fig. 3.3: Sustainable development profile for major categories of benefits for all CDM renewable energy projects in Latin America in the sample as percentage of number. vi.
(10) of projects. Source: Author’s calculations based on projects’ information from UNEP Risϕe and UNFCCC. ................................................................................... 57 Fig. 3.4: Sustainable development profile for sub-categories of benefits for all CDM renewable energy projects in Latin America in the sample as percentage of number of projects. Source: Author’s calculations based on projects’ information from UNEP Risϕe and UNFCCC. ................................................................................... 58 Fig. 3.5: Sustainable development profile for sub-categories of benefits for all CDM renewable energy projects in Latin America in the sample as percentage of annual emissions reductions. Source: Author’s calculations based on projects’ information from UNEP Risϕe and UNFCCC. .......................................................................... 58 Fig. 3.6: Sustainable development profile for environmental benefits as percentage of number of projects according to host country. Source: Author’s calculations based on projects’ information from UNEP Risϕe and UNFCCC.................................... 63 Fig. 3.7: Sustainable development profile for economic benefits as percentage of number of projects according to host country. Source: Author’s calculations based on projects’ information from UNEP Risϕe and UNFCCC.................................... 63 Fig. 3.8: Sustainable development profile for social benefits as percentage of number of projects according to host country. Source: Author’s calculations based on projects’ information from UNEP Risϕe and UNFCCC........................................................ 64 Fig. 3.9: Sustainable development profile for technology transfer as percentage of number of projects according to host country. Source: Author’s calculations based on projects’ information from UNEP Risϕe and UNFCCC.................................... 64 Fig. 3.10: Sustainable development profile for sub-categories of benefits as percentage of number of projects according to top CDM host countries in Latin America. Source: Author’s calculations based on projects’ information from UNEP Risϕe and UNFCCC. .......................................................................................................... 65 Fig. 3.11: Sustainable development profile for sub-categories of benefits in Latin America as percentage of number of projects, according to size of project. Source: Author’s calculations based on projects’ information from UNEP Risϕe and UNFCCC. ................................................................................................................ 66 Fig. 3.12: Sustainable development profile for sub-categories of benefits in Latin America as percentage of number of projects, according to type of technology.. vii.
(11) Source: Author’s calculations based on projects’ information from UNEP Risϕe and UNFCCC. .......................................................................................................... 68 Fig. 3.13: Evolution over time of environmental benefits on renewable energy registered projects. . Source: Author’s calculations based on projects’ information from UNEP Risϕe and UNFCCC. ............................................................................................... 69 Fig. 3.14: Evolution over time of economic benefits on renewable energy registered projects. Source: Author’s calculations based on projects’ information from UNEP Risϕe and UNFCCC. ............................................................................................... 70 Fig. 3.15: Evolution over time of social benefits on renewable energy registered projects. Source: Author’s calculations based on projects’ information from UNEP Risϕe and UNFCCC. ............................................................................................... 70 Fig. 3.16: Evolution over time of technology transfer on renewable energy registered projects. Source: Author’s calculations based on projects’ information from UNEP Risϕe and UNFCCC. ............................................................................................... 71. viii.
(12) RESUMEN El mecanismo de desarrollo limpio (MDL) es el único mecanismo de mercado bajo el Protocolo de Kyoto destinado a ayudar a los países en desarrollo a crecer siguiendo un camino más limpio. Los proyectos de energía renovable presentan el mayor potencial dentro del MDL para contribuir al desarrollo sostenible de los países. Sin embargo, ofrecen un menor número de créditos de carbono que otras alternativas de proyectos y presentan mayores riesgos. Hasta el momento, los incentivos del MDL han promovido proyectos que entregan mayores dividendos, dejando las energías renovables y el desarrollo sostenible atrás, exponiendo la necesidad de entender los proyectos de energías renovables y aquellos factores que afectan la rentabilidad para reducir los riesgos y aumentar su rentabilidad. En esta investigación se analizan proyectos de energía renovable de Latinoamérica. Primero se estudian factores de rentabilidad mediante la réplica de 44 flujos de caja y también las diferencias existentes en supuestos usados en proyectos con características similares en Chile. Luego se estudian beneficios de desarrollo sostenible en una muestra de 180 proyectos de energía renovable. Para la muestra el factor de planta es clave para la rentabilidad, seguido del precio de la electricidad, del costo de la inversión y de un retraso de un año. Los resultados también sugieren que los desarrolladores de proyectos eligen los parámetros que más les convengan para que sus proyectos puedan ser registrados en el MDL. Para el desarrollo sostenible, si bien no existen tendencias entre el país anfitrión, la escala o el tipo de proyecto con la sostenibilidad, todos los proyectos evaluados claman entregar al menos un tipo de beneficio. Sin embargo, la transferencia de tecnología, que ayuda a los países a desarrollar sus propias capacidades, se queda atrás. El estudio propone que el MDL sea reestructurado para promover las energías renovables y el establecimiento de criterios universales para la evaluación de la adicionalidad de inversión. Así se evitaría la manipulación de datos que busca aumentar los ingresos por MDL. Una de las medidas propuestas es el uso de una lista de categorías de beneficios como un estándar internacional en el MDL para ayudar a los ix.
(13) países más pobres en el desarrollo de capacidades institucionales y a que puedan adaptarse al cambio climático. Palabras Clave: CDM; Energías Renovables; Adicionalidad de Inversión; Factores de rentabilidad; Desarrollo Sostenible; América Latina; Chile. x.
(14) ABSTRACT The clean development mechanism (CDM) is the only market-based mechanism under the Kyoto Protocol aimed to help developing countries grow following a cleaner path. Renewable energy projects present the highest potential within the CDM to contribute to countries’ sustainable development. However, they deliver fewer carbon credits than other project alternatives and present higher risks. So far, the CDM’s incentives have promoted projects delivering higher dividends, leaving renewable energies and sustainable development behind, thereby exposing the need to understand renewable energy projects and their profitability drivers better to reduce their risks and increase their profitability In this research first the profitability drivers associated with CDM renewable energy projects in Latin America are studied by replicating 44 cash flows. The different assumptions taken by project developers for projects with similar characteristics in Chile are also studied, aiming to expose that no methodologies are used to choose parameters for evaluating projects. Then sustainable development benefits are studied for a sample of 180 renewable energy CDM projects from Latin America. Since these types of projects are associated with the highest sustainability benefits, their analysis aims to portray the best possible scenario for the contribution of CDM towards sustainable development. The results show that for the sample the plant factor is the key driver for profitability, followed by electricity price, investment cost and a one-year delay. It also suggests that project developers may choose the parameters that most accommodate them so that their projects can be registered under the CDM. For sustainable development while no trends exist between host country, scale or type of project with sustainability, all of the evaluated projects claim to deliver at least one type of benefit. Nonetheless, technology transfer, which helps countries to build their own capacities, is left behind. The study proposes the CDM to be restructured to promote renewable energies and to establish universal criteria for the investment additionality assessment, avoiding data manipulation solely with the goal of increasing CDM revenues. One of xi.
(15) the measures proposed is to use of a checklist of categories and subcategories of benefits as an international standard in CDM to aid the poorest countries in the development of institutional capacities in order to help them adapt to climate change. Keywords: CDM; Renewable Energy; Investment Additionality; Profitability drivers; Sustainable Development; Latin America; Chile. xii.
(16) IMPORTANT TERMINOLOGY. CDM: Clean Development Mechanism. It allows developed countries with emission reduction targets to implement a CDM project in developing countries (not obligated to reduce emissions). These projects can earn CERs (Certified Emission Reductions), each equivalent to one tonne of CO2, which can be counted towards meeting Kyoto targets. PDD: Project Design Document. Contains all the information about the project, including additionality test, barrier analysis, common practice analysis and sustainable development claims. Additionality Test: The project developer needs to prove that his project is additional, meaning that it is not the business as usual case and that the reductions are additional to what would otherwise have occurred, in order to be registered into the CDM. It usually includes an investment, barrier and common practice analysis, as well as stated sustainable development contributions. Investment Analysis: The project developer needs to prove that the project either faces more costs than an alternative or is less profitable than a reference case or a benchmark. Barrier Analysis: The project developer needs to prove that the project faces more barriers than a reference case or that the CDM allows the project to overcome certain barriers. Common Practice Analysis: The project developer needs to prove that the project is not the common practice, meaning that if other similar projects are already operating, they should either face a very different economic situation or they should also be receiving incomes from the CDM. CER: Certified Emission Reduction. Corresponds to an approved metric tonne of CO2e reduced, attained by investing on projects in non-Annex I countries.. xiii.
(17) GHG: Greenhouse gases. The main GHG gases considered in the Kyoto Protocol are carbon dioxide, methane, nitrous oxide, hydroflurorocarbons, perfluorocarbons and sulphur hexafluoride.. xiv.
(18) 1 INTRODUCTION OF THE RESEARCH This section provides an overview of the total work presented on the thesis in the form of two separate papers, which are meant to be read and understood on their own, each one presenting the context of the study, introduction, development and conclusions. The motivation for the research, literature review and methodology for the study, along with the main results and general conclusions are provided. 1.1. Motivation: Climate Change and the Kyoto Protocol Anthropogenic climate change, primarily due to the increase in greenhouse. gases (GHGs) in the atmosphere, is a phenomenon capable of affecting both human life and the planet’s ecology. Even though industrialized countries are responsible for the majority of the historic and current stock of GHGs, developing countries growth in emissions have been significant, even considering that their per capita emission levels continue to be lower than developed countries. As a result of this new scenario, climate mitigation became a global issue (Bailis, 2006; Dagoumas et al., 2006; Schneider et al., 2010; Winkelman and Moore, 2010). Reducing GHG emissions globally is critical to limit the impacts of global warming (Arent et al., 2011), that is why the United Nations Framework Convention on Climate Change (UNFCCC, n.d.) was established as an agreement to address the problem of climate change, taken on the United Nations Conference on Environmental and Development (UNCED) in Rio, Brazil in 1992 (Nautiyal and Varun, 2012). Its main aim is to stabilize atmospheric concentrations of GHGs, while assuring food, security, adaptation of ecosystems to climate change and sustainable development (Ellis et al., 2007). The Kyoto Protocol is born in 1997 as a response to the UNFCCC’s ambition to reverse the increase in GHGs emissions. Its main achievement, beyond creating social awareness, is to create legally binding obligations for industrialized countries (referred as Annex I countries) to reduce their emissions of GHGs to an average of 5% below their 1990 levels over the first commitment period from 2008 to. xv.
(19) 2012 (UNFCCC, 1997). The developed countries accepted the responsibility of leading the climate change mitigation efforts since their per capita emission levels were more than ten times greater than those of developing countries (Grubb et al., 1999; Banuri and Gupta, 2000; Baranzini et al., 2000; Grubb, 2003). The Clean Development Mechanism (CDM) is one of the three flexible mechanisms set under the Kyoto Protocol (UNFCCC, 1997). It has two objectives, to lower the compliance costs of developed countries to help them reach their targets and to incorporate developing countries in the mitigation of climate change by providing them with sustainable development so they can grow following a cleaner path. CDM lets developed countries receive credits for certified emission reductions (CERs), corresponding to an approved metric tonne of CO2e reduced, attained by investing on projects in developing countries and is the main effort to include developing countries into the global emissions market by hosting projects (Hamwey and Baranzini, 1999; Dutschke and Michaelowa, 1998; Begg, 2002; Dagoumas et al., 2006; Boyd et al., 2009; Grub et al., 2010). While CDM has contributed to tackle climate change and offers developing countries an opportunity to participate in the global carbon market by hosting projects, it is considered widely imperfect (Boyd et al., 2009). The main critics surrounding CDM have to do with its high transaction costs (Michaelowa and Jotzo, 2005; Chadwick, 2006), with promoting CDM projects with higher dividends whilst neglecting the pursue of sustainable development (trade-off between CDM’s two objectives), with the difficulty of testing a project’s additionality1 and with the fact that CDM projects are unequally distributed across developing countries (Sutter and Parreño, 2007; Nussbaumer, 2009; Schneider et al., 2010).. 1. Additionality is one of the eligibility criteria for CDM projects, meaning that emission reductions. from a CDM project should be “additional to any that would occur in the absence of such activities” (UNFCCC, 1997).. xvi.
(20) This research studies renewable energy projects in the CDM, which have the greatest potential to help decarbonize the energy sector (Schneider et al., 2010) and also create more independence from fossil fuels (Weiss et al., 2008). Renewable energy is the technology most likely to contribute to sustainable development (Ellis et al., 2007; Sutter and Parreño, 2007; Nussbaumer, 2009), however as it is very capital intensive it requires host countries to support and promote it (Xingang et al., 2011). This reveals the need to study the profitability drivers associated to these types of projects, such as investment costs, plant factor, delays and electricity prices, among others, in order to discover the most important ones and to be able to lower the uncertainties associated with renewable energy. Hence, the first article presents a financial analysis, studying the drivers associated to profitability through the replication of 44 cash flows taken from the 180project-sample from Latin America. A case study on Chile is done aiming to expose the difference in assumptions taken by project developers in similar projects, such as types of benchmarks considered, electricity prices and costs, among others. The second article focuses on the sustainable development benefits claimed by each of the projects of the sample, aiming to portray the best possible situation for the contribution of CDM towards sustainable development in the region with the most homogeneous distribution of projects. Sustainable development profiles are provided according to countries, size of projects and types of technology (hydro, wind or biomass). A study on the trends regarding the four main types of benefits: economic, environmental, social and technology transfer is also performed.. 1.2. Literature Review and the Contribution of this Research The main literature for this study has to do with the areas of sustainable. development and economic issues in the CDM. In the context of the first article for the study of profitability drivers among renewable energy projects, there are four main streams of literature in this regard. A xvii.
(21) first one studies investment additionality as a general term (Shrestha and Timilsina, 2002; Greiner and Michaelowa, 2003; Philibert, 1998; Au Yong, 2009), debating on which option (barriers, IRR, NPV, ΔIRR, payback period, etc.) is the best to prove a project’s additionality and most of them agreeing that the IRR benchmark makes the less prone to manipulation alternative. A second stream analyzes the investment additionality related to renewable energies (Schneider et al., 2010; Masini and Menichetti, 2013; Monjas-Barroso, Balibrea-Iniesta, 2013). However none of them focus on a particular region or study the profitability drivers for all of the first commitment period (2008-2012), as it is evaluated in this paper. A third stream focuses on techno-economic performance of determined projects in a particular area (Weiss et al., 2008; Xingang et al., 2011; Yunna and Quanzhi, 2011; Purohit, 2008; Bergqvist et al., 2008; Yang, 2010), emphasizing the need to promote renewable energies to contribute towards sustainable development and to help to reduce the energy crisis by expanding the energy matrix in a clean manner. The final stream studies risk, pricing and how to promote the CDM (Lee et al., 2013; Cormier and Bellassen, 2012; Tang et al., 2012; Bode and Michaelowa, 2003), but most of the evaluation are in regard to CDM specific risks, like high transaction costs and delays in registering the project, but not considering risks associated to the lucrativeness of a project. Previous studies on economic issues of the CDM have taken their field of research as investment additionality, and in particular about the impact of additionality whether in a certain project or in a type of technology, like renewable energies. However, despite the similar scope of work, in order to compare the financial performance of a project, a range of indicators exist, where the NPV (Net Present Value), IRR (Internal Rate of Return) and ΔIRR (Difference between the IRR with without CDM revenues), seem to be the most used ones. Yang et al. (2010) use both the NPV and IRR for their study of a wind farm investment and find that uncertain CDM benefits significantly affect the project’s NPV while at the same time that in order for the project to meet the benchmark, very hard to achieve conditions on CERs and electricity prices have to be met. Bergqvist et al. (2008) also use both indicators to. xviii.
(22) perform a techno-economic assessment of rice husk-based generation and find that for this case operating hours and investment cost are the most critical parameters influencing the lifetime cost of electricity. Others, like Monjas-Barroso and BalibreaIniesta (2013) decide upon the NPV to evaluate an investment in a wind-renewable energy project, modeling the main uncertainties that affect this kind of projects, like the cost and production of electricity, investment costs and consumer price index in order to evaluate the regulatory options present in three different countries, still they do not rank the uncertainty, but rather study which countries support wind projects the most. Some revisions focusing on the IRR include Weiss et al. (2008) and Yunna and Quanzhi (2011), who study the impacts of CDM in the Thai electricity sector and the additionality for small-scale hydropower, respectively. The first study finds out that a sectorial approach to the CDM could help financing renewable energy projects, and the second one mainly performs a full additionality assessment for the hydro project, proving that it should be registered under the CDM. Au Yong (2009) on the other hand, decides to use ΔIRR to assess the degree of additionality for a sample of registered CDM projects, and finds out that almost a third of the projects exhibit ΔIRR of less than 2%, indicating that CDM only makes a small contribution and suggesting to set a minimum for the value. Nonetheless the study also shows that the projects with the smaller impact from CDM correspond to renewable energies, which are much more capital intensive than the rest of the technologies, but at the same time receive incomes for electricity or heat, whilst the ones with the highest ΔIRR only obtain gains from CERs. Another study that stands out belongs to Schneider et al. (2010), in which six renewable energy technologies and their drivers for financial and environmental aspects are analyzed. They perform the evaluation using a profitability index (NPV/Invested Capital) and the GHG specific reductions (Total GHG emissions/Invested Capital) and evaluate how project level parameters, regional and global variables impact the financial and environmental performance of a project. The data is not representative of a country, but an average of parameters found in developing countries, not allowing the cash flows to truly represent each country’s case or the performance of a particular region, as it is presented in this study. In fact, all parameters are discounted using the xix.
(23) same rate, not taking into account a country’s specific risk, which in our study will be conducted by setting an IRR benchmark adjusted by each country’s own risk. This is the first paper assessing and ranking the drivers for profitability in renewable energy projects by replicating cash flows from Project Design Documents (PDDs), comparing the results against a calculated IRR benchmark taking into account the specific risk factor of each country and attempting to provide concrete ways in which renewable energies may be promoted within the CDM. No other study has evaluated this type of technology for a whole region or focused on the different assumptions made by project developers that end up producing the variety of results observed in PDDs concerning the investment additionality analysis. The investigation is focused in Latin America, and within it, hydro and wind projects in Chile will be examined more closely. In that way, an assessment of Chile’s situation should provide one of the most conservative examples regarding different assumptions made for CDM projects. As for sustainable development, some of the main literature reviewing its benefits includes Ellis et al. (2007) who studied the 12 first registered projects, Sutter and Parreño (2007), who assessed 16 officially registered projects, Nussbaumer (2009) who studied 39 CDM projects with high sustainable development benefits and Boyd et al. (2009) who took a random sample of 10 projects to evaluate them according to qualitative measures of direct and indirect benefits based on sustainable development criteria. So far, Olsen and Fenham’s study (2008) is the most complete, analyzing 296 projects of all types, but not including in their evaluation technology transfer benefits. Regarding the latter, a number of assessments have been conducted, including Haites et al., (2006), who analyzed 854 registered and proposed projects regarding only technology transfer benefits, Dechezleprêtre et al., (2008), who take on 644 registered projects and analyze the frequency and nature of technology transfer, including a study on its drivers, Schneider et al., (2008) who focuses on the purchase of technology via trade off and transfer of technology as part of an investment, showing how CDM lowers the barriers for technology transfer and Seres et al., (2009) who provides an update of the situation covering a larger base of projects (3296) and analyzing trends in. xx.
(24) technology transfer via CDM. However, no study conducted has analyzed all sustainable development benefits including technology transfer for a large volume of renewable energy projects, the ones that should provide the higher benefits, nor is there an evaluation that comprises an up to date evaluation of the situation for the whole first commitment period. The second article contributes by assessing 180 renewable energy projects in Latin America, the first region where all of its eligible countries (those that both ratified the Kyoto Protocol and have a designated national authority – DNA) hosted a CDM project and where renewable energy projects are distributed in a more homogeneous manner. A study of Asia, the leading region, would only portray the situation of two countries: China and India, since they hold the majority of the projects, while the rest of the countries either have a few or no renewable energy projects. For the analysis we investigate the way in which CDM has contributed to sustainable development through renewable energy projects by analyzing the trends regarding frequency of benefits, types of projects and leading countries associated with different benefits. Some of the existing methodologies to evaluate sustainability can be classified as checklist approaches and multi-criteria assessment. The checklist approaches consist in a qualitative analysis of the PDD and are easily adapted for different interests amongst host countries. In studies conducted (Ellis et al., 2007; Olsen and Fenhann, 2008; Boyd et al., 2009) several pre-defined sustainable development criteria is checked against the selected documents PDDs and the obtained information analyzed for tendencies. The multi-criteria approach on the other hand, consists in combining qualitative and quantitative data and weighting the relative significance of all factors to arrive at a single measure for sustainability. Various of the most commonly used methods include the Multi-Attribute Assessment (MATA-CDM), developed by Sutter (2003), and later on by Sutter and Parreño (2007) in a study of 16 registered projects, which is modified by Nussbaumer (2009) for a study comparing normal CDM projects with those with Gold Standard qualification. The Gold Standard proposes a methodology to develop high-quality emission reduction projects with high. xxi.
(25) environmental integrity and secured sustainable development benefits (Nussbaumer, 2009). Both types of methodologies have their weaknesses as the matters evaluated are subjective and no ex-post verification of sustainable development claims is carried out by the DOE. Also, the fact that no international standard exists for measuring sustainable development benefits can lead to a “race to the bottom” (Kolshus et al., 2001), in which countries lower their requirements to attract more projects. However, the multi-criteria approach also poses the complication of collecting large amounts of data from projects’ stakeholders, and since the focus of this study in through public information from PDDs, a checklist approach is chosen instead.. 1.3. Hypothesis We intend to show that despite renewable energy being associated with the. highest amount of sustainable development benefits, their distribution is very uneven across countries and key benefits such as technology transfer are left behind. On the other hand, as for finding drivers of profitability, we expect to find that the investment cost, which is much higher for renewable energy that other technologies, is essential to calculating the internal rate of return (TIR), and that other factors such as the possible one-year delay in a project also influences profitability substantially. Further efforts will be made to show that the IRR benchmark used by project developers is chosen so that the project is not more profitable than such benchmark, to ensure the chances of it being registered under the CDM in order to receive carbon credits.. xxii.
(26) 1.4. Methodology for the Study This section presents the methodologies used for both articles: the study of. profitability drivers and of sustainable development benefits in renewable energy projects. 1.4.1. Methodology for the Study of Profitability Drivers (Article 1) In order to obtain the sample for the study, a previous analysis on. additionality was performed, selecting 180 renewable energy projects from 18 countries in the region, in particular hydro, wind and biomass projects, since other types are not numerically substantial enough as registered CDM projects. From this sample, projects are chosen to study their profitability drivers following a set of rules: they have to perform a benchmark analysis and present the IRR as a financial indicator; they have to provide enough information in order to be able to replicate their cash flows; and for the biomass projects only those generating electricity are considered. 83 projects from the initial sample have a benchmark analysis and of those, 44 meet the rest of the requirements, including 20 hydro, 18 wind and 6 biomass projects, representing in total 24% of the original sample and 14.4% of all registered renewable energy projects in Latin America. The cash flows for these projects are replicated and after that a sensitivity analysis is carried out as a simple method often used in other studies to assess risk (Diakoulaki et al., 2007; Bergqqvist et al., 2008; Yunna and Quanzhi, 2011), in order to rank the profitability drivers. The parameters varied in the sensitivity analysis correspond to the investment cost, total costs, prices on electricity, prices on capacity and plant factor, as well as simulating a one-year delay and studying the inclusion of a residual value. Finally, in order to compare projects, a benchmark IRR is also calculated, as well as CERs prices, which are obtained as an average of historical values, so as to include a comparable measure for ΔIRR between projects. A special case study is done in Chile in order to assess how much parameters can vary in one of the main economies of the region for hydro and wind technologies (no biomass project in Chile met all the requirements).. xxiii.
(27) 1.4.2. For the Study of Sustainable Development (Article 2) The utilized methodology will take on a checklist approach based on the. criteria selected by Olsen and Fenhann (2008), and Nussbaumer (2009). The first article includes a detailed set of sub-parameters from which to measure sustainable development as part of the macro parameters of social, environmental and economic benefits used in most studies, however it does not include technology transfer amongst them. The second study on the other hand does include technology transfer as part of the potential economic benefits, but as it was mentioned, it does not use a checklist approach. To complement this analysis, we include the works done by Haites et al., (2006), Dechezleprêtre et al., (2008) and Seres et al., (2009), which analyze exclusively technology transfer, defined as “a broad set of processes covering the flows of knowhow, experience and equipment for mitigating and adapting to climate change amongst different stakeholders…” (Metz and Turkson, 2000). The two aspects examined by all papers regarding technology transfer include the use of equipment and/or knowledge not previously available in the country hosting the CDM project. The sample of projects evaluated is based in 180 CDM renewable energy projects in Latin America. The totality of renewable projects in Latin America was filtered as follows: from 21 countries in the region, only countries with at least one renewable energy project are considered, reducing the total to 18 countries (Bahamas, Cube and Paraguay do not have registered renewable energy projects). For those remaining countries, if they have less than 8 projects, all of them are included in the sample, if they have more than 8 projects, 20% of all the projects in the country are considered randomly. Chile is the only country in which all the renewable energy projects are considered, with a total of 36. This is due to the fact that it is the second country in Latin America with the most projects in this category, but its quantity is still possible to evaluate, whilst Brazil, the country with most renewable energy projects, has 116, so assessing each one of them would have been a biased analysis representing only that country’s reality. The final result leads to a sample of 180 projects registered up until December 8, 2012, belonging to 18 countries: Brazil, Chile, Peru, Mexico, xxiv.
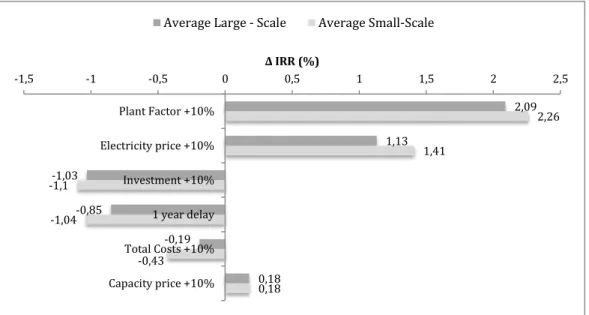
(28) Honduras, Colombia, Ecuador, Guatemala, Panama, Argentina, Costa Rica, Uruguay, Nicaragua, El Salvador, Dominican Republic, Jamaica, Bolivia and Guyana.. 1.5. Main Results, General Conclusions and Recommendations All the projects in the study, large and small, rank their drivers in the same. order. The results show that the most important factor affecting the IRR of a project is the plant factor, with a bigger impact done in wind projects, being able to increase the IRR of these projects in over 3 percentage points with a 10% increase. This is mainly due to the fact that these projects present lower performance than hydro and biomass (41% of plant factor for wind projects compared to an average in Latin America of 59% for hydro and 51% for biomass). In second place is the electricity price, affecting biomass projects almost twice as much as the others, particularly small scale projects with a more expensive cost structure. While hydro and wind projects generate large amounts of income for electricity sales, biomass projects only produce low amounts of energy, hence an increase in electricity price has a greater impact on them. In the third place is the investment cost, affecting biomass projects, the ones with the lowest capital requirements (834 US$/kW on average for projects in Latin America vs. 2,307 US$/kW for wind and 2,201 US$/kW for hydro) the most. The one-year delay ranks fourth among drivers, which influences small-scale projects much more than large-scale ones, though presenting similar drops in the projects’ IRRs for all three technologies. The total costs follow in order, influencing biomass projects the most and having a similar impact for hydro and wind projects. Finally, capacity price ranks last mainly due to the fact that electricity sells represent approximately 90% of the revenues without CERs, while capacity sells only an approximate of 10%; also most countries in Latin America do not sell capacity, thus decreasing the effect of this factor. Another important parameter to consider is the inclusion of a residual value in the cash flow, and though it is not a common practice in the region, for wind projects it can increase the IRR more than 2 percentage points. In this matter the time frame chosen for the project plays a key role since for projects with an evaluation horizon of 20 years (such as wind projects), xxv.
(29) the inclusion of a residual value makes an impact, while for horizons of over 30 years the effect is almost negligible. The lack of criteria within the CDM points to two specific problems within the study: the IRR benchmark used in the PDDs and the consideration of a residual value. We discovered the variety of values used for the IRR benchmark across Latin America, but the case of Chile demonstrated that just in one country more than three different criteria are accepted as an appropriate choice for the benchmark. This incentives project developers to use the benchmark that most suits their project so that they can be registered under the CDM, but which in many cases may not reveal the true situation of the market, hindering renewable energy projects by making them appear as risky and unattractive investments even when CERs are considered. That is why the proposed approach of the IRR benchmark would allow the majority of renewable energy projects to still be registered under the CDM to obtain revenues from it, but would also make them more attractive to investors, and by doing so, would help to promote this type of energy. The main need is for the CDM to define a universal criterion to calculate the benchmarks to be used in PDDs, in order to increase transparency and ensure that the figures are not being manipulated to gain CDM revenues. On the other hand, the lack of criteria regarding the use of a residual value is also a flaw in the CDM. Although for hydro and biomass projects the impact in profitability is not that punctuated, for wind projects it makes a huge difference, which suggests that formal rules should be set up on this factor, to either limit its use or to include a section explaining why and how it is calculated in order to prevent manipulation. An option to help the most impoverished countries to participate in renewable energy projects would be to fast-track some proposals according to host country, type and sector so that transaction costs can be minimized, as long as the majority of the countries still prove investment additionality to ensure that nonadditional projects are not registered. This is essential since renewable energy projects have barely been developed in the poorest countries, because they lack the institutional xxvi.
(30) frameworks and infrastructure, the policies to plan these technologies and the skilled labor and strategies to promote cleaner energies (Karekezi and Kithyoma, 2003). Other ways to help encourage renewable energies is to provide long-term governmental programs to support them, to set standards for equipment, buildings and cars to limit their amount of emissions. By increasing the performance of the projects, in the future investment requirements should decrease (Brown et al., 2001; Karekezi and Kithyoma, 2003; Geller et al., 2004). However other measures such as establishing a minimum ΔIRR (Au Yong, 2009) would hurt renewable energy projects instead of promoting them. This is due to the fact that these projects usually also sell electricity, so the effect of CERs is not as dramatic as for projects whose only incomes come from carbon credits. As for the sustainable development research, the sample of projects presents no tendencies between sustainable development and a host country’s activeness in CDM, the project’s size or a clear leadership of any kind of technology within renewable energies. Nonetheless, benefits are much more heterogeneous when considering host countries or types or technology than with project’s size. The likelihood of providing benefits varies greatly across types of technology, with wind projects providing higher sustainable benefits in the economic and technology transfer category and biomass projects providing greater environmental benefits, mainly due to land management. For social benefits hydro and wind projects are fairly similar, with the biggest difference in favor of hydro projects being the delivery of health benefits. Amongst all categories technology transfer is the least developed, with average benefits per project far below the rest of the categories. In fact, the countries presenting no technology transfer in Latin America: Bolivia, El Salvador, Guyana and Jamaica are amongst the poorest in Latin America, and as technology transfer is an essential help for developing countries to grow without polluting as much as developed countries have done so far, if binding emissions are set for developing countries in the future as it has been announced for the successor of the Kyoto Protocol, these countries will be the most unprepared.. xxvii.
(31) Although all renewable energy projects claimed to contribute with at least one type of benefit, these statements are not checked after the project is registered, nor are the stakeholders amongst the poorest population consulted for their opinion. That is why urgent action is needed in order to regulate the sustainable development aspect of the CDM so that it can fulfill its potential and at the same time provide justice for developing countries if emission reduction targets are to be set upon them. The proposed policies consider in the first place the crucial need to help the most impoverished countries to develop institutional capacities so they can attract CDM projects. At the same time DNAs should verify stakeholders’ opinions before issuing a letter of approval, and not just limiting their analysis to what project developers present in the PDDs. On the same matter an international standard should be set in spite of the country’s sovereignty right to decide upon their own sustainability requirements, since this framework has proved to be inefficient in terms of sustainable development. The definition of the categories and sub-categories used in this article may help in this matter as a checklist, but other incentives such as lowering transaction costs for projects presenting more types or quantities of benefits (which should be previously defined), would encourage project developers to ensure real sustainable development benefits. As it has been seen, it is fundamental to take more action to promote both CDM and renewable energies. The succeeding document to the Kyoto Protocol is to be presented in 2015, so changes to the structure of the agreement should be made now. The next agreement should also impose short-term goals and not only long-term targets, as stated by Verbruggen (2009), in order to keep a more detailed control of how many reductions are being accomplished, and to be able to take sooner action in case of need. The CDM should be placed directly below the United Nations, and not just as a mechanism within the Kyoto Protocol. Its framework should also be restructured, so that incentives are put in the correct path: to promote renewable energies, to build capacities and give opportunities to develop projects in the poorest countries and most importantly to give the CDM the attention it deserves as the main effort aimed to help developing countries to adapt to climate change.. xxviii.
(32) This study provides a proof to the benefits provided by renewable energy projects and at the same time a warning to realize that without promoting this type of energy, it is very difficult for projects of this kind to be developed. By ranking the profitability drivers, uncertainties about renewable energy projects could be reduced and as such profitability could increase, which would incentive more investments. It is fundamental for CDM to verify that sustainable development reaches the population in most need of it, and for that the checklist of criteria proposed in this investigation could be used to make a system of points for projects to use as a multiplying factor for CERs. By doing so a compensation would occur between the projects providing more benefits for sustainable development, like renewable energies, and those that generate many low-cost emission reductions but provide almost no benefits. In that way renewable energy projects would gain a competitive advantage and the CDM would be able to actually fulfill both of its objectives.. xxix.
(33) 2 PROFITABILITY DRIVERS FOR CLEAN DEVELOPMENT MECHANISM (CDM) RENEWABLE ENERGY PROJECTS IN LATIN AMERICA AND A CASE STUDY IN CHILE. Abstract Renewable energy projects present the highest potential within the CDM to contribute to countries’ sustainable development. However, they deliver fewer carbon credits than other project alternatives and present higher risks, such as high investment costs, limited available experience and inadequate diffusion. So far, the CDM’s incentives have promoted projects delivering higher dividends, leaving renewable energies and sustainable development behind, thereby exposing the need to understand renewable energy projects and their profitability drivers better. This would reduce their risks, thus increasing their profitability. This paper studies the drivers associated with projects’ profitability by replicating 44 cash flows from renewable energy projects in Latin America. It also analyzes the different assumptions taken by project developers for projects with similar characteristics in Chile, aiming to expose that no methodologies are used to choose parameters for evaluating projects. The results of the study of drivers demonstrate that for the sample the plant factor is the key driver for profitability, followed by electricity price, investment cost and a one-year delay. This paper primarily proposes the CDM to be restructured to promote renewable energies and to establish universal criteria for the investment additionality assessment, avoiding data manipulation solely with the goal of increasing CDM revenues.. 1.
(34) 2.1. Introduction Since the industrial revolution the consumption of fossil fuels has. increased at alarming rates, which has precipitated global warming (Fujime, n.d.). The United Nations Framework Convention on Climate Change (UNFCCC) adopted the Kyoto Protocol in 1997 in order to stabilize greenhouse gas (GHG) concentrations in the atmosphere, mainly due to human activity (Rose, 2008). To do so, industrialized countries have committed themselves to reduce their emissions of GHGs to an average of 5% below their 1990 levels by 2012. Three flexible mechanisms were created to help developed countries to meet their targets in the most cost-effective way. These include Emissions Trading, Joint Implementation, and the Clean Development Mechanism (CDM), the only market-based mechanism under the Protocol that also involves developing countries. Through its double-objectives of cost-effectiveness and sustainable development, CDM allows developed countries to be credited for emissions reductions (known as a “Certified Emission Reduction” or “CER”) achieved by investing in projects located in developing countries. Hence, developed countries benefit from the lower abatement costs, while simultaneously increasing financial flows and contributing towards sustainable development in host (developing) countries. Sustainable development is supposed to offer energy security according to human needs, to increase energy efficiency and mainly minimize the waste of valuable resources (Jefferson, 2006). However, while reductions in the CDM are regulated at an international level, sustainable development is left to each country’s sovereignty. This has led to a trade-off between CDM’s two purposes during the first commitment period (2008-2012), favoring low-cost emission reductions and incentivizing competition amongst host countries to attract CDM projects by lowering their sustainability requirements. The Kyoto Protocol stated that emission reductions from a CDM project should be in addition “to any that would occur in the absence of such activities” (UNFCCC, 1997), meaning that without the CDM, the project would encounter severe disadvantages or obstacles (Yunna and Quanzhi, 2011). However, this definition is too 2.
(35) subjective and open to interpretation, which is why in 2008 a CDM tool to assess additionality, in order to be registered under the CDM and receive CERs, was introduced. The tool asks the project developers to define the alternatives to the project and to perform a common practice analysis, a barrier analysis, and an investment analysis. The common practice analysis requires having to prove that no similar activities to the project can be observed, or that if they are, they have key distinctions. The barrier analysis requires demonstrating that at least one exists to prevent the implementation of the project, or that in any of the other alternative scenarios that barrier does not exist. Finally, the investment analysis, which is the one we focus on this paper, is the only quantitative test and also the most objective (Au Yong, 2009). It requires to prove that the project is either not the most economically attractive option or that it is not feasible (UNFCCC 2007b). Since the choice of criteria is left to the project participants (Greiner and Michaelowa, 2003), there is need to establish clear guidelines in order to ensure both cost-effectiveness and that real sustainability contributions exist.. In the context of the CDM, renewable energy projects present the highest potential to achieve the duality of objectives. Not only can they help to decarbonize the power sector (Schneider et al., 2010), but they also have the potential to assist developing countries in achieving greater independence from foreign oil producers (Jhirad, 1990; Martinot et al., 2002; Weiss et al., 2008), while simultaneously providing higher sustainable development benefits than most technologies (Ellis et al., 2007; Sutter and Parreño, 2007; Nussbaumer, 2009). They are of special importance to diversify the energy matrix, considering that the world faces several energy problems in the future, such as the scarcity of oil, environmental degradation and the continually increasing needs of the developing world (Dorian et al., 2006). Nevertheless, since renewable energy is capital-intensive, it is necessary for host countries to support and promote it. If left only to the market, renewable energy will inevitably be excluded because of its higher costs and low competitive advantages compared with other CDM project alternatives such as methane reductions, N2O reductions or sink projects. 3.
(36) (Xingang et al., 2011). Moreover, in some countries there is a need to reform power markets so they offer better quality of service and more affordable access to electricity to the poorer population (Besant-Jones, 2006). This is the case of several Caribbean countries fueled by costly diesel, where renewable energy could play a relevant role in this task. This paper therefore focuses on the study of profitability drivers for renewable energy CDM projects, aiming to find the key economic parameters of these types of projects through the investment analysis, in order to be able to understand them better, to lower their associated uncertainties, and thus promote investments in renewable energy that makes a strong contribution to sustainable development. There are four main streams of literature in the economic context of the CDM. A first stream studies investment additionality as a general term (Philibert, 1998; Shrestha and Timilsina, 2002; Greiner and Michaelowa, 2003; Au Yong, 2009). The stream focuses its debate on which option (barriers, Internal Rate of Return (IRR), Net Present Value (NPV), Difference between the IRR with without CDM revenues (ΔIRR), payback period, etc.) is the best to prove a project’s additionality, with the dominant view agreeing that the IRR is the least prone to manipulation alternative. A second stream analyzes the investment additionality related to renewable energies (Schneider et al., 2010; Masini and Menichetti, 2013; Monjas-Barroso and Balibrea-Iniesta, 2013) but no study focuses on a particular region or on the profitability drivers of actual projects throughout the CDM first commitment period (2008-2012), as evaluated in this paper. A third stream concentrates on techno-economic performance of determined projects in a particular area (Weiss et al., 2008; Xingang et al., 2011; Yunna and Quanzhi, 2011; Purohit, 2008; Bergqvist et al., 2008; Yang, 2010), emphasizing the need to promote renewable energies to contribute towards sustainable development. The final stream studies risk, pricing, and how to promote CDM (Lee et al., 2012; Cormier and Bellassen, 2012; Tang et al., 2012; Bode and Michaelowa, 2003), but most of the evaluations are in regard to CDM specific risks, like high transaction costs and delays in. 4.
(37) registering projects, but do not address most risks associated with the profitability of a project. This is the first paper assessing and ranking the drivers for profitability in a sample of renewable energy projects through the replication of cash flows from Project Design Documents (PDDs). It compares the results against a calculated IRR used as benchmark, taking into account the specific risk factor of each country (and its components) and attempting to provide concrete ways in which renewable energy may be promoted within the CDM. No other study has evaluated this type of technology for a whole region or focused on the different assumptions made by project developers that end up producing the variety of results observed in PDDs concerning the investment additionality analysis. The investigation is focused in Latin America, the first region where all of its eligible countries (those that both ratified the Kyoto Protocol and have a designated national authority – DNA) have hosted a CDM project and also the region in which renewable energy projects are most spread throughout countries. This is also the region where the authors have participated in several projects, including some that have made the sample, providing better understanding of them. Within Latin America, hydro and wind projects in Chile will be examined more closely, given the fact that it is the third most active country in the CDM in the region, after giants such as Brazil and Mexico, and 6th worldwide after China, India, Korea, Brazil and Mexico, and first in CERs registered among small countries. In addition, Chile is one of the main economies in the region, occupying the first place in human development, GDP per capita, life expectancy and peace as well as high political stability, absence of violence, government effectiveness, access to capital, regulatory quality, rule of law, control of corruption and the lowest murder rate of the region, making it an ideal place to develop CDM projects (World Bank 2012; UNDP, 2012; International Monetary Fund, 2012; UNODC, 2012; IEP, 2012). Thus, an assessment of Chile’s situation should provide one of the most conservative examples regarding the. 5.
(38) difference of assumptions made for CDM projects since in this country project developers have the lowest incentives to manipulate parameters. The article is organized as follows: Section 2.2 provides a background on investment additionality. Section 2.3 describes the sample of projects studied and the methodology used. Section 2.4 presents the results for Latin America and Chile and discusses the main findings of the investigation. Section 2.5 concludes. 2.2. Background on investment additionality for renewable energy This section first discusses papers dealing with investment additionality, in. particular analyzing the different methods used to compare profitability. A description of the different approaches used to prove additionality and their advantages and disadvantages follows. Finally, the section concludes with a focus on the difficulties associated with renewable energy projects. 2.2.1. Previous Studies on investment additionality Several papers have taken their field of study in the investment assessment. of the additionality test for CDM registration, concentrating on the impacts of additionality on particular projects or technologies. In order to compare the financial performance of a project, a range of indicators exist, from which the NPV (Net Present Value), IRR (Internal Rate of Return) and ΔIRR (Difference between the IRR with without CDM revenues), seem to be the most used. For example, Yang et al. (2010) use both the NPV and IRR for their study of a wind farm investment and find that the uncertainty of CDM benefits significantly affects the project’s NPV while at the same time in order for a project to meet the benchmark, very hard to achieve conditions on CERs and electricity prices have to be met. Bergqvist et al. (2008) also use both indicators to perform a techno-economic assessment of rice husk-based generation and find that for this case operating hours and investment costs are the most critical parameters influencing the lifetime cost of electricity. Others, like Monjas-Barroso and Balibrea-Iniesta (2013) decide upon the NPV to evaluate an investment in a windrenewable energy project, modeling the main uncertainties that affect this kind of. 6.
(39) project, such as the cost of electricity, production of electricity and investment costs in order to evaluate the regulatory options present in three different countries. Their focus however remains on identifying which countries support wind projects the most. On the other hand this paper ranks the uncertainties in the order in which they affect profitability. Some revisions focusing on the IRR include Weiss et al. (2008) and Yunna and Quanzhi (2011), who study the impacts of CDM in the Thai electricity sector and the additionality for small-scale hydropower, respectively. The first study finds that a sectorial approach to the CDM could help financing renewable energy projects (Weiss et al, 2008), while the second mainly performs a full additionality assessment for the hydro project, proving that it should be registered under the CDM (Yunna & Quanzhi, 2011) . Au Yong (2009) on the other hand, uses ΔIRR to assess the degree of additionality for a sample of registered CDM projects, and finds that almost a third of the projects exhibit ΔIRR of less than 2%, indicating that CDM only makes a small contribution and suggesting to set a minimum for the value. Another significant study conducted by Schneider et al. (2010) analyzed six renewable energy technologies and their drivers for financial and environmental aspects. They perform the evaluation using a profitability index (NPV/Invested Capital) and the GHG specific reductions (Total GHG emissions/Invested Capital) and evaluate how project level parameters, regional and global variables impact the financial and environmental performance of a project. The data is not representative of a country, but an average of parameters found in developing countries, not allowing the cash flows to truly represent each country’s case or the performance of a particular region, as it is presented in this study, nor does it comprise the entire first commitment period, but only about half of it. In fact, all parameters are discounted using the same rate, not taking into account a country’s specific risk, which in our study will be conducted by setting an IRR benchmark adjusted by each country’s own risk.. 7.
(40) 2.2.2. Different criteria to define investment additionality Greiner and Michaelowa (2003) in their study describe the different types. of approaches towards proving the investment additionality of a project. The criteria can be separated into two groups: qualitative and quantitative. The qualitative group mainly focuses on barriers, here projects can be deemed additional if they face more barriers than a reference case or if they need the CDM funding to remove barriers for implementation. While different countries and technologies have different criteria, barriers are usually divided into investment (for projects presenting high costs or unable to raise enough funds), technology (the technology is not yet mature), habit disorder (the technology is not yet popular in the local region or country) and other barriers, such as policies, laws, institutional, information or resource barriers (Yunna and Quanzhi, 2011). The quantitative group can be divided into three cases: reference-case-based criteria, threshold-based criteria and contribution of CERs to the revenue. The reference-case-based criteria consists in comparing financial indicators (investment costs / total costs / IRR / NPV) of the project with those of a reference case, and the project is additional if it is less economically attractive to the project developer than the reference one. The threshold criterion consists of comparing financial indicators (IRR / payback period) to a benchmark value. Only if the project is less economically attractive than the threshold is it considered additional. In the case of the contribution of CERs to the revenue, a project is considered additional if CERs contribute significantly to increase the incomes and/or profitability of a project and can be demonstrated using the IRR, NPV or payback period. However the latter does not help to eliminate profitable projects since the project may have been profitable even without the incomes generated by CERs and this method would only show how much incomes or profitability increases. While all of these criteria may be used to prove the investment additionality, some indicators are more fit than others depending on the situation. For the barriers criteria, in a study by Schneider (2007), it was found that only 6% of the validation reports contain a detailed assessment of each barrier, so most of the times the barriers 8.
Figure
+7


Documento similar