Macroeconomic policy for full and productive employment and decent work for all: an analysis of the Argentine experience
107
0
0
Texto completo
(2) Copyright © International Labour Organization 2011 First published 2011 Publications of the International Labour Office enjoy copyright under Protocol 2 of the Universal Copyright Convention. Nevertheless, short excerpts from them may be reproduced without authorization, on condition that the source is indicated. For rights of reproduction or translation, application should be made to ILO Publications (Rights and Permissions), International Labour Office, CH-1211 Geneva 22, Switzerland, or by email: pubdroit@ilo.org. The International Labour Office welcomes such applications. Libraries, institutions and other users registered with reproduction rights organizations may make copies in accordance with the licences issued to them for this purpose. Visit http://www.ifrro.org to find the reproduction rights organization in your country.. ILO Cataloguing in Publication Data Damill, Mario; Frenkel, Roberto; Maurizio, Roxana Macroeconomic policy for full and productive employment and decent work for all: an analysis of the Argentine experience / Mario Damill, Roberto Frenkel, Roxana Maurizio ; International Labour Office, Employment Sector, Employment Policy Department. - Geneva: ILO, 2911 1 v. (Employment working paper, No. 109) ISBN: 978-92-2-125827-8; 978-92-2-125828-5 (web pdf) ISSN 1999-2939 (print); ISSN 1999-2947 (web pdf) International Labour Office; Employment Policy Dept full employment / employment / decent work / labour policy / income distribution / poverty alleviation / economic policy / trend / Argentina 13.01.3. The designations employed in ILO publications, which are in conformity with United Nations practice, and the presentation of material therein do not imply the expression of any opinion whatsoever on the part of the International Labour Office concerning the legal status of any country, area or territory or of its authorities, or concerning the delimitation of its frontiers. The responsibility for opinions expressed in signed articles, studies and other contributions rests solely with their authors, and publication does not constitute an endorsement by the International Labour Office of the opinions expressed in them. Reference to names of firms and commercial products and processes does not imply their endorsement by the International Labour Office, and any failure to mention a particular firm, commercial product or process is not a sign of disapproval. ILO publications and electronic products can be obtained through major booksellers or ILO local offices in many countries, or direct from ILO Publications, International Labour Office, CH-1211 Geneva 22, Switzerland. Catalogues or lists of new publications are available free of charge from the above address, or by email: pubvente@ilo.org Visit our website: http://www.ilo.org/publns. Printed in Switzerland. ii.
(3) Preface The primary goal of the ILO is to contribute, with member States, to achieve full and productive employment and decent work for all, including women and young people, a goal embedded in the ILO Declaration 2008 on Social Justice for a Fair Globalization, and1 which has now been widely adopted by the international community. In order to support member States and the social partners to reach the goal, the ILO pursues a Decent Work Agenda which comprises four interrelated areas: Respect for fundamental worker’s rights and international labour standards, employment promotion, social protection and social dialogue. Explanations of this integrated approach and related challenges are contained in a number of key documents: in those explaining and elaborating the concept of decent work2, in the Employment Policy Convention, 1964 (No. 122), and in the Global Employment Agenda. The Global Employment Agenda was developed by the ILO through tripartite consensus of its Governing Body’s Employment and Social Policy Committee. Since its adoption in 2003 it has been further articulated and made more operational and today it constitutes the basic framework through which the ILO pursues the objective of placing employment at the centre of economic and social policies.3 The Employment Sector is fully engaged in the implementation of the Global Employment Agenda, and is doing so through a large range of technical support and capacity building activities, advisory services and policy research. As part of its research and publications programme, the Employment Sector promotes knowledge-generation around key policy issues and topics conforming to the core elements of the Global Employment Agenda and the Decent Work Agenda. The Sector’s publications consist of books, monographs, working papers, employment reports and policy briefs.4 The Employment Working Papers series is designed to disseminate the main findings of research initiatives undertaken by the various departments and programmes of the Sector. The working papers are intended to encourage exchange of ideas and to stimulate debate. The views expressed are the responsibility of the author(s) and do not necessarily represent those of the ILO.. José Manuel Salazar-Xirinachs Executive Director Employment Sector. 1. See http://www.ilo.org/public/english/bureau/dgo/download/dg_announce_en.pdf. 2. See the successive Reports of the Director-General to the International Labour Conference: Decent work (1999); Reducing the decent work deficit: A global challenge (2001); Working out of poverty (2003). 3. See http://www.ilo.org/gea. And in particular: Implementing the Global Employment Agenda: Employment strategies in support of decent work, “Vision” document, ILO, 2006. 4. See http://www.ilo.org/employment.. iii.
(4)
(5) Foreword At the 99th session of the International Labour Conference, constituents endorsed the need to promote a ‘pro-employment’ macroeconomic framework. It was felt that the current framework, while making an important contribution to the goal of macroeconomic stability, paid insufficient attention to the way in which macroeconomic policy instruments either helped or hindered employment creation and poverty reduction. In the standard framework that has evolved since the days of the structural adjustment programmes of the 1980s and 1990s, and that has remained intact during the 2000s, the emphasis is on attaining key nominal targets pertaining to debts, deficits and inflation. The rationale is that attaining such targets in the medium to long run will engender a predictable macroeconomic environment that is crucial for supporting growth and hence employment creation. It now appears that macroeconomic stability is necessary, but by no means sufficient to engender inclusive, job-rich growth. The ILO/Korea partnership programme has been supporting the Employment Policy Department’s endeavour to identify existing constraints in the macroeconomic policy instruments that may hinder generation of full and productive employment, and to suggest a way forward for job-rich growth. A series of country case studies has been conducted, and the current case study of Argentina represents one result. The country case study analyzes recent macroeconomic performance, shows their relationship with employment outcomes or lack thereof, reviews the existing programmes on employment and social safety nets, and reflects the views of the ILO constituency and other key national stakeholders that were collected through interviews and consultations. In the last two decades, the Argentine experience shows that the macroeconomic regime is crucial in determining the overall performance of the labour market and has a direct impact on the level and distribution of welfare. Argentina experienced two distinct macroeconomic policy frameworks marked by the 2001-2002 crisis. The first one was the so called “Convertibility Plan” between 1991 and 2001, characterized by a pro market approach that involved fixing of the nominal exchange rate to the US dollar in order to stabilize prices. This was also accompanied by international trade liberalization measures that eliminated most non-tariff barriers and abruptly reduced tariffs, as well as complete liberalization of the capital accounts. The combination of measures implemented led to firms in the tradable sectors adapt to the competitive environment by using more imported inputs and replacing workers by imported machinery, resulting in negative growth of employment. While non-tradable sectors generated much of the new jobs during this period, the 1995 recession triggered by the Tequila crisis led to a stagnation of employment growth in the non-tradable sectors as well. Since 1995, this was accompanied by a declining trend in real average income of workers, rising wage income inequality, and increases in poverty. Following the 2001-2001 crisis, the macroeconomic policy was radically altered to focus on the preservation of a stable and competitive real exchange rate (SCRER), between 2002 and 2006. It led to very fast growth of employment led by generation of new formal jobs, as well as a recovery of real wages and improved income distribution. The win surpluses that SCRER generated showed itself as a powerful mechanism to promote economic growth and improve social conditions. Together with such macroeconomic setting, labour market policies and institutions as well as interventions that improve the quality of jobs and reinforce real wage recovery are crucial. Furthermore, in order to significantly reduce poverty incidence, such labour market policies shall be complemented by income and social protection policies focused on the vulnerable groups. The paper was presented and discussed at the Employment Policy Department Knowledge Sharing Workshop on Pro-employment macroeconomic frameworks, sectoral. v.
(6) strategies for employment creation and the informal economy that took place between the 20th and 23rd of September at the ILO premises in Geneva. Azita Berar Awad Director Employment Policy Department. vi.
(7) Contents Page. Preface ...................................................................................................................................................... iii Foreword ................................................................................................................................................... v Graphs .................................................................................................................................................... viii Tables ........................................................................................................................................................ x 1.. Introduction ........................................................................................................................................ 1. 2.. The Convertibility Program and the labor market ............................................................................. 3 Fiscal policy under the Convertibility setting ................................................................................. 9 The way to the crisis ..................................................................................................................... 12 The labor market in the nineties .................................................................................................... 13 A simple labor market model ....................................................................................................... 18 Industrial sector employment ........................................................................................................ 19 Evolution of average income and distribution in the 1990s .......................................................... 19 Poverty and extreme poverty ........................................................................................................ 23. 3.. Macroeconomic policies and the labor market in the 2000s ............................................................ 24 A radically new scenario ............................................................................................................... 24 The rise of the SCRER model ....................................................................................................... 24 The SCRER model and monetary policy ...................................................................................... 27 External and fiscal adjustment ...................................................................................................... 29 Macroeconomics after 2006: the SCRER framework disarticulation ........................................... 30 Financial isolation and capital flights ........................................................................................... 32 The expansionary bias of fiscal policy .......................................................................................... 35 Transmission of the global crisis: the financial channel ............................................................... 38 The global crisis and the aggregate demand ................................................................................. 41 Real exchange rate appreciation.................................................................................................... 42 Two phases of monetary policy .................................................................................................... 45 Employment, unemployment, wages and income distribution in the 2000’s ............................... 46 Labor incomes and their distribution ............................................................................................ 58 Family incomes and their distribution........................................................................................... 64 Poverty and extreme poverty ........................................................................................................ 66. 4.. Conclusions ...................................................................................................................................... 71. References ............................................................................................................................................... 73 Appendix 1: Econometric estimation of a full-time employment function ............................................. 76. vii.
(8) Appendix 2: Income and hours equations ............................................................................................... 79. Graphs Page Graph 2.1 Seasonally-adjusted real GDP (in millions of pesos of 1993) and employment rate………....2 Graph 2.2 Multilateral real exchange rate (second semester 1986 = 1)………………………………….6 Graph 2.3 Balance of payments (four quarters m.a. in millions of dollars)……………………………...6 Graph 2.4 Average country-risk Premium for emerging market economies and for Argentina (1997:01 – 2001:06)…………………………………………………………………………………...10 Graph 2.5 Primary result of the national public sector (% of GDP)…………………………………….11 Graph 2.6 Aggregate financial surpluses by sector (% of GDP)………………………………………..11 Graph 2.7 Average real wages in the manufacture (deflated by CPI) and average wage in constant US dollars (second semester 1986 = 1)………………………………………………………..14 Graph 2.8 Average wage in constant US dollars and unit labor costs in constant US dollars (first quarter of 1986=100)………………………………………………………………………………14 Graph 2.9 Average wage and unit labor costs, measured in constant foreign currencies (first quarter of 1986=100)…………………………………………………………………………………15 Graph 2.10 Labor market indicators: Participation rate, employment rate, employment rate excluding PJJHD, full employment rate excluding PJJHD (as % of total urban population)………..17 Graph 2.11 Real average income of workers and active individuals (in pesos of 1998)………………..20 Graph 2.12 Real per capita family income (in pesos of May 1998)…………………………………….21 Graph 2.13 Gini Indexes of labor incomes, Greater Buenos Aires, May 1991- October 2001…………22 Graph 2.14 Relationship of the per capita family income between the fifth and first quintile, Greater Buenos Aires, May 1991- October 2001…………………………………………………..22 Graph 2.15 Poverty rates, Greater Buenos Aires, May 1991- October 2001…………………………...23 Graph 3.1 Average country-risk premium for emerging market economies and for Argentina and Brazil (in basis points)……………………………………………………………………………34 Graph 3.2 External asset accumulation of the non-financial private sector (millions of US dollars)…..35 Graph 3.3 Foreign Exchange Balance (moving average of 4 quarters, in millions of US dollars)……..35 Graph 3.4 Fiscal impulse (% of GDP)…………………………………………………………………..36 Graph 3.5 Stock of foreign reserves of the Central Bank (billion dollars)……………………………...41. viii.
(9) Graph 3.6 Multilateral real exchange rate and real exchange rate with the US dollar (December 2001=100)…………………………………………………………………………………44 Graph 3.7 Evolution of monetary aggregates in real terms……………………………………………..47 Graph 3.8 Employment rate (with and without employment programs), total urban centers, May 1991-II semester 2010……………………………………………………………………………...49 Graph 3.9 Employment and Full-time Employment rates, total urban centers, I quarter 2003-II quarter 2010………………………………………………………………………………………..50 Graph 3.10 Unemployment rate, total urban centers, October 1995-II quarter 2010…………………...51 Graph 3.11 Unemployment and underemployment rates, total urban centers, I quarter 2003-II quarter 2010………………………………………………………………………………………..52 Graph 3.12 Employment by occupational category and their trends, total urban centers, III quarter 2003II quarter 2010 (III quarter 2003=100)…………………………………………………….52 Graph 3.13 Percentage of non-registered wage earners in total wage earners, total urban centers, III quarter 2003-II quarter 2010………………………………………………………………54 Graph 3.14 Seasonally adjusted real GDP and jobs registered in the Social Security System, 19942010.. ………….…………………………………………………………………………..55 Graph 3.15 Inter-annual real GDP and private jobs registered in the Social Security System growth, 2003-2010 (%)……………………………………………………………………………..56 Graph 3.16 Employment rate by educational level, total urban centers, III quarter 2003-II quarter 2010 (III quarter 2003=100)……………………………………………………………………..57 Graph 3.17 Employment and physical output in manufacturing sector, I quarter 1990-II quarter 2010 (1997 = 100)……………………………………………………………………………….58 Graph 3.18 Real income from main occupation. Excludes employment programs. Total urban centers, October 1995- II quarter 2010 (Index October 2001=100)………………………………..61 Graph 3.19 Real wages from main occupation of registered and non-registered wage earners. Excludes employment programs. Total urban centers, October 1995- II quarter 2010 (Index October 2001=100)…………………………………………………………………………………62 Graph 3.20 Real Minimum Wage, 1995-2010 (in pesos of August 2010)……………………………...63 Graph 3.21 Gini Index of income from main occupation. Excludes employment programs, total urban centers, October 1995- II quarter 2010……………………………………………………64 Graph 3.22 Real Per Capita Family Income, total urban centers, October 1995- II quarter 2010 (Index October 2001=100)………………………………………………………………………..66 Graph 3.23 Gini Index of Family Income, Total urban centers, October 1995- II quarter 2010………..67 Graph 3.24 Poverty in households and individuals, Total urban centers, May 2001-I semester 2010….69 Graph 3.25 Extreme Poverty in households and individuals, total urban centers, May 2001-I semester 2010………………………………………………………………………………………..70. ix.
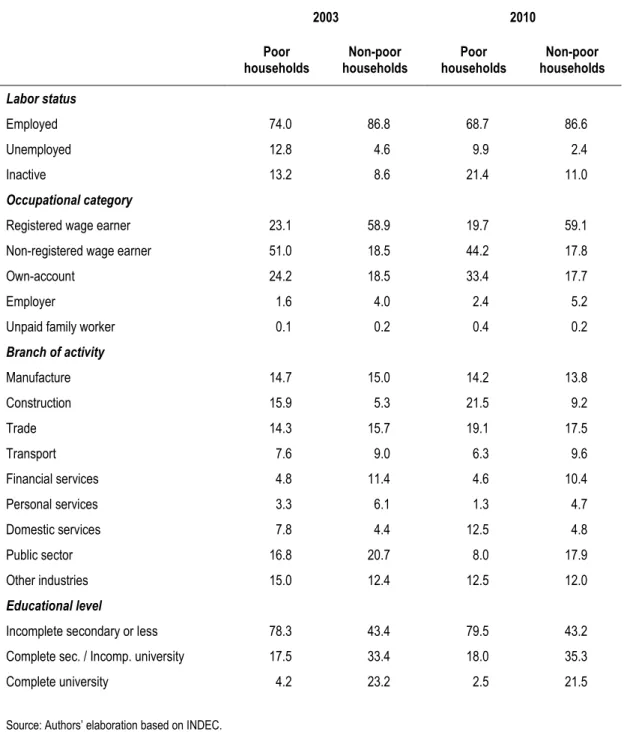
(10) Tables Page Table 2.1 Multilateral real exchange rate, average per period (2nd semester of 1986 = 1)……………….7 Table 2.2 Rate of full employment per productive sector (in percentage of total population of GBA; selected semesters)………………………………………………………………………...19 Table 3.1 CPI annual rates of inflation………………………………………………………………….31 Table 3.2 Monetary base and domestic credit to the private sector, as % of GDP……………………...42 Table 3.3 Evolution of employment by occupational category, total urban centers, III quarter 2003 – II quarter 2010………………………………………………………………………………..53 Table 3.4 Evolution of employment by educational level, Total urban centers, III quarter 2003-II quarter 2010………………………………………………………………………………………..57 Table 3.5 Evolution of employment by branch of activity, total urban centers, III quarter 2003-II quarter 2010………………………………………………………………………………………..59 Table 3.6 Evolution of employment by gender, total urban centers, III quarter 2003-II quarter 2010…59 Table 3.7 Evolution of employment by age, total urban centers, III quarter 2003-II quarter 2010……..59 Table 3.8 Quintile distribution of income from main occupation, total urban centers, III quarter 200.3 – II quarter 2010……………………………………………………………………………..65 Table 3.9 Real income for main occupation by occupational category, total urban centers, III quarter 2003 – II quarter 2010……………………………………………………………………..65 Table 3.10 Average total family income by quintiles, total urban centers. Includes employment programs and annual complementary salary………………………………………………67 Table 3.11 Characteristics of household heads between 25 and 65 years old, total urban centers, 2003 and 2010…………………………………………………………………………………...72. x.
(11) 1.. Introduction The Argentine experience in the last two decades offers rich evidence about the linkages between macroeconomic policies and the generation of employment and wages. Thus, its analysis may contribute to a better understanding of some central issues involved in the current debates regarding macroeconomic policy design and targets. Specifically, it is an illustrative case to assess to what extent macro policies may either help or hinder the goal of attaining full and productive employment in an emerging market economy. This experience makes it possible to compare two macroeconomic policy frameworks that were implemented for relatively extended time spans and were particularly dissimilar in conception and design as well as in their targets, instruments and institutional environment. Their outcomes in terms of economic growth, inflation, employment generation, wages and income distribution were also markedly different. The first of these programs was the so-called “Convertibility Plan” between 1991 and 2001. The main pillar of this macroeconomic policy framework, inspired in a decidedly market-friendly approach to macro policy, was the legal fixation of the nominal exchange rate, employed as an anchor to stabilize prices. Two elements of this macro policy setting were particularly negative regarding labor market and social performances: the strong real appreciation associated with the utilization of a fixed exchange rate as the main antiinflationary instrument, on the one hand, and the radical opening to imports, on the other. The combination of both factors caused an intense loss of workplaces in tradable sectors, particularly in manufacturing. Figure 1.1 shows that the aggregate employment rate started to fall in 1992, while GDP kept growing fast until 1995, when the economy was hit by the Tequila effect. The period 1992-94 is actually the only one in the figure in which GDP and employment show a clearly negative correlation. Later on, the recession of 1995 brought aggregate unemployment and underemployment to unprecedented historical highs, and the recovery of employment in 1996-98 reduced unemployment rates but not enough as to recover pre-recession levels, as we will discuss in detail below. The second macroeconomic policy setting ruled between 2002 and 2006 and, in contrast with the nineties, it was centrally characterized by the preservation of a stable and competitive real exchange rate (SCRER). These two policy periods are separated by the deep crisis of the Convertibility regime in 2001-2002, in which macroeconomic, labor market and social indicators suffered an additional and abrupt worsening, as illustrated by the steep fall in the employment rate in Figure 1.1. The post crisis period witnessed an extended reversion of what had been observed in the nineties: employment recovered at a fast pace, unemployment and underemployment were reduced substantially and income distribution tended to improve considerably. However, from late 2006, a new phase emerged in which the SCRER setting tended to fade away. Internal causes were predominant in the progressive weakening of the coherence of the SCRER policy setting. The main domestic factor was a process of increasing inflation. The recent global crisis had also a negative but relatively limited impact: it brought the economy to a short-lived recession, but the strong disruptive financial mechanisms that had characterized past recessions in Argentina have not been present this time. Furthermore, some effective policy measures were taken to cushion the impact of the recession on the labor market, like a program to subsidize employment in critical sectors, as we discuss below. Be that as it may, from early 2007 to 2010, the performance of labor market variables, income distribution and social indicators lost dynamism, thus interrupting the very favorable trends that had been observed after the convertibility crisis. The behavior of the employment rate (see graph 2.1) is an example of this.. 1.
(12) 2010S1. 2009S2. 2009S1. 2008S2. 2008S1. 2007S2. 2007S1. 2006S2. 2006S1. 2005S2. 2005S1. 2004S2. 2004S1. 2003S2. 2002 O. 2003 M / S1. 2001 O. 2002 M. 2000 O. 2001 M. 1999 O. Employment rate (left axis). 2000 M. 1998 O. 1999 M. 1997 O. 1998 M. 150000 1996 O. 32 1997 M. 200000. 1995 O. 34. 1996 M. 250000. 1994 O. 36. 1995 M. 300000. 1993 O. 38. 1994 M. 350000. 1992 O. 40. 1993 M. 400000. 1991 O. 42. 1992 M. 450000. 1991 M. 44. (millions of pesos of 1993). Seasonally-adjusted real GDP (in millions of pesos of 1993) and employment rate. (%). Graph 2.1. GDP (right axis). Source: Authors’ elaboration based on Ministry of Economy and OFJ (Orlando J. Ferreres Asociados SA).. The contents of the paper are the following. In Chapter 2, we discuss the labor market evolution in the decade of the nineties, focusing on the connections between labor market and macroeconomic variables. We understand that the main channels from macroeconomic policies to labor market performance go through aggregate demand behavior and consequently through the level of economic activity (that is closely correlated to employment generation), and also through aggregate relative prices, like the real exchange rate, real wages and wages measured in foreign currency, particularly because these prices affect labor utilization. We focus on the design of the Convertibility Plan and on its performance, including its effects on the labor market, as well as on income distribution, poverty and extreme poverty. Then, in Chapter 3, we analyze the macroeconomic and labor market evolution in the 2000’s. In the first section of the chapter we offer a short description of the crisis of the Convertibility regime and then we present the stylized facts of the design and performance of the SCRER policy model. In the second section, we focus on the subsequent phase, characterized by the disarticulation of the SCRER model from late 2006 on. Here, we also present a brief analysis of the impact of the recent global crisis on the Argentine economy. Then, given macroeconomic policies and events, we examine the evolution of employment, wages and income distribution in the 2000’s. A number of boxes accompany the development of the main text, presenting additional information, like descriptions of specific social programs. Finally, in Chapter 4 we present some policy conclusions based on the Argentine experience.. 2.
(13) 2. The Convertibility Program and the labor market Argentina embraced a radical experiment of market-oriented macro policies in the nineties. Being a reaction against a story of accentuated macroeconomic instability, the central aspect of the Convertibility program was its anti-inflationary character. The “hard pegging” of the peso to the US dollar was the main instrument. The program also involved the elimination of most non-tariff barriers to international trade and an abrupt tariff reduction, among other reforms. It had a sudden and strong anti-inflationary impact, but some of the domestic collateral effects were problematic, particularly regarding employment generation. The tradable sectors, the industrial sector in particular, had to face strong competitive pressures from imported goods, in a context of major real exchange-rate appreciation. To adapt to this very competitive environment, productive firms resorted to a number of strategies: they increased the use of imported inputs, they also became importers of part of the products that were produced domestically before the trade opening, and replaced workers by imported machinery, among other measures aimed at reducing costs and increasing productivity. Taking the behavior of aggregate demand as given, all these adaptive reactions of firms negatively affected employment generation. In turn, this would cause an increase in unemployment, thus affecting average real wages, as a negative correlation can be found between these two variables. The program also involved a complete opening to capital flows. At first, the size of capital inflows was very important in comparison with domestic financial aggregates. They fed aggregate demand and the economy started to growth fast. Therefore, GDP growth made possible the creation of new jobs, more intensely in non-tradable sectors, thus compensating the already mentioned negative effects of the exchange rate appreciation and the trade opening on employment creation. But from late 1992 onwards, and particularly after the 1995 recession triggered by the Tequila effect, a slower employment creation in non-tradable sectors added up to the negative trends observed in manufacturing, so that employment creation did not have the dynamism that would have been required for unemployment rates to return to pre-Tequila levels. As already stated, the two main guidelines in the conception of the Convertibility program were a strong emphasis in nominal stability, as the main macro policy target on one side, and total reliance on market mechanisms on the other. Launched in March 1991, The Convertibility program implied that monetary policy was given away almost completely. This was a result of the fixation of the exchange rate under a full opening of the economy to capital movements. The Convertibility Law also stipulated that the Central Bank had to back 100 percent of the monetary base with foreign currency reserves, and validated domestic contracts in foreign currencies. Moreover, to prevent fiscal dominance, strict limits were established to the credit of the Central Bank to the government. A new Chart of the Central Bank made it autonomous of the Executive in 1992, and also set narrow margins to its possibilities of purchasing public bonds and lending to commercial banks. Thus, monetary management was essentially confined to preserve nominal stability through the pegging of the nominal exchange rate. The stabilization program was jointly applied with a deep and extensive process of marketfriendly reforms. Most state-owned firms were privatized and many market regulations were removed. In practice, the Convertibility Law transformed the Central Bank into a currency board. This feature was essential in the new macroeconomic regime. In effect, the legal constraints on the Central Bank’s ability to autonomously manage the monetary base left. 3.
(14) domestic liquidity and credit almost fully dependent on the balance of payments results. The Central Bank’s reserve accumulation led to endogenous expansions of the monetary base and bank credit and fostered domestic demand. On the other hand, international reserves contractions automatically resulted in reductions of the monetary base and domestic credit, inducing a recession. In the spirit of the program, the evolution of real variables as the real exchange rate, interest rates, economic growth and aggregate employment were to be determined by market forces. The pro market policy environment and the attenuation of the economic uncertainty of the private sector under the new rules of the game would favor, it was expected, investment, productivity gains and growth. Furthermore, fiscal policy was not explicitly oriented to promote growth or employment. Particularly after the Asian crises of 1997, fiscal measures were also confined to preserve macroeconomic stability or, more precisely, to issue austerity “signals” aiming to reduce uncertainty among market participants. In other words, employment, along with real investment, economic growth and other real variables were not explicit targets of macro policy. Neither monetary, nor fiscal, nor exchange rate policy were devoted to those real targets, but to stabilize prices and create an environment supposedly favorable for private agents’ decisions in free markets. It was expected that these decisions would in turn result in an improved performance of all those variables. Moreover, with regard to employment, it is interesting to remark that, from 1994 onwards, when the economy started to show a disappointing performance, the main policy reaction was in the direction of “more market”, that is, less regulation: successive reforms were promoted trying to remove legal constraints to private labor contracts, thus pointing to a “more flexible” labor market 5 (see Box 1). The extreme rigidity of the Convertibility policy setting did not follow exclusively from the legal rules but also from the actual behavior of markets. For instance, the flexibility of the real exchange rate vis-à-vis negative external shocks would have required a significant downward flexibility of domestic non-tradable goods prices. Actually, no significant nominal deflation took place either in the 1995 recession or in the depression that followed the impact of the Asian crises, in spite of the observed significant flexibility of low-skilled wages and the measures taken to promote flexible contracts in the labor market.. 5. These measures had also the intention of contributing to make possible a nominal deflation of wages and prices when it became evident, particularly through the second half of the decade, that the peso was strongly appreciated and the exchange rate peg made impossible the correction of the problem through a nominal devaluation.. 4.
(15) Box 1 The evolution of the legal environment for labor contracts The structural reforms faced in Argentina during the nineties included changes in labor legislation. A new employment law was approved in 1991. Facing historically high unemployment rates, deeper reforms were introduced in 1995, 1998 and 2000. Following Maurizio et al. (2009), the most important changes in these norms during the nineties were the following: Inflation adjustment was not allowed, wages included; Social security contributions of employers were reduced; the process began in 1995 and implied a 40% average reduction of previous rates, with the purpose of partially compensate the negative effect of the exchange rate appreciation on firms’ profitability; Collective bargaining agreements regarding the working day regulation were authorized, as a mechanism to flexibilize the allocation of working time by firms, thus cutting average costs (by reducing extra hours of work); Part-time contracts were authorized, with lower firing and social security contributions costs in comparison with regular contracts (they were established in 1991 and their scope was widened with the normative changes sanctioned in 1995); In 1995 the test period was extended, under which there is no need to warn before laying off someone and social security charges for the employer are suppressed. The test period lasted for three months and could be extended to six months in small and medium size companies whether the clause was included in collective bargaining agreements. In 1998, the period was reduced to 30 days; still without social security contributions and the layoff costs could be cut by 50% whether the period extended to six months. In 2000, the duration went back to three months. Severance payments were reduced. The decision weighted more on those workers with less than two years in the companies. Before that, the seniority severance pay amounted to one month salary per working year or higher fraction of three months, using as a base the best monthly and regular wage. The amount couldn't be less than two months wage. From 1998, the seniority severance pay equaled the twelfth part of the best wage for each working month or fraction above ten days. The minimum was 2/12 of that remuneration. Changes after the crisis of the convertibility regime After the 2001-2002 crisis, some of these changes were reversed. In the beginning of 2002, when unemployment skyrocketed surpassing 21% of the active population, the National Economic Emergency Law suspended unjustified layoffs for 180 days and doubled the severance pay. Later on, in 2007, when unemployment went back to one digit rates, the severance pay returned to its previous level. In the 2000s a new legal framework for collective and individual labour relations was sanctioned; collective bargaining was promoted, actions were taken to recover the capacity of the state to the inspection of work conditions as well as its ability to mediate in labour conflicts. In 2004, a new labour law determined, among other changes: The maximum test period was reduced from six to three months; the employer was forced to warn 15 days in advance; and any extension of the test period was forbidden; The layoff severance pay reduction was abolished for those workers with less than two years in the workplace, except for learning contracts. The social security contributions made by companies with less than 80 workers received a special treatment, though only to those which increased the labour force; The system to register new workers was unified and simplified to reduce its complexity; Regarding the duration of collective agreements, which had been shortened by previous reforms, the principle of validity of the collective agreement until a new one replaced it was established. Moreover, higher level agreements (by sector of activity) prevail over lower level ones (at company level).. The real exchange rate was already significantly appreciated when the nominal exchange rate was pegged to the dollar, and this appreciated level would last throughout the nineties (see graph 2.2 and table 2.1).. 5.
(16) Graph 2.2. Multilateral real exchange rate (second semester 1986 = 1) 3,2. 2,8. 2,4. 2. 1,6. 1,2. 0,8. 0,4. 2010Q1. 2009Q1. 2008Q1. 2007Q1. 2006Q1. 2005Q1. 2004Q1. 2003Q1. 2002Q1. 2001Q1. 2000Q1. 1999Q1. 1998Q1. 1997Q1. 1996Q1. 1995Q1. 1994Q1. 1993Q1. 1992Q1. 1991Q1. 1990Q1. 1989Q1. 1988Q1. 1987Q1. 1986Q1. 0. Source: Authors’ elaboration based on Central Bank and ECLAC.. Balance of payments (four quarters m.a. in millions of dollars) 25,000. 20,000. 15,000. 10,000. 5,000. 0. -5,000. -10,000. -15,000. Current Account. Source: Authors’ elaboration based on Ministry of Economy.. 6. Net Capital Inflows. Reserve Variations. I 2008. I 2007. I 2006. I 2005. I 2004. I 2003. I 2002. I 2001. I 2000. I 1999. I 1998. I 1997. I 1996. I 1995. I 1994. -20,000 I 1993. Graph 2.3.
(17) Table 2.1. Multilateral real exchange rate, average per period (2nd semester of 1986 = 1) Period. Real exchange rate index. 1986-1998. 1,26. 1986-1990. 1,41. 1990:4 – 1991:1 (*). 0,73. 1991:2 – 1994:4 (*). 0,58. 1995 – 2001. 0,53. 2002. 1,12. 2003 – 2006. 1,08. 2007. 1,07. 2008. 0,95. 2009. 0,94. 2010 (**). 0,90. Source: Authors’ elaboration based on Central Bank and ECLAC. (*) Quarters (**) Average of the period January – August of the year.. Up to a certain point, the currency board mechanism played its intended role as an automatic stabilizer of the external accounts. A balance of payments deficit would cause a contraction in foreign reserves and domestic liquidity, thus causing a demand contraction, a fall in imports and a reduction of external deficit. However, under the Convertibility regime, even the deepest recessions left the current account with a substantial deficit. These features weighed on the negative side of international investors' perceptions and hence, the Argentine version of the currency board was far from dissipating the risk of default. Additionally, the volatility of the international financial conditions confronted by the country was mechanically transmitted to both domestic activity and employment levels. The correlation between national performance and the behavior of international capital markets is a common characteristic of emerging market economies, but in the Argentine case, the correlation was accentuated since the macroeconomic regime lacked any significant monetary and nominal flexibility to compensate for external impulses. The Argentine economy experienced two macroeconomic cycles of quite similar mechanics in the nineties. The stylized features of the cycle, as a general pattern, can be described synthetically as follows6: The cycle begins with an expansionary phase caused by capital inflows typically attracted by high interest rate differentials between local and foreign assets in contexts of credible fixed exchange rates. Foreign reserves accumulate (see graph 2.3), and domestic credit and aggregate demand expansions follow. Real exchange rate appreciation may emerge as a consequence of inflation generated by demand pressures and residual price increments (as a consequence of some lasting indexation. 6. Cycles of this kind have been experienced in several countries at different moments, in the period of financial globalization, under fixed exchange rates. A formal model of the cycle, inspired by the Argentine and Chilean experience in the late seventies and early eighties can be found in Frenkel (1983). English versions are presented in Taylor (1991 and 2004) and Williamson (1983). Asian and Latin American crises in the nineties are discussed and analyzed in this vein by Taylor (1998) and Frenkel (2003a).. 7.
(18) mechanisms, for instance). The current account worsens as a result of the increasing net imports flow caused by both the exchange rate appreciation and the demand expansion. The external financial needs rise and lead to debt accumulation. Consequently, the external vulnerability of the economy progressively increases. As the perceived risk rises, capital inflows tend to slow down and interest rates climb, pushed by the increases in both the country risk and the exchange risk premium. Reserves accumulation stops and a contraction begins. Higher interest rates and capital outflows give place to an illiquid financial scenario “à la Minsky” (1975). Moreover, the rise in the real interest rate, an endogenous consequence of increasing external fragility, sharpens the contraction of the economic activity, creating additional sources of financial distress. Finally, the exchange rate regime may collapse simultaneously with a financial crisis. The main stylized facts of this cyclical pattern were observed twice during the decade in Argentina. 7 The first cycle was between 1990 and 1995 (the year in which the economy was stalled by the spillover effects of the Mexican crisis), while the second one was between 1996 and 2001 (see the cycles of GDP in figure 1.1, and the cycles of the current account result and foreign reserves accumulation in graph 2.3). The first of these cycles would not end in an exchange-rate crisis, but it would lead to a recession and a financial crisis in 1995. It may be noted that the stabilization program was very effective in checking inflation. In the case of internationally tradable goods, for which the wholesale price index is a good approximate indicator, the inflation rate went down immediately to levels of the order of 1 percent per month (from about 6% on average in the second semester of 1990) and continued to go down later. 8 The consumer price index (CPI), in contrast, rose by 58.5% between the launching of the plan and December 1994. Although in this case, there was a sharp fall in the rate of inflation too, the residual inflation build-up in the first three years of the program was still very substantial. This is explained by the greater weight of nontradable goods and services (less affected by the pegging of the exchange rate) in the calculation of the CPI, and therefore reflects the change in relative prices over the period. The divergence between the variations of these two price indexes disappeared towards the end of 1994, however. From that time, and up to the final crisis of the macroeconomic regime in December 2001, monthly inflation rates always tended to be very close to zero, with a predominance of small negative figures. It is important to note that the real exchange rate, which had reached extraordinarily high levels during the stampede in the foreign exchange market, which set off the crises of hyperinflation in 1989 and 1990, dropped almost vertically in the course of the latter year. That is to say, before the launching of the convertibility plan (see graph 2.2 and table 2.1). As may be seen in the table, already in the period immediately before the launching of the stabilization plan, the multilateral real parity was almost 58 percent of its average level in 1986-1988 (that is, without considering the peaks of 1989-90). Since then, a long phase followed in which the variations in the real parity were comparatively minor, until the monetary regime broke down in December 2001.. 7. For an extensive treatment of this macroeconomic dynamic and the Convertibility crisis see Damill and Frenkel (2003). 8. This index registered a total variation of 12.5% from the beginning of the plan up to December 1994, which is slightly over 3 percent in annualized terms, in line with international inflation in the same period as measured, for example, by the United States CPI.. 8.
(19) The growth led by capital inflows in the early nineties continued up to late 1994. In that year, however, there was a rise in international interest rates (following the FED’s decision to increase its discount rates as from February). This began to affect the inflow of funds negatively and, because of the growing current account deficit, the foreign exchange reserves stopped growing. The rise in international interest rates in 1994 and its consequences for the inflow of capital and the inherent mechanics of the Convertibility regime could have by themselves led to an economic contraction. At the end of that year, however, Mexico suffered a run on the peso that ended in heavy depreciation. The effects immediately spread to Argentina. Consequently, instead of the country registering an endogenous adjustment in line with the typical workings of a currency board regime, the negative external shock led to a massive and rapid outflow of funds early in 1995, with a parallel and very marked rise in domestic interest rates. The stock of foreign exchange reserves went down abruptly and there was a corresponding contraction in liquidity. Aggregate demand behaved similarly bringing the economy to a recession. In this phase, the unemployment rate rose substantially and from then on it would remain at historically very high levels for more than a decade. Nevertheless, the recession in the middle of the decade was a short-lived one. A powerful set of external and domestic financial support measures, arranged with the collaboration of the International Monetary Fund (IMF), made it possible to change the negative tenor of expectations quickly. In addition, by various means, and in spite of the limitations imposed by the Convertibility rule (that were however respected), the government carried out intensive monetary activity designed to shore up the banks and thus stop the financial crisis from deepening. Thanks to the favorable effects of the financial support from abroad, it was possible to bring the monetary regime into being and towards the end of 1995; a new spell of expansion was beginning. The monetary mechanism behind this recovery was the same one observed in the early years of the 1990s: the access to external funds was gradually recovered; the inflow of capital began to exceed the current account deficit (which had gone down as a result of the recession), and the foreign exchange reserves recovered once again (see graph 2.3), as did the supplies of money and credit. The elements of the cyclical dynamic were again in motion. Whether this new expansionary phase had similar features to the previous one, it was shorter-lived. The country risk premium went up in mid-1997, after the Thai devaluation, and growth slackened. The Russian crisis in 1998 finally brought the period of expansion to an end. Private inflows of funds declined from then on, the accumulation of reserves slowed and became negative somewhat later. As a result, a new phase of contraction of GDP began in mid-1998 (see graph 2.1), culminating in the collapse of 2001-2002, in which, among many other events, there was a steep depreciation of the peso and the government defaulted on a large part of its external and domestic financial commitments.. Fiscal policy under the Convertibility setting The figures represented in graphs 2.5 and 2.6 help to concisely describe the aggregate fiscal performance in the nineties. During the first years of the Convertibility regime the public sector went through a significant adjustment in comparison with the historical performance of the country, reaching an almost balanced result around 1993. The primary surplus showed historical peaks in 1992-93, above 2% of GDP. Then, the recession triggered by the Tequila effect, combined with a negative fiscal effect of a pro-market reform of the pension system, led to a decline in the primary surplus and to a small aggregate deficit from 1994 on. But a more significant change would be observed as from the Asian crises of 1997. The unfavorable. 9.
(20) turn in the external financial situation after the Southeast Asian and Russian crises found Argentina with a high and growing current account deficit, an over-appreciated currency and an evident shortage of policy instruments for dealing with this set of problems, because of the rigidity of the macroeconomic policy framework adopted. Not surprisingly, in these conditions the country’s risk premium rose sharply (see graph 2.4) and remained high, while access to external funds became more and more problematical. Graph 2.4. Average country-risk premium for emerging market economies and for Argentina (1997:01 – 2001:06) 1600 1400 1200 1000 800 600 400 200 1997. 1998 EMBI. 1999. 2000. EMBIARG. Source: Ministry of the Economy, Argentina, from Bloomberg. Note: EMBI: Emerging Markets Bonds Index. From December 1997 on the series includes “External currency denominated Brady Bonds, Loans and Eurobonds, US dollar local market instruments”, that is, corresponds to the so called “EMBI+”. Figures before that data only include the first of the above mentioned component, thus corresponding to the EMBI. EMBIARG: Emerging Markets Bond Index-Argentina.. The rise in the country risk premium pushed interest rates strongly upwards. This had a negative impact on all debtors, including the public sector, in the form of an increased debt services’ burden. As can be seen in graph 2.6, the fiscal deficit tended to increase from 1997 on. A superficial consideration of these figures seems to support the view that an expansionary fiscal policy was a main factor leading to the crisis of 2001-2002 9, but a more careful look at the evidence shows that it was not. On the contrary, the fiscal stance became contractionary after the Asian crises, inasmuch as macro policy started to be dominated by the intention of the authorities to give “the right signals” of austerity to the private sector, as a way of favoring a decline in the country-risk premium and interest rates, severely affected by the contagion of the crises abroad.. 9. The questionable view that the macroeconomic unbalances that brought about the crisis had originated in fiscal mismanagement acquired wide acceptance, particularly among IMF officials. We analyzed and questioned this view in depth in several previous works. See for instance Damill and Frenkel (2003) and Damill, Frenkel and Rapetti (2005).. 10.
(21) The fact that fiscal policy became actually contractionary in the late nineties can be seen in the recovery of the primary surplus after 1996 (see graph 2.5). 10 Evidently, it is in the behavior of the interest services on the outstanding debt that the main explanation of the rising fiscal deficit has to be found. Graph 2.5. Primary result of the national public sector (% of GDP) 4,0. 3,0. 2,0. 1,0. 0,0. -1,0. -2,0. 2009. 2008. 2007. 2006. 2005. 2004. 2003. 2002. 2001. 2000. 1999. 1998. 1997. 1996. 1995. 1994. 1993. 1992. 1991. 1990. 1989. 1988. 1987. 1986. 1985. 1984. 1983. -3,0. Source: Ministry of Economy.. Graph 2.6. Aggregate financial surpluses by sector (% of GDP). Public Sector. 13. Private Sector. 9. External. 5. 1. -3. -7. -11 1993. 1994. 1995. 1996. 1997. 1998. 1999. 2000. 2001. 2002. 2003. 2004. 2005. 2006. 2007. 2008. 2009. 2010 (e). Source: Authors’ elaboration based on Ministry of Economy.. 10. Successive Argentine governments assumed that fiscal austerity measures would restore confidence, damaged by contagion of crises abroad, thus allowing for a decline in interest rates and a recovery of private investment and private expenditure in general. Moreover, this was the course of action emphatically recommended to the country by the multilateral organizations in Washington. It was expected that fiscal discipline would entail stronger confidence, and consequently the risk premium would fall bringing interest rates down. Therefore, a recovery of domestic expenditure would push the economic out of the recession making also possible a recuperation of employment and a reduction in unemployment. Lower interest rates and an increased GDP would, in turn, reestablish a balanced budget, thus closing a virtuous circle.. 11.
(22) The ‘confidence shock’ expected to revert those negative trends did not materialize in spite of the fiscal adjustment efforts. Moreover, the rounds of contractionary fiscal policies only reinforced the deflationary dynamics and the pessimistic expectations. Additionally, given that the improvement in the primary balance of the public sector accounts was not enough to compensate for an increased interest burden, the public deficit tended to grow, as we have already mentioned and can be seen in graph 2.6. Thus, public liabilities kept growing very fast.. The way to the crisis In addition to the deterioration of the foreign financial environment, Argentina suffered a series of real external shocks since 1997, including a strong fall in the average price of exports, a contraction in foreign demand for locally produced goods and an additional real appreciation caused for the strengthening of the US dollar and the strong Brazilian devaluation of 1999. These negative shocks added to the rise in the country’s risk premium, thus paving the way for a crisis. Under an increasingly difficult context and beyond deciding tax increases and expenditure cuts, the government also took some initiatives on the financial front, oriented to dissipate the expectations of a debt default. Since taking office in December 1999, De la Rúa’s government achieved three financial agreements with the IMF (see Box 2). It also launched two important ‘voluntary’ debt swaps in the second half of 2001. Notwithstanding that, the critical processes finally went on (i.e. the massive withdrawal of bank deposits and the contraction of international reserves). Furthermore, in December 2001 the government established hard restrictions on capital movements and on withdrawals of cash from banks (the so-called “corralito”). These measures aimed to avoid either the generalized bankruptcy of the banks or the violation of the currency board monetary rule, but their main objectives were to preserve the stock of reserves and avoid the devaluation (i.e. the formal abandonment of the convertibility regime). This was also the last drastic move attempting to prevent the default. Yet, these decisions did actually represent the end of the regime. The December 2001 measures contributed to deepen the already strong social and political tensions. After a few days of social unrest and political commotion, the country witnessed the resignation of the government followed by a series of ephemeral presidents. One of them announced to the Congress the decision of defaulting on a portion of the public debt, and resigned a few days later. In the first days of 2002, with a new president, Argentina officially abandoned the currency board regime and the one-to-one parity of the peso to the US dollar.. 12.
(23) Box 2 Argentina and the IMF in the nineties It is at first sight striking that the 2001-2002 crisis and the massive default in the last days of the Convertibility regime took place in a country that for a long time had been considered an outstanding example of the Washington Consensus success. Almost until the end of the nineties, the IMF and most financial market’s analysts considered the Argentinean experience as one of the most successful stories of macroeconomic policy and structural reforms in the financial globalization era. The clearly disappointing performance of the macroeconomic regime of the nineties regarding employment generation, unemployment and income distribution was, as usual, an almost completely missing issue in those evaluations. The default in Argentina took place one year after the IMF gave considerable support to sustain the Convertibility program in crisis. In August 2001, four months before the default, the IMF expanded by 8 billion dollars a current standby program and made a further disbursement. At that moment the development of the crisis was reaching its peak. The devaluation and the default were openly discussed (particularly in financial and academic circles in the United States) and there was a widespread opinion that the debt and the Convertibility regime were not sustainable. Assistance to Argentina was the last rescue package approved by the IMF during the period of the Clinton administration in the United States. For the critics of the IMF, all of the circumstances converged to make it an exemplary case. Actually, the support program openly showed weak flanks susceptible to criticism from its very conception. It did not involve any substantial change in the macroeconomic policy setting. In particular, the exchange rate regime was preserved. Besides the undeniable complexity and the difficulties that a regime change would have implicated, there was a complete lack of willingness to modify it among the authorities. Furthermore, from the IMF’s perspective, the preservation of the Convertibility setting was consistent with the systematic support of the exchange rate regime that the organization had provided throughout the nineties.. The labor market in the nineties With lower inflation rates and higher levels of economic activity, the initial achievements of the Convertibility program, had positive effects in the labor market in 1991-92. On the one hand, greater economic activity meant greater demand for labor. On the other, the decline in inflation reduced the negative impact of the “inflation tax”. Privatization and fiscal adjustment measures had, however, a negative punctual impact on employment. Furthermore, the joint impacts of trade openness and exchange rate appreciation have lasting adverse consequences for employment in the production of tradable goods, especially in the manufactures. We have already showed the intense initial exchange rate appreciation (graph 2.2). This is also reflected in the evolution of wages. The graph 2.7 shows different measures of average wages in the manufactures. In the case of wages measured in US dollars, the drastic increase at the beginning of the period must be noticed. Like it happened with the real exchange rate, the subsequent variations in the decade may be considered of second order of magnitude.. 13.
(24) Graph 2.7. Average real wages in the manufacture (deflated by CPI) and average wage in constant US dollars (second semester 1986 = 1) 1.600. 1.400. 1.200. 1.000. 0.800. 0.600. 0.400. Wage in constant US dollars. 2009Q1. 2008Q1. 2007Q1. 2006Q1. 2005Q1. 2004Q1. 2003Q1. 2002Q1. 2001Q1. 2000Q1. 1999Q1. 1998Q1. 1997Q1. 1996Q1. 1995Q1. 1994Q1. 1993Q1. 1992Q1. 1991Q1. 1990Q1. 1989Q1. 1988Q1. 1987Q1. 1986Q1. 0.200. Real Wage. Source: Authors’ elaboration based on INDEC and Central Bank.. Average wage in constant US dollars and unit labor costs in constant US dollars (first quarter of 1986=100) 160. 140. 120. 100. 80. 60. 40. 20. Wages in constant US dollars. Source: Authors’ elaboration based on INDEC and Central Bank.. 14. Unit labour costs in constant US dollars. 2009Q1. 2008Q1. 2007Q1. 2006Q1. 2005Q1. 2004Q1. 2003Q1. 2002Q1. 2001Q1. 2000Q1. 1999Q1. 1998Q1. 1997Q1. 1996Q1. 1995Q1. 1994Q1. 1993Q1. 1992Q1. 1991Q1. 0 1990Q1. Graph 2.8.
(25) Average wage and unit labor costs, measured in constant foreign currencies (first quarter of 1986=100)* 180.0. 160.0. 140.0. 120.0. 100.0. 80.0. 60.0. 40.0. 20.0. Average wage in constant foreign currencies. 2 0 0 9Q 1. 2 0 0 8Q 1. 2 0 0 7Q 1. 2 0 0 6Q 1. 2 0 0 5Q 1. 2 0 0 4Q 1. 2 0 0 3Q 1. 2 0 0 2Q 1. 2 0 0 1Q 1. 2 0 0 0Q 1. 1 9 9 9Q 1. 1 9 9 8Q 1. 1 9 9 7Q 1. 1 9 9 6Q 1. 1 9 9 5Q 1. 1 9 9 4Q 1. 1 9 9 3Q 1. 1 9 9 2Q 1. 1 9 9 1Q 1. 0.0 1 9 9 0Q 1. Graph 2.9. Unit labour cost in constant foreign currencies. Source: Authors’ elaboration based on INDEC and Central Bank. (*) The series have been expressed in terms of the value of the basket currency employed by the Central Bank to calculate the multilateral exchange rate.. Real wages in the manufactures, however, behaved very differently, which also reflected the process of exchange-rate appreciation. As the nominal prices of non-tradable goods and services rose considerably, and these goods and services weigh heavily in the CPI, wages deflated by this price index showed some initial decline and then a quite stable level during the decade. The adaptive reaction of firms to both the trade opening and the sudden and significant increase in wages measured in US dollars is reflected by a very important increment in labor productivity in the manufacturing sector, particularly in the first half of the decade. This can be clearly seen by comparison of the series included in graphs 2.8 or 2.9. The average wage in the manufacturing sector measured in US dollars (graph 2.8), increased very fast until mid 1995. However, the other series in the graph shows that the unit labor cost measured in the same currency remained almost constant between early 1991 and mid 1995. The divergence between the two series reflects a very strong increase in labor productivity. From then on, until the abrupt end of the Convertibility regime, both series in graph 2.8 follow a softly declining trend that mainly reflects the fact that the local inflation remained below US inflation. However, this late period looks very differently in graph 2.9, where wages are not measured in US dollars but in the “basket currency” employed by the Central Bank to estimate the multilateral exchange rate. Wages measured in the basket currency followed a rising trend from 1997 on as a result of the US dollar appreciation and, later on, of the Brazilian devaluation of 1999 (among other devaluations in trade partner countries). These changes surpassed the effect of inflation differentials. In the last days of Convertibility, wages measured in the basket currency were 65% higher than at its beginning in 1991. However, the unit labor costs in the industrial sector were almost the same that they had been at the start of the regime.. 15.
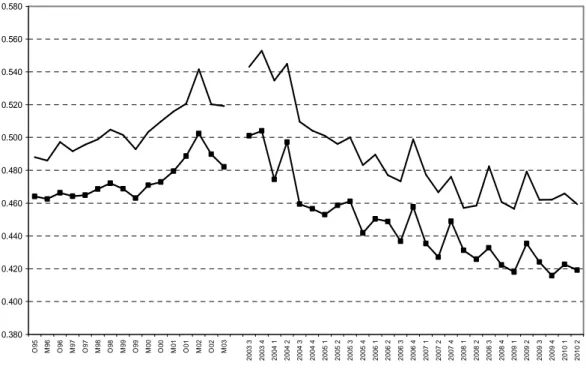
(26) We will now focus on the behavior of employment and unemployment in the nineties. The series analyzed below refer to the urban population and are taken from the Permanent Household Survey (PHS) 11, which the National Institute of Statistics and Censuses (INDEC) carried out twice a year, in May and October 12. Unless otherwise indicated, the series are defined as percentages of the total urban population. They are: participation rate, full-time employment rate 13, employment rate, involuntary underemployment rate, and unemployment rate. Graph 2.10 shows the evolution of these variables since the early 1980s. It may be observed, to begin with, that the full-time employment rate shows a marked downward trend, dropping from 35-36% in the early eighties to 32% in the first half of 1990 and to 27.6% in the second half of 2001. 14 In addition to this negative trend, this variable also displays a clear correlation with the macroeconomic cycle. As in the case of the gross domestic product (GDP), it displays two clear cycles in the 1990s. It goes up as from 1990, and then registers a pronounced fall, reaching its lowest point in 1996. It rises once again with the second period of expansion in the decade, but subsequently falls once more as from 1998.. 11. The PHS collects information on the labour market situation in the country's urban centers. The data available for the nineties corresponds to the Greater Buenos Aires (GBA) while only since 1995 the PHS collects comparable information for 28 urban centers. The GBA is the largest Metropolitan Area in Argentina with a population of more than 12 million, representing about 37% of the total urban population and 33% of the total population. Urban population represents around 90% of the total population in the country, thus, rural employment is a very small fraction of total employment. 12. The methodology and frequency of the PHS have recently been changed, as we will describe below. 13. In the survey, an individual is considered to be employed full time if he works at least 35 hours per week. This group also includes those who, although they worked less than 35 hours per week, do not wish to work more hours (i.e., this variable includes “voluntary underemployment”). 14. As in graph 2.10, in this section we have used half-year periods. Thus, the first half of the year corresponds to the survey carried out in May, while the second half corresponds to that carried out in October, so that 2000:1, for example, stands for the first half of 2000. Furthermore, in most cases in this section the % sign stands for “percentage points of the population”. However, whenever there may be any ambiguity, we use the expression “percentage points of the population” in full to refer to measurements of this nature.. 16.
(27) Graph 2.10 Labor market indicators: Participation rate, employment rate, employment rate excluding PJJHD, full employment rate excluding PJJHD (as % of total urban population) 48 Methodological change >>>. 44 40. Unemployment. 36 Involuntary underemployment. 32 28 24 1980. 1985. 1990. 1995 (1) (2). 2000. 2005. 2010. (3) (4). Source: Authors’ elaboration based on INDEC. (1) Participation rate; (2) Total employment rate; (3) Full-time employment rate; and (4) Full-time employment rate excluding PJJHD (“Plan Jefas y Jefes de Hogar Desocupados”).. The peak of the full-time employment rate in the period of expansion in the early 1990s was registered in the second half of 1992, well before the turning point in GDP observed at the end of 1994, after the Mexican crisis. It is actually a remarkable fact that in 1993 and 1994, when the economy was still expanding at a significant rate, the ratio between full-time jobs and the total population was already going down. Between the high point of 34.1% and the minimum observed in the second half of 1996, this rate fell by approximately 5.2%. It then recovered by about 2.4%, reaching a new peak in the first semester of 1998. It should be noted, however, that the latter value was well below the maximum attained in the previous period of expansion. The subsequent decline went along with the recessionary trend started in mid 1998, both in the period of moderate contraction, up to mid-2001, and in the sharp fall in activity that occurred in the second half of 2001. At that moment, close to the end of the regime, this rate was 6% below the level it had reached in the first half of 1991. The ratio between total employment and the population also showed a downward trend in the early 1990s, but this was considerably less pronounced than in the case of the full-time jobs, indicating that the rate of involuntary underemployment tended to rise in that same period. This increase became more marked in 1999-2000. Furthermore, the evolution of the involuntary underemployment rate was countercyclical: it tended to rise when the full-time employment rate fell, and to fall when the latter rose. As a consequence of this behavior of underemployment, a component of total employment, the evolution of the latter is less closely linked with the economic cycle than full-time employment.. 17.
Figure


+7


Documento similar
Rauhut (2014) The impact of ageing on regional employment: linking spatial econometrics and population projections for a scenario analysis of future labor
Given that there exists a stable demand-for-money function in Indonesia and that the monetary authorities have maintained some control over the money stock through policy
complex networks, and through computational modeling), sociology (through the field of social network analysis), and computer science (through the fields of data mining and
We study the dark nature of GRB 130528A through multi-wavelength observations and conclude that the main reason for the optical darkness is local extinction inside of the host
In the previous sections we have shown how astronomical alignments and solar hierophanies – with a common interest in the solstices − were substantiated in the
Through first-person soma design, an approach that draws upon the designer’s felt experience and puts the sentient body at the forefront, we outline a comprehensive work for
Financial decision-making should be based on the level of economic development, guided by the goal of macroeconomic development, and ensure the realization of
In this work, the Spanish labor market was analyzed through the labor force survey (EPA) from a gender perspective, demonstrating the existing inequalities at the labor level,
