Structural characterization of protein isolates obtained from chia (Salvia hispanica L ) seeds
32
0
0
Texto completo
(2) ACCEPTED MANUSCRIPT. “Structural characterization of protein isolates obtained from chia (Salvia. 1. hispanica L.) seeds”. 2 3. López, Débora Nataliaa, Ingrassia, Rominaa,b, Busti, Pabloc, Bonino, Juliad, Delgado, Juan. 5. Franciscoe, Wagner, Jorgee, Boeris, Valeriaa,d*, Spelzini, Daríoa,d.. RI PT. 4. 6. a. 7. y Farmacéuticas, Universidad Nacional de Rosario (UNR) - CONICET. Suipacha 531,. 8. Rosario, Argentina.. 9. b. SC. Área Fisicoquímica, Departamento de Química Física. Facultad de Ciencias Bioquímicas. M AN U. Facultad de Ciencias Veterinarias, Universidad Nacional de Rosario (UNR). Ovidio. 10. Lagos y Ruta 33, Casilda, Argentina.. 11. c. 12. Bioquímicas y Farmacéuticas, Universidad Nacional de Rosario (UNR). 13. d. 14. Pellegrini 3314, Rosario, Argentina.. 15. e. 16. Roque Sáenz Peña 352, B1876BXD Bernal, Buenos Aires, Argentina.. TE D. Facultad de Química e Ingeniería del Rosario, Pontificia Universidad Católica Argentina.. Departamento de Ciencia y Tecnología, Universidad Nacional de Quilmes -CONICET.. EP. 17. Área Tecnología de los Alimentos, Departamento de Tecnología. Facultad de Ciencias. *Corresponding Author:. 19. Dra. Valeria Boeris. 20. Facultad de Ciencias Bioquímicas y Farmacéuticas. Universidad Nacional de Rosario –. 21. CONICET. Suipacha 531. (S2002RLK) Rosario. Argentina.. 22. e-mail: valeriaboeris@conicet.gov.ar. AC C. 18. 23. 1.
(3) ACCEPTED MANUSCRIPT. Abstract. 25. Chia protein isolates (CPI) were obtained through isoelectric precipitation under. 26. two different conditions in order to compare their structural properties. Extraction was. 27. carried out at pH 10 or 12, whereas precipitation pH was fixed at 4.5. Samples were named. 28. as CPI10 or CPI12, according to their extraction pH (10 or 12, respectively). The recovery. 29. of chia proteins was higher when the extraction was carried out at pH 12 (17% for CPI12. 30. and 13% for CPI10); however, CPI12 protein content (775g/kg) was slightly lower than. 31. CPI10 protein content (782g/kg). Both samples showed similar SDS-PAGE pattern. Protein. 32. dispersions of both isolates led to highly stabilized particles due to their negative ζ potential. 33. (around -54 mV). CPI10 has a higher proportion of small particles in suspension, revealed. 34. by a lower d3,2 value. Spectroscopic techniques showed that CPI10 presented higher content. 35. of β-helix than CPI12, resulting in higher thermal stability. This observation was supported. 36. by FT-IR spectroscopy since CPI10 presented less unordered structure than CPI12. The. 37. energy of endotherms obtained in CPI12 was considerably lower than in CPI10. Extraction. 38. at higher alkaline conditions led to a more denatured protein conformation with a higher. 39. content of random structure (18.1% for CPI10 and 22.9% for CPI12).. 40. KEYWORDS: vegetable protein; alkaline extraction; thermal stability; spectroscopic. 41. characterization. AC C. EP. TE D. M AN U. SC. RI PT. 24. 2.
(4) ACCEPTED MANUSCRIPT. 1.. Introduction. 43. Salvia hispanica L., commonly referred to as chia, is an annual plant from the. 44. Lamiaceae family, native from Mesoamerica. Apart from corn, bean and amaranth, chia. 45. was one of the most important crops for the pre-Columbian people (Ayerza & Coates,. 46. 2005). Increasing attention is now being paid to chia seed composition, since it is a good. 47. source of natural antioxidants, proteins and dietary fiber, besides its high content of. 48. unsaturated fatty acids (da Silva Marineli et al., 2014). Present research is directed to taking. 49. advantage of this natural source of oil, since chia seeds contain the highest proportion of. 50. omega-3 known up to date in plant seeds (Ixtaina, Nolasco, & Tomás, 2008). Moreover,. 51. there is a growing interest in the mucilage obtained after chia seeds hydration to elaborate. 52. edible coatings and films (Capitani et al., 2015; Dick et al., 2015; Muñoz, Cobos, Diaz, &. 53. Aguilera, 2012; Velázquez-Gutiérrez et al., 2015).. M AN U. SC. RI PT. 42. Although the high protein content of this pseudocereal makes it attractive to explore. 55. and understand the structure, function and health benefits of these proteins, chia proteins. 56. have received scant attention.. TE D. 54. Different methods of oil extraction from chia seeds have been studied by Capitani et. 58. al. (2012). They reported that meal products, obtained after oil extraction by pressing,. 59. showed a high percentage of proteins and could be included in human diets and balanced. 60. with other sources of amino acids.. AC C. 61. EP. 57. The food industry has a growing interest in producing plant protein isolates not only. 62. due to their increasing use as food functional additives but also because they may also. 63. improve nutritive quality and functional properties of food products (Lqari, Vioque,. 64. Pedroche, & Millán, 2002). Protein-rich fractions, protein isolates and concentrates offer. 3.
(5) ACCEPTED MANUSCRIPT. 65. interesting functional properties, which are usually superior to those of the flour source. 66. (Vázquez-Ovando, Betancur-Ancona, & Chel-Guerrero, 2013). Isoelectric precipitation is the traditional and most common method used to extract. 68. proteins from plant sources. A protein extraction procedure from defatted seed flour. 69. consists mainly in the solubilization of proteins in diluted alkali (pH ranging from 8 to 11),. 70. followed by its isoelectric precipitation in diluted acid (usually near pH 4.5-5) (Rodrigues,. 71. Coelho, & Carvalho, 2012). Although some studies precipitated chia proteins at their. 72. isoelectric pH (pH 3) (Olivos-Lugo, Valdivia-López, & Tecante, 2010; Timilsena, Wang,. 73. Adhikari, & Adhikari, 2016), it has been reported that the minimum of solubility is. 74. reached at pH 4, suggesting that a change in the precipitation pH could improve the. 75. recovery yield of chia proteins (Vázquez-Ovando et al., 2013).. M AN U. SC. RI PT. 67. Proteins may be induced to suffer important structural changes because of alkali and. 77. acid treatments during extraction. In fact, the isolation procedure influences the yield,. 78. degree of unfolding and functional properties of extracted proteins (López, Galante,. 79. Robson, Boeris & Spelzini, 2017). Therefore, the study of the isolation conditions is. 80. important to diminish undesirable effects (Abugoch, Romero, Tapia, Silva, & Rivera,. 81. 2008). Structural and functional properties of protein isolates from other pseudocereals. 82. have already been studied under different combinations of isolation and precipitation pHs. 83. (Abugoch et al., 2008; Salcedo-Chávez, Osuna-Castro, Guevara-Lara, Domínguez-. 84. Domínguez, & Paredes-López, 2002). Even though chia protein extraction was performed. 85. by Olivos-Lugo et al. (2010), the effect of the extraction conditions on the structural. 86. properties of the isolates has not yet been evaluated.. 87 88. AC C. EP. TE D. 76. The aim of the present work was to study the effect of different isolation conditions on the physicochemical, structural and thermal properties of chia protein isolates (CPI). 4.
(6) ACCEPTED MANUSCRIPT. 89. 2.. Materials and Methods. 91. 2.1.. Materials. 92. Commercial milled and partially defatted chia seeds (MCS) were purchased from. 93. RI PT. 90. Sturla S.R.L. (Buenos Aires, Argentina). All chemicals used were of analytical grade. 2.2.. Methods. 95. 2.2.1. Protein isolation. 96. Structural properties of CPI obtained under different extraction conditions were. 97. studied. The effect of mucilage removal, the alkali pH for protein extraction (8, 10 or 12). 98. and the acidic pH used for the isoelectric precipitation (3 or 4.5) were evaluated.. M AN U. SC. 94. Protein isolation was performed according to Timilsena et al. (2016), with some. 100. modifications. Briefly, MCS were dispersed in distilled water (50 g/L), and stirred for 30. 101. min to ensure that the mucilage became swollen due to water absorption.. TE D. 99. In order to remove the mucilage, samples were centrifuged for 15 min at 10000 g.. 103. The mucilaginous intermediate phase was discarded. The upper liquid phase and the lower. 104. solid phase obtained after centrifugation were recovered and mixed.. EP. 102. For protein extraction, the pH of the slurry was adjusted to 8, 10 or 12 with 1 mol/L. 106. NaOH and stirred for 1 h. The supernatant was recovered by centrifugation (15 min at 1000. 107. g) and the pH was adjusted to 3 or 4.5 with 1 mol/L HCl. After centrifugation under the. 108. same conditions, chia proteins were recovered in the precipitate and suspended in alkali at. 109. the corresponding pH of extraction. This procedure ensured the solubilization of the. 110. maximum amount of protein extracted. Finally, samples were freeze-dried.. 111. AC C. 105. 2.2.2. Recovery yields and protein quantification. 5.
(7) ACCEPTED MANUSCRIPT. 112. Recovery yields (%) were calculated as gram of isolate obtained per gram of MCS. 113. for each experimental condition. The protein content of both CPI was determined by the. 114. Kjeldahl procedure (AOAC, 1970), using a conversion factor of 6.25. 2.2.3. Electrophoretic pattern. 116. The electrophoretic pattern of both CPI was determined according to the Laemmli. 117. method (1970) by sodium dodecyl sulfate-polyacrilamide gel electrophoresis (SDS-PAGE).. 118. Gel electrophoresis was carried out in a SDS-Tris-Glycine discontinuous buffer system (80. 119. g/L stacking gel, 130 g/L resolving gel). Aqueous samples of chia proteins obtained after. 120. the suspension in alkali at the corresponding pH were mixed with sample buffer containing. 121. 2-mercaptoethanol. Electrophoresis was performed at a constant current intensity of 25 mA.. 122. Gels were stained with Coomasie brilliant blue R.. M AN U. SC. RI PT. 115. 2.2.4. Particle size distribution of chia proteins. 124. The effect of the isolation conditions on the particle size distribution of CPI was. 125. studied by laser diffraction, using a Malvern Mastersizer 2000E analyzer (Malvern. 126. Instruments, Malvern, UK). A wet dispersion unit was associated (Hydro 2000MU,. 127. Malvern Instruments, Malvern, UK), setting the pump speed at 2000 rpm. Dispersions from. 128. CPI were prepared at 30 g/L, in buffer Tris-HCl 100 mmol/L. Particles were assumed to. 129. have a relative refractive index of 1.4 and the adsorption coefficient was fixed at 0.1.. 131. EP. AC C. 130. TE D. 123. 2.2.5. ζ potential of chia protein isolates The ζ potential of CPI dispersed in distilled water (0.2 g/L) was determined from. 132. their electrophoretic mobility, using a Nano Particle Analyzer Horiba SZ-100 (Horiba Ltd.,. 133. Kyoto, Japan).. 134. 2.2.6. Thermogravimetric analysis. 6.
(8) ACCEPTED MANUSCRIPT. Samples of CPI were heated from room temperature to 800 °C in order to determine. 136. both thermogravimetric (TG) and derivative thermogravimetric (DTG) curves. All these. 137. analysis were conducted in a TGA Q500 (TA Instruments, Delaware, USA), selected. 138. heating rate was 10 ºC/min under a flow of high purity nitrogen gas (60 mL/min).. RI PT. 135. 2.2.7. Structural properties of chia protein isolates. 140. Spectroscopic techniques are simple strategies that provide clear information about. 141. protein structure. However, it may be important to point out that none of these simple. 142. methods provides a complete characterization of protein structure. As a result, different. 143. spectroscopic techniques have been employed in this work to evaluate possible changes in. 144. the structural properties of chia proteins due to the isolation conditions.. M AN U. SC. 139. 2.2.7.1.. 146. CPI were dispersed in distilled water at 0.6 g/L in order to obtain homogeneous. 147. diluted dispersions so that the inner filter effect was avoided. All fluorescent measurements. 148. were carried out at 25 °C on an Aminco Bowman spectrofluorometer Series 2000 (Thermo. 149. Electron Scientific Instruments Corporation, Madison, WI USA), using a thermostatized. 150. quartz cell of 1 cm path length. Intrinsic fluorescence spectra of CPI were determined,. 151. fixing the excitation wavelength at 290 nm. The emission spectra were recorded from 300. 152. to 400 nm.. 154. EP. AC C. 153. Intrinsic fluorescence spectroscopy. TE D. 145. 2.2.7.2.. Circular dichroism. Secondary structure elements of proteins have optical activity that enables us to. 155. study the structure of proteins. Far UV circular dichroism (CD) spectra of CPI were. 156. recorded at room temperature with a JASCO J500 spectropolarimeter (JASCO International. 157. Co., Tokyo, Japan). Dispersions from CPI were prepared in distilled water at 0.2 g/L and. 158. poured into a quartz cuvette of 0.1 cm path length. The spectra were obtained in the range 7.
(9) ACCEPTED MANUSCRIPT. 159. from 200 to 350 nm and represented the average of five consecutive scans. The. 160. composition (%) of α-helix, β-sheet, turns and unordered structures of both CPI were. 161. calculated with the CDPro analysis software and the CONTIN program. 2.2.7.3.. 163. Fourier transformed infrared spectroscopy is useful to study the structure and. 164. Fourier transformed infrared spectroscopy. RI PT. 162. stability of proteins in a wide variety of environments.. Infrared spectra were measured at room temperature in a Shimadzu IR-Affinity-. 166. 1 infrared spectrophotometer (Shimadzu Co., Duisburg, Germany). The freeze-dried. 167. powder was analyzed by using GladiATR monolithic diamond crystal accessory (Pike. 168. Technology, Madison, USA). For each spectrum, measurement conditions were set as. 169. follows: number of scans: 45, resolution: 4 cm-1, wavenumber range: 400 to 4000 cm-1,. 170. apodization: Happ-Genzel. Environmental background was measured before each sample. 171. was assayed. In order to analyze protein conformation, deconvolution from the original. 172. absorbance spectra was calculated.. TE D. M AN U. SC. 165. 2.2.7.4.. 174. An aliquote (10-15 mg) of dispersions (200 g/kg in distilled water) was hermetically. 175. sealed in coated standard aluminum pans. Thermograms were obtained at a 10 ºC/min. 176. heating rate in a range of 10-150 ºC using a DSC Q200 calorimeter (TA Instruments, New. 177. Castle, USA). An empty pan was used as reference. The peak temperature (Tp, ºC) of. 178. endothermic peaks and specific and total denaturation enthalpy (∆H, J/g dry matter) were. 179. obtained from thermogram analysis.. 180. Differential scanning calorimetry. AC C. EP. 173. 2.3.. Statistical analysis. 8.
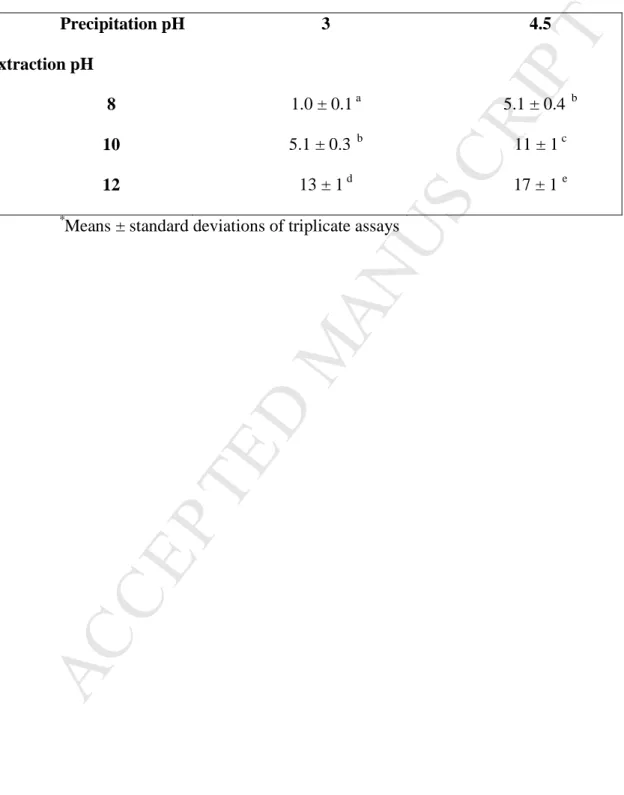
(10) ACCEPTED MANUSCRIPT. All determinations were made at least in triplicate. The effect of the extraction. 182. conditions of chia proteins on the structural properties studied was determined by means of t-. 183. tests. Normality and equal variance assumptions were tested before performing parametric. 184. tests. Significant differences were analyzed by means of p-values (p<0.05).. 185. RI PT. 181. 3.. Results and Discussion. 187. 3.1.. Recovery yields and protein quantification. 188. As previously mentioned in Section 2.2.1, chia proteins were isolated under different conditions, which are briefly described in Table 1.. M AN U. 189. SC. 186. 190. Table 1. 191. Although Olivos-Lugo et al. (2010) have reported that the best precipitation pH was. 193. 3, precipitation at pH 4.5 resulted in higher recovery yields. Because of the fact that. 194. extraction at pH 8 resulted in very low yields, this condition was discarded for further. 195. analysis. Thus, solubilization was performed at pH 10 and 12 whereas the precipitation pH. 196. was fixed at 4.5. Samples were referred to as CPI10 and CPI12, respectively.. EP. TE D. 192. Table 2 shows that the protein content of both CPI resulted to be near 800 g/kg.. 198. Similar protein contents (from 758 to 834 g/kg) have been previously reported by Salcedo-. 199. Chávez et al. (2002) for amaranth isolates obtained by isoelectric precipitation under. 200. different experimental conditions.. 201. AC C. 197. Abugoch et al. (2008) have obtained quinoa protein isolates at high pH extraction (9. 202. or 11), which results in protein contents of 772 and 835 g/kg, respectively. They attributed. 203. the noticeable increase in protein content to the higher extraction capacity of the more. 204. alkaline medium. This fact has not been evidenced in the CPI obtained in this work. 9.
(11) ACCEPTED MANUSCRIPT. 205. Furthermore, even higher protein contents have been reported for quinoa protein isolated. 206. from different varieties (Steffolani et al., 2015). Environmental conditions as well as genetic variability influence the nutritional. 208. composition of vegetable seeds (Ayerza, 1995). As a result, protein isolates result in. 209. different protein contents, making the comparison among them difficult.. 210. SC. Table 2. 211. RI PT. 207. 212. 3.2.. 214. The electrophoretic pattern of both CPI were determined by SDS-PAGE under. 215. Electrophoretic pattern. reducing conditions (Fig. 1).. M AN U. 213. Fig. 1). 216. Both samples showed a similar protein profile with a large number of protein bands.. 218. The intensity of bands corresponding to CPI12 was higher than the intensity of bands. 219. corresponding to CPI10 due to the larger extent of the extraction at pH 12. The bands at the. 220. top of the stacking and separation gels indicate polymerized protein due to isopeptide bond. 221. formation (Diftis & Kiosseoglou, 2003).. EP. AC C. 222. TE D. 217. Although the SDS-PAGE pattern of each fraction of chia proteins was previously. 223. studied by other authors, the polypeptides are difficult to identify since there is overlapping. 224. between proteins corresponding to each fraction. According to Sandoval-Oliveros &. 225. Paredes-López (2012), bands which exhibited approximately 30 and 20 kDa correspond to. 226. the acidic and basic units of 11S globulins, respectively. These results are based on a. 227. previous study which reported that 11S globulin has a hexameric conformation whose 10.
(12) ACCEPTED MANUSCRIPT. monomers are resolved under reducing conditions into acidic and basic subunits. The. 229. glutelin fraction is also known to correspond to bands of about 20-30 kDa. However,. 230. considering that bands shown in Fig. 1 presented high intensity, and the fact that the 11S. 231. globulin is known to be a major component in CPI (Sandoval-Oliveros & Paredes-López,. 232. 2012) protein bands of about 20-30 kDa shown in the SDS-PAGE may correspond to the. 233. globulin fraction.. RI PT. 228. Moreover, both profiles presented bands of low intensity that are consistent with the. 235. presence of proteins with low molecular weight (lower than 18 kDa), which probably. 236. correspond not only to the globulin and glutelin fraction but also to the albumin fraction. 237. (González-Pérez & Arellano, 2009).. M AN U. SC. 234. Considering a previous report that mentioned the low resolution of the prolamins. 239. (Sandoval-Oliveros & Paredes-López, 2012), this fraction is not expected to be identified in. 240. our electrophoretic pattern.. TE D. 238. 3.3.. 242. The particle size distribution of CPI10 and CPI12 samples in solution showed that. 243. samples are polydispersed (data not shown). Both isolates presented a clear unimodal. 244. distribution biased to higher sizes. The d3,2 value, which represents the average size based on the specific surface per. AC C. 245. Particle size distribution of chia proteins. EP. 241. 246. unit volume, proved to be lower in CPI10 (p<0.0001). As this parameter better. 247. characterizes small and spherical particles, their average size proved to be lower when. 248. proteins were extracted at pH 10. Similar results were obtained when comparing d4,3 values,. 249. being higher for CPI12 (p=0.00078). As a result, large particles showed higher average size. 250. when extracted at extreme alkaline conditions (Table 2).. 251. 3.4.. ζ potential of chia protein isolates 11.
(13) ACCEPTED MANUSCRIPT. Surface charge of proteins is mainly attributed to surface or near surface ionizable. 253. groups. ζ potential also reflects the degree of electrostatic stabilization among the colloid. 254. particles, which strongly influences functional properties such as solubility and emulsifying. 255. properties. ζ potential of both samples proved to be highly negative, as a result of the great. 256. negative repulsion among protein particles, without significant differences between them. 257. (p=0.5582) (Table 2). Timilsena et al. (2016) have also found similar values for their. 258. samples. Slightly less negative ζ potential values (near -40 mV) have been obtained for. 259. protein suspensions of amaranth prepared in deionized water (Shevkani, Singh, Rana, &. 260. Kaur, 2014). Surface charge of proteins is strongly influenced by ionic strength, which. 261. accounts for the differences observed among ζ potentials determined in different media.. M AN U. SC. RI PT. 252. 262. 3.5.. 263. The TG and DTG plots shown in Fig. 2 reveal that three stages take place during the pyrolysis process of CPI.. TE D. 264. Thermogravimetric analysis. 265 266. Fig. 2). Moisture was released at first, before attaining 100 °C. Slight weight loss (of near. 268. 25 g water/kg isolate) was measured in both samples and could be due to dehydration, i.e.. 269. the release of free water or water loosely bound to biomolecules (Rizzo, Prussi, Bettucci,. 270. Libelli, & Chiaramonti, 2013), indicating that both samples probably exhibit similar water. 271. absorption capacities.. AC C. EP. 267. 272. Both DTG plots highlight that the main volatilization peak appears near 300 °C.. 273. This second stage was characterized by major weight loss, at a higher rate. Most of the. 274. volatiles were released at this stage and are mainly attributed to protein degradation and in. 12.
(14) ACCEPTED MANUSCRIPT. a minor degree to carbohydrate degradation (Peng, Wu, & Tu, 2001). A significantly higher. 276. second peak was obtained for CPI10. As the pyrolysis of biomass is a complex reaction that. 277. involves a large number of reactions in parallel and in series, shoulder peaks may be. 278. distinguished in both second peaks from DTG plots.. RI PT. 275. Further weight loss resulted in the third stage due to slow decomposition of the solid. 280. residue from the previous step. The solid residue of CPI12 reached an asymptotic value. 281. during this stage. From this value, the total residue was estimated to be 243.4 g/kg and. 282. included the ash content and unpyrolyzed char. This was not observed for CPI10, as solid. 283. residue decomposition was not completed, suggesting that this isolate is likely to be more. 284. stable to pyrolysis.. 285. 3.6.. 286. 3.6.1. Intrinsic fluorescent spectroscopy. 287. Intrinsic fluorescence spectra of soluble proteins of CPI10 and CPI12 are shown in. M AN U. TE D. 289. Fig. 3 A.. Structural properties of chia protein isolates. Fig. 3). EP. 288. SC. 279. Both isolates showed a spectrum with a broad peak, the maximum emission being. 291. near 340 nm. These results are related to the maximum emission wavelength reported for. 292. quinoa, amaranth and soy (Abugoch et al., 2008; Clara Sze, Kshirsagar, Venkatachalam, &. 293. Sathe, 2007; Valenzuela, Abugoch, Tapia, & Gamboa, 2013). As the maximum wavelength. 294. of fluorescence emission was above 335 nm, most of the tryptophan residues in both. 295. isolates may be solvent-exposed (Chen, Edelhoch, & Steiner, 1969). However, the emission. 296. spectra obtained from CPI10 showed a higher intensity at lower wavelength when. 297. compared to the spectrum obtained from CPI12. This may indicate the presence of. AC C. 290. 13.
(15) ACCEPTED MANUSCRIPT. 298. fluorophores still buried in the protein. These differences may result from the extraction. 299. procedures, which could cause higher exposition of the tryptophan residues, situating it. 300. closer to the protein surface when the extraction was carried out at pH 12. 3.6.2. Circular dichroism. 302. Fig. 3 B shows the far UV-CD spectra from CPI10 and CPI12. The secondary. 303. structure composition of both samples was determined as explained in Section 2.3.2. and. 304. the results obtained are shown in Table 2.. SC. RI PT. 301. Both samples showed high contents of ordered structures after the isolation. 306. procedure under alkali and acid conditions. The content of ordered structures in CPI10 and. 307. CPI12 proved significantly higher than that reported for buckwheat globulins. 308. (approximately 70 %) (Choi & Ma, 2007).. 310. The extraction of the proteins at higher alkali pH increased the random structure: CPI12 had higher random coil than CPI10.. TE D. 309. M AN U. 305. 3.6.3. Fourier transformed infrared spectroscopy. 312. FT-IR is a useful tool for determining secondary structure of proteins based on. 313. infrared bands in the amide I and III regions (Cai & Singh, 1999). Slight changes in the. 314. wavenumber of protein isolates may result from differences in functional groups, amino. 315. acid composition and interactions among them (Kudre, Benjakul, & Kishimura, 2013).. AC C. 316. EP. 311. FT-IR spectra of both CPI are shown in Fig. 4A. The main changes in CPI12 in. 317. comparison with CPI10 were observed in amide III region and were very clear in. 318. deconvoluted spectra (Fig. 4B). According to Cai and Singh (1999), bands in the range. 319. 1200-1251 cm-1 correspond to β-sheet; in the range 1263-1292 cm-1, to unordered; and in. 320. the range 1300-1321 cm-1, to α-helix structures (Chen et al., 2013; Kudre, Benjakul, &. 14.
(16) ACCEPTED MANUSCRIPT. Kishimura, 2013). Fig. 4B reflected differences in the secondary structure of chia proteins. 322. between both CPIs: CPI10 contained more β-sheet and α-helix conformations and less. 323. unordered structure than CPI12. The ratio between sums of absorbances related to β-sheet. 324. divided by sums of absorbances related to unordered structures decreased from 1.2 in. 325. CPI10 to 0.9 in CPI12 whilst the respective ratio between unordered and α-helix structures. 326. increased from 1.0 to 1.1 (Shevkani et al., 2014). This fact may be attributed to the gradual. 327. unfolding of protein tertiary structure when extracted at higher alkali pH (Chen et al.,. 328. 2013).. M AN U. Fig. 4). 329. SC. RI PT. 321. 330. 3.6.4. Differential scanning calorimetry. 331. The thermal characterization of CPI10 and CPI12 has been performed by. 332. differential scanning calorimetry.. Endothermic peaks were observed in both CPI thermograms (Figure 5), in. 334. agreement with the need for energy for protein denaturation. Moreover, the fact that. 335. thermograms of both isolates showed three peaks is probably because of the presence of. 336. more than one protein species.. EP. TE D. 333. In CPI10, two principal endothermal peaks were encountered at 57 ± 3 and 105 ± 4. 338. °C. The first thermal transition, which ranged from 45 to 68 °C is likely to correspond to. 339. the prolamin fraction and the second peak was possibly due to the destabilization of the. 340. structure of the glutelin and globulin fractions (Olivos-Lugo et al., 2010). In this sample,. 341. other lower overlapped transitions were observed in the range 80-90ºC, which could be. 342. probably attributed to the denaturation process of the albumin and glutelin fractions,. 343. respectively (Sandoval-Oliveros & Paredes Lopez, 2012). The total enthalpy associated. AC C. 337. 15.
(17) ACCEPTED MANUSCRIPT. with these events was 4.0±1.9 J/g (dry basis). In CPI12, three minor endothermic. 345. transitions were also observed (78, 94 and 112ºC). Unlike CPI10, a great exothermic. 346. change of baseline was detected at 51 °C. This exotherm could be associated with an. 347. aggregation process of previous denatured proteins (Fitzsimons, Mulvihill & Morris, 2007,. 348. Marshall & Zarins, 1989, Lohner & Esser, 1991). The energy of endotherms obtained in. 349. CPI12 was considerably lower than in CPI10, 0.7±0.5 J/g (dry basis). The thermal stability. 350. of chia proteins seems to be affected by the extraction at pH 12, resulting in more denatured. 351. chia proteins.. SC. RI PT. 344. Nevertheless, in the case of CPI10, the extraction procedure was not as extreme as. 353. the one reported for quinoa proteins extracted at pH 11 which showed no endotherm peaks. 354. (Abugoch et al., 2008). CPI10 showed moderate thermal protein denaturation, suggesting. 355. that they are suitable for food product formulations undergoing heat treatments whereas. 356. CPI12 presented a higher extent of denaturation.. 359. TE D. 358. 4. Conclusions. Chia proteins were extracted through isoelectric precipitation and the effect of the extraction at pH 10 or 12 was thus analyzed.. EP. 357. M AN U. 352. The study of functional properties is of great importance during food processing.. 361. Since functional properties are known to strongly depend on protein conformation, the. 362. structure of the chia protein extracted have been therefore assessed.. 363. AC C. 360. The recovery yields of the isolation procedure as well as the protein content of both. 364. CPI obtained in this work were similar to other vegetable protein isolates and appropriate to. 365. their use as food additives. Considering our results, the extraction procedure modified the. 366. structural properties of chia proteins, which may cause differences in some functional. 367. properties. Even if both isolates presented a high content of ordered structure (α-helix, β16.
(18) ACCEPTED MANUSCRIPT. sheet and turns), CPI10 was composed by proteins with a higher ordered structure, whereas. 369. CPI12 resulted in a higher degree of unfolding of chia proteins. Despite this, both CPI. 370. showed a moderate thermal stability, suggesting that they are suitable for food products. 371. undergoing heat treatments.. 373. Due to their protein conformation, both isolates probably exhibit different functional properties, making them appropriate for different food formulations.. SC. 372. RI PT. 368. Acknowledgments. 375. The authors would like to thank the English Area of Facultad de Ciencias. 376. Bioquímicas y Farmacéuticas, UNR, for the language correction of the manuscript. Débora. 377. N. López, Romina Ingrassia and Juan Francisco Delgado are research awardees of. 378. CONICET, Argentina. This work was supported by grants from Agencia Nacional de. 379. Promoción Científica y Tecnológica (PICT 2014-1571) and from Universidad Nacional de. 380. Rosario (1BIO430).. 383 384 385 386 387. 5.. References. Abugoch, L. E., Romero, N., Tapia, C. A., Silva, J., & Rivera, M. (2008). Study of some. AC C. 382. EP. 381. TE D. M AN U. 374. physicochemical and functional properties of quinoa (Chenopodium quinoa Willd) protein isolates. Journal of Agricultural and Food Chemistry, 56, 4745-4750.. AOAC. (1990). In W. Horwitz (Ed.), Official analytical methods of analysis. (17th ed.). Washington, D.C., USA: Association of Oficial Analitical Chemists.. 17.
(19) ACCEPTED MANUSCRIPT. 388. Ayerza, R. (1995). Oil content and fatty acid composition of chia (Salvia hispanica L.). 389. from five northwestern locations in Argentina. Journal of the American Oil. 390. Chemists' Society, 72, 1079-1081.. 392. Ayerza, R., & Coates, W. (2005). Ground chia seed and chia oil effects on plasma lipids. RI PT. 391. and fatty acids in the rat. Nutrition Research, 25, 995-1003.. Cai, S., & Singh, B. R. (1999). Identification of β-turn and random coil amide III infrared. 394. bands for secondary structure estimation of proteins. Biophysical Chemistry, 80, 7-. 395. 20.. M AN U. SC. 393. 396. Capitani, M., Corzo-Rios, L., Chel-Guerrero, L., Betancur-Ancona, D., Nolasco, S., &. 397. Tomás, M. (2015). Rheological properties of aqueous dispersions of chia (Salvia. 398. hispanica L.) mucilage. Journal of Food Engineering, 149, 70-77. Capitani, M., Spotorno, V., Nolasco, S., & Tomás, M. (2012). Physicochemical and. 400. functional characterization of by-products from chia (Salvia hispanica L.) seeds of. 401. Argentina. LWT-Food Science and Technology, 45, 94-102.. TE D. 399. Clara Sze, K., Kshirsagar, H. H., Venkatachalam, M., & Sathe, S. K. (2007). A circular. 403. dichroism and fluorescence spectrometric assessment of effects of selected chemical. 404. denaturants on soybean (Glycine max L.) storage proteins glycinin (11s) and β-. AC C. 405. EP. 402. conglycinin (7s). Journal of Agricultural and Food Chemistry, 55, 8745-8753.. 406. Chen, J., Chen, X., Zhu, Q., Chen, F., Zhao, X., & Ao, Q. (2013). Determination of the. 407. domain structure of the 7S and 11S globulins from soy proteins by XRD and FTIR.. 408. Journal of the Science of Food and Agriculture, 93, 1687-1691.. 18.
(20) ACCEPTED MANUSCRIPT. 409. Chen, R.F., Edelhoch, H., & Steiner, R.F. (1996) Fluorescence of proteins. In S. Leach. 410. (Ed.), Physical Principles and Techniques of Protein Chemistry, Part A. (pp. 217–. 411. 231). New York: Academic Press. Choi, S.M., & Ma, C.Y. (2007). Structural characterization of globulin from common. 413. buckwheat (Fagopyrum esculentum Moench) using circular dichroism and raman. 414. spectroscopy. Food Chemistry, 102, 150-160.. RI PT. 412. da Silva Marineli, R., Moraes, É. A., Lenquiste, S. A., Godoy, A. T., Eberlin, M. N., &. 416. Maróstica Jr, M. R. (2014). Chemical characterization and antioxidant potential of. 417. chilean chia seeds and oil (Salvia hispanica L.). LWT-Food Science and. 418. Technology, 59, 1304-1310.. M AN U. SC. 415. Dick, M., Costa, T. M. H., Gomaa, A., Subirade, M., de Oliveira Rios, A., & Flôres, S. H.. 420. (2015). Edible film production from chia seed mucilage: effect of glycerol. 421. concentration on its physicochemical and mechanical properties. Carbohydrate. 422. Polymers, 130, 198-205.. TE D. 419. Diftis, N., & Kiosseoglou, V. (2003). Improvement of emulsifying properties of soybean. 424. protein isolate by conjugation with carboxymethyl cellulose. Food Chemistry, 81, 1-. 425. 6.. EP. 423. Fitzsimons, S. M., Mulvihill, D. M., & Morris, E. R. (2007). Denaturation and aggregation. 427. processes in thermal gelation of whey proteins resolved by differential scanning. 428. AC C. 426. calorimetry. Food Hydrocolloids, 21, 638-644.. 429. González-Pérez, S., & Arellano, J. B. (2009). Vegetable protein isolates. In G. O. Phillips,. 430. & P. A. Williams (Eds.), Handbook of Hydrocolloids. (pp. 383-419). Cambridge:. 431. Woodhead Publishing Ltd.. 19.
(21) ACCEPTED MANUSCRIPT. 432 433. Ixtaina, V. Y., Nolasco, S. M., & Tomás, M. C. (2008). Physical properties of chia (Salvia hispanica L.) seeds. Industrial Crops and Products, 28, 286-293. Kudre, T. G., Benjakul, S., & Kishimura, H. (2013). Comparative study on chemical. 435. compositions and properties of protein isolates from mung bean, black bean and. 436. bambara groundnut. Journal of the Science of Food and Agriculture, 93, 2429-2436.. 437. Laemmli, U. K. (1970). Cleavage of structural proteins during the assembly of the head of bacteriophage T4. Nature, 227, 680-685.. SC. 438. RI PT. 434. Lohner, K., & Esser, A. F. (1991). Thermal unfolding and aggregation of human. 440. complement protein C9: a differential scanning calorimetry study. Biochemistry, 30,. 441. 6620-6625.. M AN U. 439. 442. López, D. N., Galante, M., Robson, M., Boeris, V., & Spelzini, D. (2018). Amaranth,. 443. quinoa and chia protein isolates: physicochemical and structural properties.. 444. International Journal of Biological Macromolecules, 109,152-159. Lqari, H., Vioque, J., Pedroche, J., & Millán, F. (2002). Lupinus angustifolius protein. 446. isolates: chemical composition, functional properties and protein characterization.. 447. Food Chemistry, 76, 349-356.. EP. TE D. 445. Marshall, W. E., & Zarins, Z. M. (1989). Exothermic transitions of glycinin determined by. 449. differential scanning calorimetry. Journal of Agricultural and Food Chemistry, 37,. 450. 451 452. AC C. 448. 869-873.. Muñoz, L., Cobos, A., Diaz, O., & Aguilera, J. (2012). Chia seeds: microstructure, mucilage extraction and hydration. Journal of Food Engineering, 108, 216-224.. 453. Olivos-Lugo, B., Valdivia-López, M., & Tecante, A. (2010). Thermal and physicochemical. 454. properties and nutritional value of the protein fraction of mexican chia seed (Salvia. 455. hispanica L.). Food Science and Technology International, 16, 89-96. 20.
(22) ACCEPTED MANUSCRIPT. 456. Peng, W., Wu, Q., & Tu, P. (2001). Pyrolytic characteristics of heterotrophic Chlorella. 457. protothecoides for renewable bio-fuel production. Journal of Applied Phycology,. 458. 13, 5-12. Rizzo, A. M., Prussi, M., Bettucci, L., Libelli, I. M., & Chiaramonti, D. (2013).. 460. Characterization of microalga Chlorella as a fuel and its thermogravimetric. 461. behavior. Applied Energy, 102, 24-31.. RI PT. 459. Rodrigues, I. M., Coelho, J. F., & Carvalho, M. G. V. (2012). Isolation and valorisation of. 463. vegetable proteins from oilseed plants: methods, limitations and potential. Journal. 464. of Food Engineering, 109, 337-346.. M AN U. SC. 462. Salcedo-Chávez, B., Osuna-Castro, J. A., Guevara-Lara, F., Domínguez-Domínguez, J., &. 466. Paredes-López, O. (2002). Optimization of the isoelectric precipitation method to. 467. obtain protein isolates from amaranth (Amaranthus cruentus) seeds. Journal of. 468. Agricultural and Food Chemistry, 50, 6515-6520.. TE D. 465. Sandoval-Oliveros, M. R., & Paredes-López, O. (2012). Isolation and characterization of. 470. proteins from chia seeds (Salvia hispanica L.). Journal of Agricultural and Food. 471. Chemistry, 61, 193-201.. 473 474 475. Shevkani, K., Singh, N., Rana, J. C., & Kaur, A. (2014). Relationship between physicochemical. AC C. 472. EP. 469. and. functional. properties. of. amaranth. (Amaranthus. hypochondriacus) protein isolates. International Journal of Food Science & Technology, 49, 541-550.. 476. Steffolani, M. E., Villacorta, P., Morales-Soriano, E., Repo-Carrasco, R., León, A. E., &. 477. Perez, G. T. (2015). Physico-chemical and functional characterization of protein. 478. isolated from different quinoa varieties (Chenopodium quinoa Willd). Cereal. 479. Chemistry, 93, 275-281. 21.
(23) ACCEPTED MANUSCRIPT. 480. Timilsena, Y. P., Wang, B., Adhikari, R., & Adhikari, B. (2016). Preparation and. 481. characterization of chia seed protein isolate–chia seed gum complex coacervates.. 482. Food Hydrocolloids, 52, 554-563. Valenzuela, C., Abugoch, L., Tapia, C., & Gamboa, A. (2013). Effect of alkaline extraction. 484. on the structure of the protein of quinoa (Chenopodium quinoa Willd.) and its. 485. influence on film formation. International Journal of Food Science & Technology,. 486. 48, 843-849.. SC. RI PT. 483. Vázquez-Ovando, A., Betancur-Ancona, D., & Chel-Guerrero, L. (2013). Physicochemical. 488. and functional properties of a protein-rich fraction produced by dry fractionation of. 489. chia seeds (Salvia hispanica L.). CyTA-Journal of Food, 11, 75-80.. M AN U. 487. Velázquez-Gutiérrez, S. K., Figueira, A. C., Rodríguez-Huezo, M. E., Román-Guerrero, A.,. 491. Carrillo-Navas, H., & Pérez-Alonso, C. (2015). Sorption isotherms, thermodynamic. 492. properties and glass transition temperature of mucilage extracted from chia seeds. 493. (Salvia hispanica L.). Carbohydrate Polymers, 121, 411-419.. EP. 495. AC C. 494. TE D. 490. 22.
(24) ACCEPTED MANUSCRIPT. Figure captions. 497. Figure 1. Sodium dodecyl sulfate-polyacrilamide gel electrophoresis under. 498. reducing conditions. Lane 1: molecular weight marker. Lane 2: chia protein isolates. 499. obtained by extraction at pH 10 (CPI10). Lane 3: chia protein isolates obtained by. 500. extraction at pH 12 (CPI12). Acid and basic subunits of the 11S globulins are indicated. 501. with arrows.. SC. RI PT. 496. Figure 2. A) Thermogravimetric analysis of chia protein isolate extracted at pH 10. 503. (____) and 12 (- - - -). Heating rate was 10 ºC/min under a flow of high purity nitrogen gas. 504. (60 mL/min). B) Derivative thermogravimetric (DTG) curves from chia protein isolate. 505. extracted at pH 10 (____) and 12 (- - - -).. M AN U. 502. Figure 3. A) Fluorescence emission spectra exciting at 290 nm of chia protein. 507. isolate extracted at pH 10 (____) and 12 (- - - -). Samples were dispersed in distilled water at. 508. 0.6 g/L. B) Circular dichroism spectra in the far ultraviolet region of chia protein isolate. 509. extracted at pH 10 (____ ) and 12 (- - - -). Samples were dispersed in distilled water at 0.2. 510. g/L. Temperature was fixed at 25 °C in both assays.. EP. TE D. 506. Figure 4. A) Fourier transformed infrared (FT-IR) spectra of chia protein isolate. 512. extracted a pH 10 (____) and pH 12 (- - - -).The freeze-dried powder was analyzed by using. 513. GladiATR monolithic diamond crystal accessory. B) Deconvoluted FT-IR spectra in the. 514. amide III region.. AC C. 511. 515. Figure 5. Thermograms of aqueous dispersions (200 g/kg in distilled water) of chia. 516. protein isolates extracted at pH 10 (CPI10) or pH 12 (CPI12) obtained by differential. 517. scanning calorimetry. 23.
(25) ACCEPTED MANUSCRIPT. Table 1: Recovery yields (%) of chia proteins after the extraction from partially milled defatted chia seeds in alkali and the precipitation in acid*. Values followed by the same letter are not significantly different (p < 0.05). 3. 4.5. RI PT. Precipitation pH Extraction pH. 1.0 ± 0.1 a. 10. 5.1 ± 0.3. 12. 13 ± 1 d. 5.1 ± 0.4. SC. b. Means ± standard deviations of triplicate assays. AC C. EP. TE D. M AN U. *. 8. 11 ± 1 c. 17 ± 1 e. b.
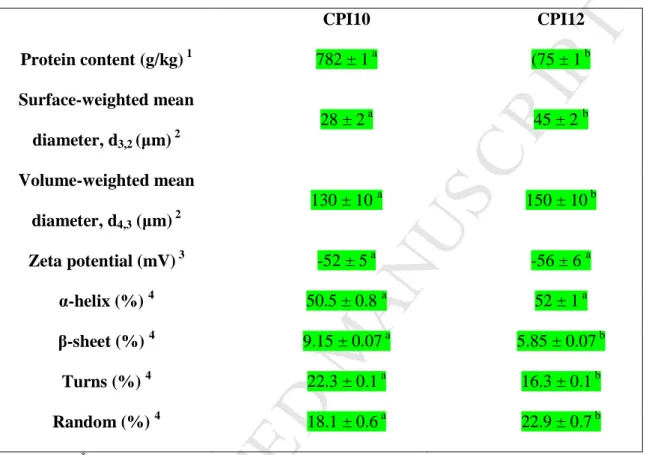
(26) ACCEPTED MANUSCRIPT. Table 2: Physicochemical and structural characteristics of the chia protein isolates (CPI) obtained by extraction at pH 10 (CPI10) or pH 12 (CPI12) *. Means in the same row followed by the same letter are not significantly different (p < 0.05).. 782 ± 1 a. Protein content (g/kg) 1 Surface-weighted mean. 28 ± 2 a. 130 ± 10 a. M AN U. diameter, d4,3 (µm) 2 Zeta potential (mV) 3 α-helix (%) 4 β-sheet (%) 4. -56 ± 6 a. 50.5 ± 0.8 a. 52 ± 1 a. 9.15 ± 0.07 a. 5.85 ± 0.07 b. 22.3 ± 0.1 a. 16.3 ± 0.1 b. 18.1 ± 0.6 a. 22.9 ± 0.7 b. Means ± standard deviations of triplicate assays. Determined by Kjeldhal;. 2. determined by laser diffraction of a suspension 30 g CPI / L. EP. 1. 150 ± 10 b. -52 ± 5 a. TE D. Turns (%) 4. *. 45 ± 2 b. 2. Volume-weighted mean. Random (%) 4. (75 ± 1 b. SC. diameter, d3,2 (µm). CPI12. RI PT. CPI10. buffer Tris-HCl 100 mmol/L;. AC C. suspension of CPI 0.2 g/L;. 4. 3. determined by electrophoretic mobility in an aqueous. Secondary structure composition determined by circular. dichroism of an aqueous suspension of CPI 0.2 g/L..
(27) AC C. EP. TE D. M AN U. SC. RI PT. ACCEPTED MANUSCRIPT.
(28) AC C. EP. TE D. M AN U. SC. RI PT. ACCEPTED MANUSCRIPT.
(29) AC C. EP. TE D. M AN U. SC. RI PT. ACCEPTED MANUSCRIPT.
(30) AC C. EP. TE D. M AN U. SC. RI PT. ACCEPTED MANUSCRIPT.
(31) AC C. EP. TE D. M AN U. SC. RI PT. ACCEPTED MANUSCRIPT.
(32) ACCEPTED MANUSCRIPT. Highlights Chia proteins were extracted better at pH 12 than at pH 10 or 8 Chia proteins extracted at pH 12 form larger aggregates than those extracted at pH 10. AC C. EP. TE D. M AN U. SC. Extraction at pH 10 led to proteins with higher thermal stability. RI PT. Chia proteins extracted at pH 10 presented a more ordered conformation.
(33)
Figure
Documento similar
Abstract: Transepidermal water-loss (TEWL), stratum-corneum hydration (SCH), erythema, elas- ticity, pH and melanin, are parameters of the epidermal barrier function and
No obstante, como esta enfermedad afecta a cada persona de manera diferente, no todas las opciones de cuidado y tratamiento pueden ser apropiadas para cada individuo.. La forma
– Spherical Mexican hat wavelet on the sphere software (developed by the Observational Cosmology and Instrumentation Group at
dsDNA viral packaging; portal protein; T7 bacteriophage; structural biology; X-ray crystallography; cryo-electron
teriza por dos factores, que vienen a determinar la especial responsabilidad que incumbe al Tribunal de Justicia en esta materia: de un lado, la inexistencia, en el
43 Add 200 µL of the fresh alkylation solution to the gel pieces in the sample P tube and incubate the P tube in the dark at room temperature for 30 min.. After 30 min of
The Dwellers in the Garden of Allah 109... The Dwellers in the Garden of Allah
The aim of this study was to evaluate the effect of the application of humic acids (HA) extracted from vermicompost of domestic waste, at three different concentrations, on
