Anthropogenic Particles Study of Chihuahua Mexico, Morphology and Elemental Composition
14
0
0
Texto completo
(2) individual aerosol anthropogenic particles with techniques measure off-line, such as TEM/EDS, in ten industrial production processes located in Chihuahua, City. We focus on the aerosol around 1.0 μm and investigate changes in their morphology and composition elemental. To our knowledge, this is the first TEM/EDS study on aerosols anthropogenic particle from specific sources in Chihuahua City, México. In this paper we summarized about shape factor theory and fractal dimension. In Experimental section defined procedures for sampling particles; image acquisition; and treatment and analysis image. We show statistical analysis for shape factors and elemental composition.. METHODS The electronic microscopy images studies, where grayscale images are obtained and segmented to binary images, for obtained area and perimeter to determined shapes factors and sizes. There are a variety shape factors, which provide specific information about particulate matter, such as irregular, compactness, rounded, texture and homogeneity. The methods are based on a region or edge of the particle 13. Generally this shape factors are referenced to a Euclidean geometric figures known as a rectangle or circle. For Example, the circularity compactness is the ratio between area A and perimeter P squared for each object, It value means if the region is compact or non-compact; the 1.0 value indicates a perfect circle and if the value approaches 0.0, it indicates an increasingly elongated shape particle 13,14. The regular shape particle have a higher thinness ratio than similar irregular shape particle ones. The inverse relation is roundness ratio and reflects the complexity of the object boundary 15,16. Other parameters are fractal dimension and lacunarity, these terms introduced by Mandelbrot 17. They describe rough or texture (consisting of wave and rough), it depends on the observed property; the perimeter fractal dimension describes roughness; the density fractal dimension reports how is filled in spaces characteristic 18 ; and the Lacunarity is a measurement of invariant translational, it means measurement of the non-uniformity of structure o the degree of structural variance within an object 19,20. There are different ways to report the particle size. Mostly the diameter is reported in the literature, which relates properties of perimeter, area or rectangular border region. Here we report the diameter of Feret; it defines as the distance between pairs of parallel tangents to the projected outline of the particle in some fixed direction 15,21.. EXPERIMENTAL Zone description The city of Chihuahua is situated in the northern part of the Mexican Republic; this city is capital of the Chihuahua State, geographically located at 28° 39' north latitude and 106° 05' west longitude. It has a population of around 748,518 inhabitants; there are seven industrial parks with more than 80 industrial plants, mainly in the manufacturing sector (metal products, machinery and equipments) 22. It has an average annual temperature of 18.2°C with maximum and minimum average 37.7 ºC and -7.4 ºC respectively, semiarid extreme climate with annual. 2.
(3) average relative humidity of 49% and the annual average wind East-North-east 23. To the North it limits with Chihuahua-Sacramento Valley, to the East with the Sierra Nombre de Dios, to the West and South with the mountains the “Blue” and The “Mogote”, to the Northeast with a portion of the Tabalaopa-Aldama Valley, bounded by the mountains: “Nombre de Dios” by the West, “Gloria Peña Blanca” by the East 23. The maps are shows in Figures 1a, 1b and 1c.. Monitoring site The ten selected process is locates in The Industrial Park: “Chihuahua”, “America” and “Intermex-Aeropuerto” at latitude and longitude 28°42'57.91" N and 106°7'59.94" W; 28°39'6.63" N and 106°7'28.93" W; and 28°40'1.55" N and 106°0'14.83" W, respectively. The Figure 1d shows industrial park location. Figure 1. Sampling site locations; (a) Map of the Mexican Republic in the World; (b) Map of Chihuahua State in the Mexican Republic; (c) Map of Chihuahua State; and (d) Site locations.. Heraldry. Sample Collection The samples were obtained between June and December of 2009. The schedule was from 08:30 to 09:30 a.m. The sample collection times were around 20 minutes conditioned on the particle concentrations directly from the sampling port in the air shaft. The Eight Stage-Non-Viable cascade-Impactor model Mark-II New-Star-Environmental™ was used and Cooper TEM grids (200-mesh) with carbon-coated Formvar films were placed in stages with cut-off diameters of 1.1, 0.7 and 0.4 μm on polycarbonate filters. This equipment was operated at flow rate 28 l/min.. TEM/EDS analyses The TEM grids were observed and analyzed using high resolution TEM model CM-200 Phillips™, whose point resolution is approximately 2Åworking at 200 kV. The TEM images were acquired at different magnifications using CCD-digital camera with 640x480 pixels. For each process, we selected individual particle and this were quantified elemental composition by X-ray energy dispersive technique EDS. The TEM/EDS microanalyser was operated at accelerating voltage of 200 kV, and the counting time of the X-ray spectrum was 30s. The relative elemental weight percentages were obtained and normalized 11,12,24.. 3.
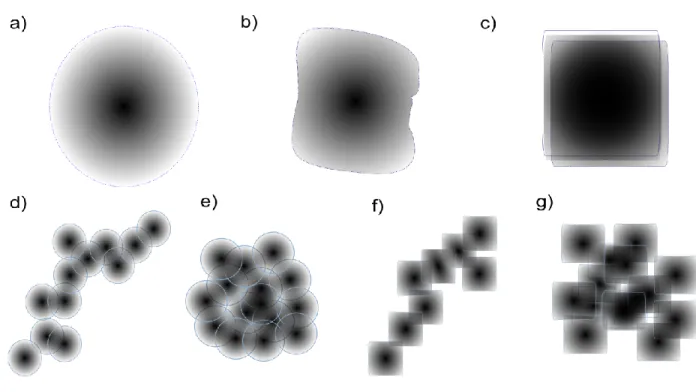
(4) Treatment and Analysis of Image ImageJ software of National Institute of Health, USA 25 was used for treatment and analysis of our images. The treatment consists as a first step to improve intensity, following sequence equalization of the histogram, Gaussian filter and finally sharpen 26,27; the second step is the recognition of objects, by segmentation for manual sliding threshold to obtain binary image; the third step is the elimination of noise and waste, applying morphological image processing 27. The analyses consist of obtaining projected properties. These were grouped into macroscopic and microscopic properties. The macroscopic property is roundness(R) and microscopic properties perimeter and density fractal dimension (Dp and Dm), perimeter and density lacunarity (L) and finally size with the diameter of Feret (dF).. About Particles Classification Different shapes of material particulate from air shaft were classified. The individual particles analyzed were classified into groups based on their morphology: aggregates, irregular, spherical, cubic and other. Figure 2 shows finding morphologies and arrays. Figure 2. Different shape morphologies; (a) Spherical; (b) Irregular; (c) Cubic; (d) Chain Aggregates; (e) Compact Aggregates; (f) Cubic aggregates; (g) Compact cubic aggregates. 4.
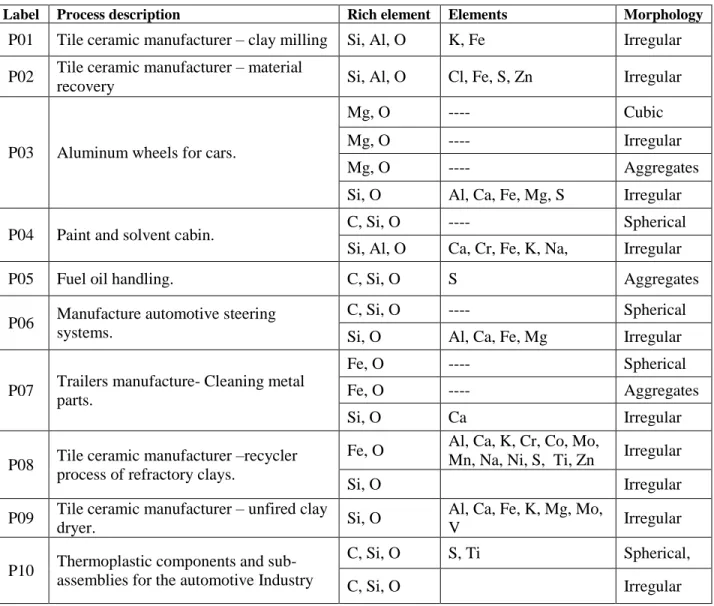
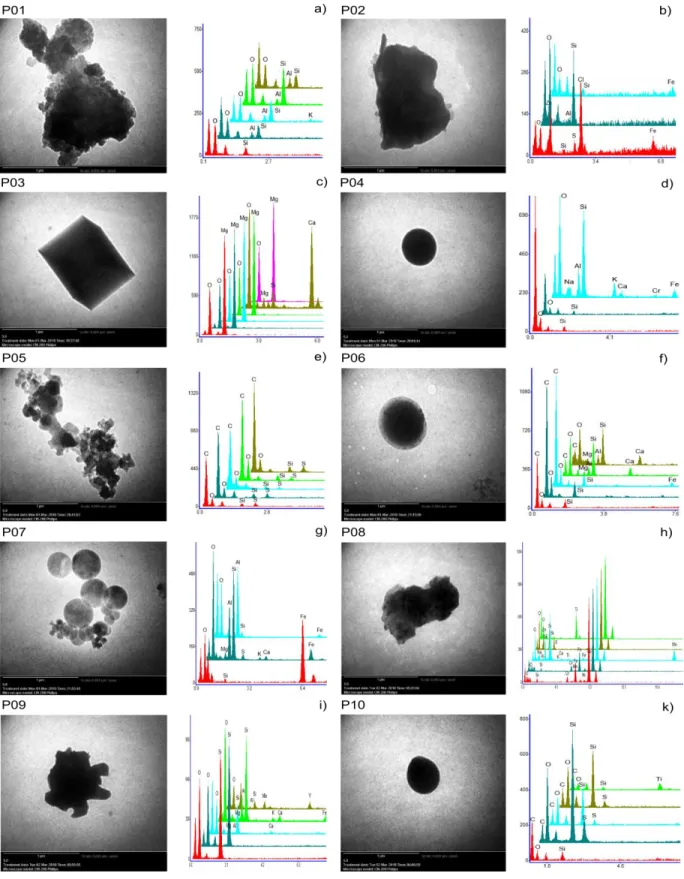
(5) RESULTS AND DISCUSSION TEM/EDS analyses The elemental composition analyses of single particles were done by TEM/EDS for all collected samples. They were 96 spectrums and it allowed the identification of 22 elements (Al, C, Ca, Cl, Co, Cr, Fe, K, Mg, Mn, Mo, Na, Ni, O, P, S, Si, Sn, Ti, V and Zn). Almost all particles were oxidized. The particles from P01, P02, P08 and P09 presented rich-Si and Al elements, otherwise from P04, P06 and P10 showed C, Si and Al rich elements and finally, P03, P05 and P07 exhibited Mg-rich, Al, C and Fe elements, respectively. The Table 1 shows a brief description and label to identify each process during this work; at the same time it contains elements and morphology types. Table 1. Elemental composition of anthropogenic particles Label. Process description. Rich element. Elements. Morphology. P01. Tile ceramic manufacturer – clay milling. Si, Al, O. K, Fe. Irregular. P02. Tile ceramic manufacturer – material recovery. Si, Al, O. Cl, Fe, S, Zn. Irregular. Mg, O. ----. Cubic. Mg, O. ----. Irregular. Mg, O. ----. Aggregates. Si, O. Al, Ca, Fe, Mg, S. Irregular. C, Si, O. ----. Spherical. Si, Al, O. Ca, Cr, Fe, K, Na,. Irregular. P03. Aluminum wheels for cars.. P04. Paint and solvent cabin.. P05. Fuel oil handling.. C, Si, O. S. Aggregates. P06. Manufacture automotive steering systems.. C, Si, O. ----. Spherical. Si, O. Al, Ca, Fe, Mg. Irregular. Fe, O. ----. Spherical. P07. Trailers manufacture- Cleaning metal parts.. Fe, O. ----. Aggregates. Si, O. Ca Al, Ca, K, Cr, Co, Mo, Mn, Na, Ni, S, Ti, Zn. Irregular. P08. Tile ceramic manufacturer –recycler process of refractory clays.. P09. Tile ceramic manufacturer – unfired clay dryer.. P10. Thermoplastic components and subassemblies for the automotive Industry. Fe, O Si, O. Irregular Irregular. Si, O. Al, Ca, Fe, K, Mg, Mo, V. Irregular. C, Si, O. S, Ti. Spherical,. C, Si, O. Irregular. 5.
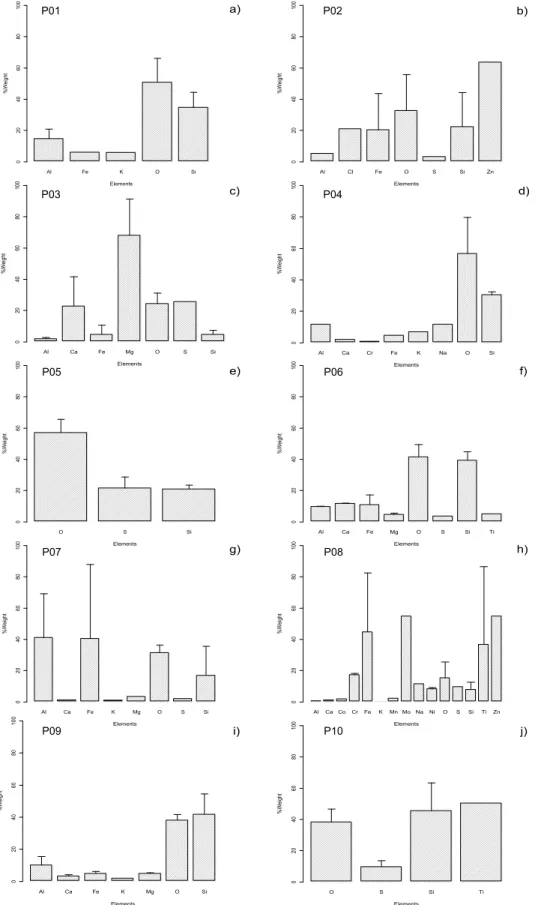
(6) Si-Rich All process presented silicate particles. The P01, P02, P08 and P09 are process of dedicated to manufactured tile ceramic. These materials come from clay, and it is container mica, quartz, feldspar. The principal compounds are aluminum silicate, calcium silicate, with elements such as Ca, Cl, Fe, K, Mg, Mn, Na, Ni and Zn, and in minor quantities Co, Cr y Ti. The presence of these elements in the rest process P03, P04, P05, P06 and P10, can be consider such as contamination from dust soil. The Figures 3a, 3b, 3h and 3i shows mean bar chart plot with distribution of element and the Figure 4a, 4b, 4h and 4i shows predominant particle morphology and EDS analyze spectrum. C -Rich The processes involved in the manufacture of automotive parts, such as application of paint, solvents and fuels management (P04, P05, P06 and P10), respectively, shows particles container rich-C. We cannot quantify this element, because the membrane support of particles was made by formvar. These particles contain elements such as Ti and majority S, first used in the manufacture of pigments and the second comes from the cracking of petroleum. The Figures 3d, 3e and 3j shows mean bar chart plot with distribution of element and the Figures 4d, 4e and 4j shows predominant particle morphology and EDS analyze spectrum. Mg and Al Rich The process P03 dedicated to the manufacture of automotive parts from aluminum-based, presents Mg and Al rich particles. These processes use fluxes for melting aluminum, consist of a mixture from chloride and fluoride salts. The principally purpose of these materials are used to lower the melting point and eliminate slag, minimize penetration of atmospheric hydrogen, silicon modify inclusions in alloys containing silicon and oxidize excessive magnesium in fusion process. The Figure 3c shows mean bar chart plot with distribution of element and the Figure 4c shows predominant particle morphology and EDS analyze spectrum. Fe- Rich The process P06 dedicated to cleaning metal parts (sand-blast), showed Fe-rich and particles and majority Si, from the surface to be cleaned and abrasive. The abrasive blasting or sand-blast is the operation of forcibly propelling a stream material against from surface under high pressure to clean, smooth a rough surface. Figure 3f shows mean bar chart plot with distribution of element and Figure 4f shows predominant particle morphology and EDS analyze spectrum. We can notice in anthropogenic particles, the presence of two or more morphologies with different elemental composition or similar. The Table 1 shows a summary of elemental composition of anthropogenic particles by process, Figure 3 shows mean bar chart plot with distribution of element to compare between process and Figure 4 shows predominant particle morphology and spectrums by each process.. 6.
(7) Morphology and Size analyses The total acquired TEM images were 334, from these images we selected 358 viable particles to process each one. The individual particles analyzed were identified by morphology, such as irregular, spherical cubic and aggregates. Figure 4 shows a typical morphology type for each process and the Table 1 shows relation between morphology and elemental composition. Diameter of Feret (Size) The most processes showed frequency distribution curve with positive skew, presumably to a distribution of log-normal type. The average size range of the overall sample is 0.8 μm to 2.1 μm, the average value of eight processes are below 1.0 μm. The P07 had the lowest value and P09 the higher value. Three ceramic processes (P01, P02 and P08) had an average value close to 0.9 ± 0.5 μm and the missing process (P09) differs in the behavior of the previously mentioned group with a mean value greater than 2.0 μm. The polymer process P10 had an average value close to 0.9 μm; the other process P06 presents the second higher mean size 1.63 μm with a higher standard deviation than 0.9 μm. The painting management processes (P04) had an average value close to 0.9 μm. The melting aluminum process (P03) presented a similar behavior to ceramic processes. Finally the fuels management (P05) has a value below 1.2 μm. The Figure 5a and Table 2 shows comparative Feret diameter values between each process. Circularity Compactness Ratio The circularity value measures let study the regularity or no-regularity about particles. Three manufactured ceramic tile process showed an average value and standard deviation is close to 0.5± 0.1, it means mainly irregular particles shapes and the missing process (P09) has a minor value compare to previous processes, this is due to change of mechanical to drying process of ceramic material. The processes P04, P06 and P10 showed mostly spherical particles with average value and standard deviation higher than 0.5±0.12, this variety is attributable to the presence of irregular particles. The process P03 presented three morphology types isolated cubic, irregular, aggregates cubic, the mean circularity value is greater than 0.5 and similar pattern to the three homogeneous ceramic processes. The process P05 has a mean value less than 0.2 and it has smaller standard deviation below 0.1; this process consists mainly of fractal-like aggregates. The Figure 5b and Table 2 shows comparative Circularity values between each process. Fractal Dimension and Lacunarity The values of density and perimeter fractal dimension let to study texture and corroborate the presence of morphology types about particles in each process. The Figure 6, Figure 5c and 5d show distribution density curves and average with standard deviation values, respectively. Figure 6 shows different types curve such as unimodal, bimodal and trimodal for spherical morphology, irregular cubic and fractal-like aggregates. It shows the complexity of samples from each analyzed process. The three ceramic processes (P01, P02 and P08) shows a unimodal curve formed for irregular particles, for density and perimeter fractal dimension; the missing process P09 has two modes for density and perimeter fractal, where distinguished between irregular and regular particles, this is consistent with that reported by compactness ratio. The processes P04,. 7.
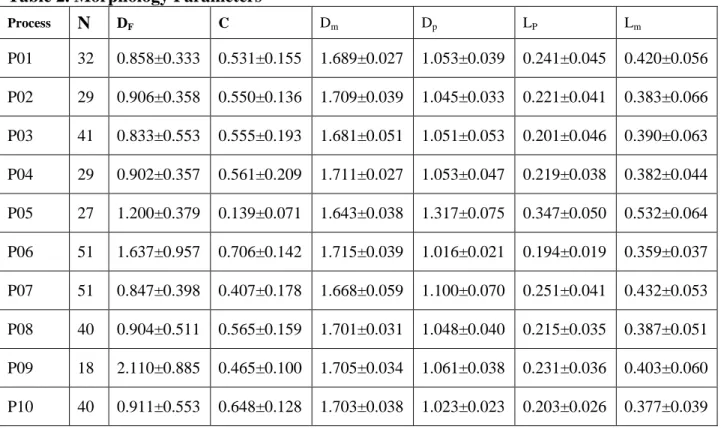
(8) P06 and P10 contain a mixture of spherical and irregular morphologies; it can be notice bi-modal curves with modes in the range of 1.0 to 1.1 for perimeter and in the range of 1.68 to 1.76 for density fractal dimension, respectively for three processes; the behavior values shows in Figure 5c and 5d.The processes P03, P05 and P07 shows a mixture of three morphologies, for the perimeter fractal dimension there is a modal curve with values of 1.05, 1.35 and 1.1, respectively; and for density fractal dimension is observed an average value around 1.65 for these processes as shows in the Figure 5d. The values of lacunarity shows spatial distribution pattern of the particles. The pattern of a sphere is more homogeneous than in an irregular path, even more when compared with an aggregate. The Figure 5e and 5f shows the perimeter and density lacunarity for all particles and process studies. All processes except the process P05, shows predominantly irregular and spherical morphology, these have a greater homogeneity with an average value close to 0.22 to 0.4 for perimeter and density lacunarity, respectively. The P05 process show aggregates morphology, exhibiting an average value of 0.37 and 0.53 for perimeter and density lacunarity, respectively. Table 2. Morphology Parameters Process C N DF. Dm. Dp. LP. Lm. P01. 32. 0.858±0.333. 0.531±0.155. 1.689±0.027. 1.053±0.039. 0.241±0.045. 0.420±0.056. P02. 29. 0.906±0.358. 0.550±0.136. 1.709±0.039. 1.045±0.033. 0.221±0.041. 0.383±0.066. P03. 41. 0.833±0.553. 0.555±0.193. 1.681±0.051. 1.051±0.053. 0.201±0.046. 0.390±0.063. P04. 29. 0.902±0.357. 0.561±0.209. 1.711±0.027. 1.053±0.047. 0.219±0.038. 0.382±0.044. P05. 27. 1.200±0.379. 0.139±0.071. 1.643±0.038. 1.317±0.075. 0.347±0.050. 0.532±0.064. P06. 51. 1.637±0.957. 0.706±0.142. 1.715±0.039. 1.016±0.021. 0.194±0.019. 0.359±0.037. P07. 51. 0.847±0.398. 0.407±0.178. 1.668±0.059. 1.100±0.070. 0.251±0.041. 0.432±0.053. P08. 40. 0.904±0.511. 0.565±0.159. 1.701±0.031. 1.048±0.040. 0.215±0.035. 0.387±0.051. P09. 18. 2.110±0.885. 0.465±0.100. 1.705±0.034. 1.061±0.038. 0.231±0.036. 0.403±0.060. P10. 40. 0.911±0.553. 0.648±0.128. 1.703±0.038. 1.023±0.023. 0.203±0.026. 0.377±0.039. 8.
(9) Figure 3. Distribution of element by process. (a) P01, (b) P02, (c) P03, (d) P04, (e) P05, (f) P06, (g) P07, (h) P08, (i) P09 and (j) P10.. 9.
(10) Figure 4. Anthropogenic particles and spectrum TEM/EDX. (a) P01, (b) P02, (c) P03, (d) P04, (e) P05, (f) P06, (g) P07, (h) P08, (i) P09 and (j) P10.. 10.
(11) Figure 5. Diameter of Feret, Roundness, Compactness Ratio, Fractal Dimension and Lacunarity by Process a). μm. 11.
(12) Figure 6. Density Plot of Fractal Dimension. SUMMARY We study shapes factors, fractal dimension and elemental composition for anthropogenic source particles from ten processes located in Chihuahua-México. All process presented silicate particles and almost all particles were oxidized. The emissions from Tile ceramic manufacturer in different stages (clay milling, material recovery, recycler process of refractory clays, unfired clay dryer) there are majority compounds of aluminum and calcium silicate. The fumes from paint and solvent cabin, fuel oil handling, manufacture automotive steering systems and automotive thermoplastic components process contain C-rich, majority S and Ti elements. The particles generated from aluminum wheels for cars contain Mg and Al rich elements. And finally the emissions from cleaning metal parts in Trailers manufacture contain Fe-rich elements. We can notice in anthropogenic particles, the presence of two or more morphologies with different elemental composition or similar. The individual particles analyzed were identified by. 12.
(13) morphology, such as irregular, spherical cubic and aggregates. All process was presented distribution of log-normal type and mean value size for majority process is below 1.0 μm. Three ceramic processes presented similar behavior for compactness ratio, fractal dimension and lacunarity and the other process P09 differs in the behavior with minor value. All particles from theses process have irregular shape. The polymeric processes showed major spherical and minor irregular shape particles, these confirm with higher value for compactness ratio, bimodal distribution for fractal dimension and minor values for lacunarity. The melting aluminum, sandblast and fuel oil handling process presented mixture of three morphologies, cubic, irregular and cubic aggregates; the behavior was similar among them.. ACKNOWLEDGMENTS The authors acknowledge to Wilber Antúnez, Karla Campos and Enrique Torres for technical help at Nanotechnology National Laboratory Equipment of CIMAV. The our acknowledge to Jorge Carrillo, Ramón Gomes and Elias Ramírez support for help at the Air Pollution Prevention Control Group of the Environment and Energy Department of CIMAV.. REFERENCES 1. 2. 3. 4. 5. 6.. Colbeck, I.; Atkinson, B.; Johar, Y. J. Aerosol Sci. 1997, 28, 715-723. Osán, J.; Alföldy, B.; Török, S.; Van Grieken, R. Atmos. Environ. 2002, 36, 2207-2214. Murr, L. E.; Bang, J. J. Atmos. Environ. 2003, 37, 4795-4806. Dye, A. L.; Rhead, M. M.; Trier, C. J. Atmos. Environ. 2000, 34, 3139-3148. Kaegi, R. J. Aerosol Sci. 2004, 35, 621-632. Piña, A. A.; Villaseñor, G. T.; Fernández, M. M.; Luszczewski Kudra, A.; Leyva Ramos, R. Atmos. Environ. 2000, 34, 4103-4112. 7. Lammel, G.; Schneider, F.; Brüggemann, E.; Gnauk, T.; Röhrl, A.; Wieser, P. Water Air Soil Poll. 2004, 154, 313-330. 8. Gómez, E.; Sanfeliu, T.; Jordán, M.; Rius, J.; Fuente, C. Environ. Geol. 2004, 45, 536-543. 9. Fromme, H.; Diemer, J.; Dietrich, S.; Cyrys, J.; Heinrich, J.; Lang, W.; Kiranoglu, M.; Twardella, D. Atmos. Environ. 2008, 42, 6597-6605. 10. Jones, T.; Blackmore, P.; Leach, M.; BéruBé, K.; Sexton, K.; Richards, R. Atmos. Environ. 2002, 75, 293-312. 11. Niemi, J. V.; Tervahattu, H.; Vehkamäki, H.; Martikainen, J.; Laakso, L.; Kulmala, M.; Aarnio, P.; Koskentalo, T.; Sillanpää, M.; Makkonen, U. Atmos. Chem. Phys. 2005, 5, 22992310. 12. Niemi, J. V.; Saarikoski, S.; Tervahattu, H.; Mäkelä, T.; Hillamo, R.; Vehkamäki, H.; Sogacheva, L.; Kulmala, M. Atmos. Chem. Phys. 2006, 6, 5049-5066. 13. Sonka, M.; Hlavac, V.; Boyle, R. Image Processing, Analysis, and Machine Vision; 3rd ed.; CL-Engineering, 2007. 14. Wu, Q.; Merchant, F.; Castleman, K. Microscope Image Processing; 1st ed.; Academic Press, 2008. 15. Allen, T. Particle Size Measurement: Volume 1: Surface area and pore size determination, Volume 2: Powder sampling and particle size measurement (Particle Technology Series); 5th ed.; Springer, 1996.. 13.
(14) 16. Kaye, B. H. Characterization of Powders and Aerosols; Wiley-VCH, 1999. 17. Mandelbrot, B. B. The Fractal Geometry of Nature; W. H. Freeman, 1983. 18. McDonald, R.; Biswas, P. J. Air Waste Manag. Assoc. 2004, 54, 1069–1078. 19. Smith, T. G.; Lange, G. D.; Marks, W. B. J. Neurosci. Methods 1996, 69, 123-136. 20. Gefen, Y.; Meir, Y.; Mandelbrot, B. B.; Aharony, A. Phys. Rev. Lett. 1983, 50, 145. 21. McMurry, P. H. Atmos. Environ. 2000, 34, 1959-1999. 22. Chihuahua in Brief. http://www.municipiochihuahua.gob.mx/economia/parques.aspx (accessed Nov 7, 2009). 23. Encyclopedia of the Municipalities of Mexico. http://www.elocal.gob.mx/wb2/ELOCAL/ELOC_Enciclopedia (accessed Nov 8, 2009). 24. Laskin, A.; Cowin, J.; Iedema, M. J. Electron Spectrosc. 2006, 150, 260-274. 25. Rasband , W. ImageJ; National Institutes of Health: US. 26. Gonzalez, R. C.; Woods, R. E.; Eddins, S. L. Digital Image Processing Using MATLAB; Prentice Hall, 2003. 27. Gonzalez, R. C.; Woods, R. E. Digital Image Processing; Prentice Hall, 2002.. KEY WORDS urban aerosol, source anthropogenic, morphology, elemental composition, fractal dimension, lacunarity.. 14.
(15)
Figure

+5


Documento similar
In this guide for teachers and education staff we unpack the concept of loneliness; what it is, the different types of loneliness, and explore some ways to support ourselves
The expansionary monetary policy measures have had a negative impact on net interest margins both via the reduction in interest rates and –less powerfully- the flattening of the
Jointly estimate this entry game with several outcome equations (fees/rates, credit limits) for bank accounts, credit cards and lines of credit. Use simulation methods to
2004, Space physics : an introduction to plasmas and particles in the he- liosphere and magnetospheres (Space physics : an introduction to plasmas and particles in the heliosphere
The cyclic voltammetry characterization of CdSe NPs with different morphology, size and surface composition reveals that the redox processes depend on the NP
For both the free liquid slabs and the adsorbed films and despite of the low vapor density, we have found that the fluctuations associated with the evaporation of particles to the
Given some initially unperturbed distribution of particles, and taking into account the primordial power spectrum as initial condition, one can model the evolution and
Optimal performance has been obtained for the Kaiser and Cauchy distributions applied to the Koch fractal pattern, combined with a rectangular and Cauchy distribution applied to
