Employment transitions and occupational mobility in Europe The impact of the great recession
62
0
0
Texto completo
(2)
(3) Employment transitions and occupational mobility in Europe: The impact of the Great Recession. European Foundation for the Improvement of Living and Working Conditions.
(4) When citing this report, please use the following wording: Eurofound (2017), Employment transitions and occupational mobility in Europe: The impact of the Great Recession, Publications Office of the European Union, Luxembourg.. Authors: Enrique Fernández-Macías and Martina Bisello (Eurofound); Vincenzo Maccarrone (University College Dublin) Research managers: Donald Storrie and Enrique Fernández-Macías Eurofound project: Labour market transitions in turbulent times. Luxembourg: Publications Office of the European Union Print: Web:. ISBN: 978-92-897-1593-5 ISBN: 978-92-897-1592-8. doi:10.2806/34515 doi:10.2806/145355. TJ-01-17-564-EN-C TJ-01-17-564-EN-N. © European Foundation for the Improvement of Living and Working Conditions, 2017 For rights of translation or reproduction, applications should be made to the Director, European Foundation for the Improvement of Living and Working Conditions, Wyattville Road, Loughlinstown, Dublin D18 KP65, Ireland. The European Foundation for the Improvement of Living and Working Conditions (Eurofound) is a tripartite European Union Agency, whose role is to provide knowledge in the area of social, employment and work-related policies. Eurofound was established in 1975 by Council Regulation (EEC) No. 1365/75 to contribute to the planning and design of better living and working conditions in Europe. European Foundation for the Improvement of Living and Working Conditions Telephone: (+353 1) 204 31 00 Email: [email protected] Web: www.eurofound.europa.eu. Europe Direct is a service to help you find answers to your questions about the European Union. Freephone number*: 00 800 6 7 8 9 10 11 *Certain mobile telephone operators do not allow access to 00 800 numbers or these calls may be billed. Printed in Luxembourg Cover image: © IR Stone / Shutterstock.
(5) Contents Executive summary. 1. Introduction. 3. 1. Literature review. 5. 2. Analytical framework and methodology. 9. The jobs-based approach. 9. Analytical framework. 10. Data source. 11. Presentation and analysis of results. 12. 3. Shifts in employment and the jobs structure, 1995–2015. 13. 4. Impact of the crisis on occupational and employment transitions. 17. Transitions into and out of inactivity. 19. Transitions into and out of unemployment. 19. Transitions between quintiles. 21. Summary. 23. An econometric approach to labour market outcomes. 25. Gender. 26. Educational attainment. 27. Age. 28. Job-related characteristics. 29. Parenthood. 31. Summary. 32. Linking job polarisation and labour market flows. 35. Results of analysis. 37. Summary. 41. Conclusions. 43. Bibliography. 45. 5. 6. 7. Annex: Employment flows and occupational transitions for four specific occupations. 47. iii.
(6) Country codes AT. Austria. FI. Finland. NL. Netherlands. BE. Belgium. FR. France. PL. Poland. BG. Bulgaria. HR. Croatia. PT. Portugal. CY. Cyprus. HU. Hungary. RO. Romania. CZ. Czech Republic. IE. Ireland. SE. Sweden. DE. Germany. IT. Italy. SI. Slovenia. DK. Denmark. LU. Luxembourg. SK. Slovakia. EE. Estonia. LT. Lithuania. UK. United Kingdom. EL. Greece. LV. Latvia. ES. Spain. MT. Malta. iv.
(7) Executive summary Introduction. Policy context. The Great Recession has had significant and lasting effects on European labour markets, with a big drop in employment levels, which are yet to recover in many countries almost a decade later. It also affected the employment structure, accelerating structural change and generalising a pattern of job polarisation across Europe, in which employment in mid-paid jobs declined more than in jobs at the top and bottom of the occupational structure.. In the context of the recent financial and economic crisis, measuring labour market flows and studying their implications for the life chances of workers is as important as measuring developments in aggregate employment stocks and structures. Indeed, a similar level of unemployment can have very different implications depending on whether or not there are significant flows into and out of it, or if the flows are linked to the whole employment structure or only to low-paid jobs. The identification of a trade-off between unemployment and low-paid (or, in general, lowquality) employment would raise important policy issues.. Although much is known about how the crisis changed the stocks and structures of employment, there is less evidence about the myriad of flows into and out of employment, and from job to job, which are behind these aggregate numbers. Indeed, labour markets are in a constant state of flux, and the same stocks and structures at the aggregate level can be associated with quite different patterns of employment transitions and occupational mobility. The aim of this report is to investigate the effect of the Great Recession on labour market flows and to explicitly link these individual-level transitions to the broad labour market developments during the crisis, such as the surge in unemployment and the phenomenon of job polarisation. To do this, and building on the ‘jobs-based approach’ used in Eurofound’s European Jobs Monitor, this study introduces a new occupational framework for studying labour market flows; this takes into account the quality of the jobs from and into which the flows are taking place by differentiating them into wage quintiles. This is useful not only in making it easier to link with previous research on structural labour market developments, but also to evaluate the nature and implications of these flows. The study offers a comprehensive and detailed picture of transitions between labour market states (employment, unemployment and inactivity) and within employment by job quality (wage) quintiles. The analysis is carried out by comparing six European countries (France, Italy, Poland, Spain, Sweden and the UK) that were selected as being representative of different institutional clusters. It is differentiated into three separate time periods: just before the crisis (2006–2007), immediately after (2009–2010), and a few years into the crisis (2012–2013), when some countries started to recover and others continued to experience recession.. Job polarisation might be expected to be associated with fewer employment opportunities for mid-paid occupations and, therefore, a more-or-less generalised reduction of mobility up and down the occupational ladder. Changes in the patterns of employment mobility and occupational flows directly affect the distribution of life chances among the population. Moreover, if mobility patterns differ significantly across countries, the same external shock can be translated into very different patterns of labour market flows at the individual level. This report offers a novel perspective for a better understanding of what happened to workers who lost their jobs in the recession – whether they were reallocated to other jobs or whether they moved into unemployment or inactivity – and whether opportunities for upward occupational mobility (or risks of downward mobility) were affected by the crisis.. Key findings Analysis of the flows between inactivity, unemployment and employment (differentiating five categories of jobs according to their average wages) shows very different patterns in the six selected European countries before, during and after the Great Recession. The results make it possible to identify three different pairs of countries on the basis of the fluidity of their labour markets. Sweden and the UK are similar in their employment and occupational flows, despite their very different socioeconomic models. Both countries show highly fluid labour markets, with significant flows not only. 1.
(8) Employment transitions and occupational mobility in Europe: The impact of the Great Recession. between employment and unemployment but also between different categories of jobs (implying possibilities for occupational mobility). Levels of mobility remained high during the crisis, although this is probably the result of better general economic conditions (both countries are outside the euro area, and their employment levels have recovered faster than the other countries studied). Mobility patterns in Poland and Spain suggest a dual labour market, with significant flows between unemployment and low-paid jobs, but few possibilities for mobility up or down the occupational ladder. Compared with Poland, the crisis hit Spain particularly hard, and its effects on unemployment risks were very strong in the middle quintiles. Finally, France and Italy belong to a third group of countries with comparatively less mobile labour markets and little overall flow between jobs or employment status. The effect of the crisis on the transition patterns in these countries was relatively mild, although it did increase the chances of job loss and made between-quintile flows even less frequent.. 2. Conclusion This study analysed the mobility patterns that are behind structural changes in European labour markets before, during and after the Great Recession, linking individual-level trajectories of employment and occupations to changes in aggregate labour market stocks. Different levels of fluidity in labour market transitions between employment status and occupational levels are associated with similarly broad patterns of structural change, leading to different implications for employment opportunities and ultimately life chances. Overall, the key findings suggest very different patterns and levels of labour market flows in the six European countries studied. While a certain degree of occupational mobility in labour markets is probably desirable, to the extent it is not limited to the lower occupational levels but allows the possibility of upgrading to better jobs, a proper evaluation of the actual implications of each type of transition for the individuals affected would be needed to draw sound policy implications. This would require expanding the analysis to the actual wage and income levels involved, the scale of unemployment benefits and other attributes of the social system..
(9) Introduction The recent financial crisis has had significant and lasting effects on European labour markets. In terms of employment levels, it led to a big drop in employment, which has taken years to recover – in some cases, it has not recovered yet. In terms of employment structures, the crisis generalised a pattern of ‘negative job polarisation’, in which mid-paid jobs declined in relative (and often also absolute) terms with respect to jobs at the top and bottom of the occupational structure (Eurofound, 2013). These are very significant developments that suggest a real change for the worse in the employment and occupational opportunities of Europeans; declining employment numbers in mid-paid occupations particularly are likely to be perceived by individuals as lessening their chance of finding a good job and of moving up the occupational ladder. Much is known about how the crisis changed the stocks and structures of employment, but not so much is known about how it changed the individual-level flows and transitions between jobs and different employment statuses. Labour markets are in a constant state of flux, even if aggregate stocks and structures appear relatively stable. Under those relatively stable aggregate numbers, there are a myriad of flows into and out of employment, and from job to job, continuously taking place. The aggregate numbers of labour market statistics are just the net result of those flows in different directions. Of course, that does not make the aggregate numbers less real or important; they reflect the economic and social structures that underlie labour markets, which significantly shape the nature and character of our socioeconomic systems. But the same aggregate stocks and structures can be associated with rather different patterns of employment mobility and occupational flows, and this directly affects the distribution of life chances among the population. The same level of unemployment can have very different implications if there are significant flows into and out of it or not, or if the flows are linked only to low-paid jobs or to the whole employment structure. If there are no flows, the level of unemployment can mean a total exclusion from economic life for a part of the population. If flows are restricted to low-paid jobs, it can be associated with a labour market segmented into two impermeable groups. In the case of frequent flows across the whole occupational structure, it can be harmless to the economic and life chances of the vast majority of the population. Measuring labour market flows and understanding their implications for the chances of workers can be as important as measuring. stocks and structures, particularly in the context of a major crisis like that which occurred in 2008. The aim of this report is to explicitly link the broad labour market developments of European countries in the last decade with individual-level flows between different employment statuses and occupational levels. In order to evaluate the nature and implications of the flows, and to facilitate the link with previous research on structural labour market developments, workers are classified in occupations and grouped in five categories (quintiles) according to the average occupational wages. This approach is very similar, though not identical to (because of limitations imposed by the data), the ‘jobs-based approach’ used in the European Jobs Monitor (Eurofound, 2013) and other recent literature on occupational change (see, for instance, Wright and Dwyer, 2003; Fernández-Macías et al, 2012; Oesch, 2013). The novelty of the approach means that there are few previous comparable studies, and, therefore, the analysis should be open and exploratory. However, it is possible to specify some initial expectations against which the results can be judged. First, since the analysis is carried out by comparing European countries selected as representing different institutional clusters, a significant degree of cross-country variation is to be expected. The extent to which such cross-country variation aligns with the usual institutional country clusters (Ireland and the UK versus Nordic countries versus continental countries versus southern European countries, for instance) should remain an open question. Previous research, for instance, found that the UK and the Nordic countries display similarly high levels of occupational mobility, in contrast to much lower mobility flows in continental and southern Europe (Eurofound, 2006, 2007). Second, although the effect of the Great Recession varied significantly in intensity and duration across countries, the previously mentioned evidence of a generalised shift towards negative job polarisation can be expected to produce similar effects across countries. Negative job polarisation might be expected to be associated with fewer employment opportunities for mid-paid occupations and, therefore, a more-or-less generalised reduction of mobility up and down the occupational ladder. But, again, this initial expectation should be a question to be answered rather than an answer to be confirmed. If countries’ mobility patterns do differ significantly, the same external shock can be translated into very different patterns of labour market flows at the individual level. This is what this report tries to elucidate.. 3.
(10) Employment transitions and occupational mobility in Europe: The impact of the Great Recession. The structure of the report is as follows. Chapter 1 reviews the existing literature on the subject. Although, as noted above, there are no previous studies that used the exact methodology of this report, there are many that cover some specific aspect of employment and occupational mobility in recent years in comparable ways. Chapter 2 introduces the analytical framework and discusses the methodological challenges of this kind of analysis and how they have been addressed. Chapter 3 provides some context, summarising the main labour market developments in Europe in recent years.. Chapter 4 is the core of the report, a systematic analysis of the patterns of employment transitions and occupational mobility in six European countries across three different time periods: £. just before the crisis (2006–2007);. £. immediately after (2009–2010);. £. a few years into the crisis (2012–2013), when some countries started recovering and others continued to experience the negative effects.. Chapter 5 evaluates whether there are significant differences in the patterns of employment transitions and occupational mobility of different sociodemographic groups. And, finally, Chapter 6 presents a discussion of the link between the broad labour market developments during the crisis (growing unemployment and job polarisation) and individual-level employment and occupational flows.. 4.
(11) 1 Literature review This study presents an overview of labour market transitions from 2006 to 2013 in six selected European countries: France, Italy, Poland, Spain, Sweden and the UK. Using longitudinal data from the European Union Statistics on Income and Living Conditions (EU-SILC), it offers a comprehensive picture of transitions between labour market states (employment, unemployment and inactivity) and within employment by wage quintiles. Job mobility is extensively investigated in the literature as a key element of workforce flexibility and reallocation of employment. However, to the best of the authors’ knowledge, there is very limited evidence on mobility patterns in Europe from, to and within employment by wage levels. Some papers investigate the subject but focus on particular aspects of it without taking a comprehensive approach. Nolan and Voitchovsky (2016) examined the incidence of job loss by wage levels (quintiles) during the Great Recession in Ireland. Their analysis showed that the probability of remaining in employment is positively correlated with monthly earnings and that this correlation was higher during the ‘bust’ period (2009) compared with the boom year (2006). However, the study was limited to one specific country and focused exclusively on movements out of employment, and not into or within employment. A second relevant study is one by Longhi and Taylor (2013), who provided a detailed comparison of mobility patterns for employed and unemployed job-seekers between 2001 and 2010, but in the UK only. They found that the direction of occupational mobility, defined as a transition to an occupation with a higher mean wage than the initial one, was very different across the two groups; while employed job-seekers were more likely to exhibit upward mobility, unemployed job-seekers were more likely to move into low-ranking occupations. A third paper by Cortes (2016) presented evidence on occupational mobility patterns by ability (and not wage) quintiles in the USA. The results showed that, since the early 1990s, workers with medium ability had a much lower probability of switching out of routine occupations than workers at the top and bottom of the ability distribution. Routine workers of medium ability were also less likely than those at the bottom to get a job in non-routine manual (that is, service) occupations. The study also investigated the transitions to unemployment and inactivity of different occupational groups, revealing that routine workers had become. more likely to enter unemployment than non-routine workers (no significant differences in moves to inactivity were found). While these studies offer useful insight in the context of the analysis of labour market transitions by job quality levels, they lack a European comparative perspective. This report aims to fill the gap in the literature, not only by offering a cross-country comparison of labour market transitions by wage quintiles, but also by extending the period of analysis to recent years, including the second phase of the recession. A recent study by the European Commission (2016b) presented an overview of the latest trends in labour market transitions in the European Union using new flow statistics from the European Union Labour Force Survey (EU-LFS) and micro-data from EU-SILC. To track mobility within employment, the analysis focused on transitions towards better jobs from 2008 to 2013 in employment contracts (from temporary to permanent) and working time arrangements (from part-time to fulltime). The current report takes a different perspective and presents evidence on movements towards better or worse pay, a key component of job quality (Muñoz de Bustillo et al, 2011). A similar approach is taken when investigating labour market flows into and out employment. Some evidence on transitions to higher or lower wage deciles in Europe is included in Employment and social developments in Europe: Annual review 2016 (European Commission, 2016a), but this covers a shorter time span in the post-crisis period. EU-SILC longitudinal data make it possible to cover three distinct sub-periods that are very different in economic performance – one of growth (2006–2007) and two of recession (2009–2010 and 2012–2013) – which hit European economies (and within them different sociodemographic groups) in a very heterogeneous way. The literature emphasises the significant impact of macroeconomic factors on mobility patterns, which justifies a separate focus on pre- and post-crisis periods. Apart from the paper by Nolan and Voitchovsky (2016) for Ireland, other studies focus on the period of the economic crisis. Bachmann et al (2015), for instance, investigated the heterogeneous effects of the Great Recession (2008–2010) on labour market transitions in Europe by sociodemographic group and employment type. They concluded that, during the crisis, the transition rate from employment to unemployment increased more significantly for young people, men and middle-skilled workers than for. 5.
(12) Employment transitions and occupational mobility in Europe: The impact of the Great Recession. other groups. Moreover, temporary contracts contributed more than permanent contracts to rising transitions into unemployment, suggesting that the stepping stone function of temporary employment deteriorated during this period.1 The European Commission study (2016b) on labour market transitions during the crisis confirmed that transition rates from temporary to permanent jobs fell by 4.6 percentage points at EU level from 2008 to 2013. Finland and the UK were among the few countries that experienced a remarkable increase. Similarly, the rate of movement from part-time to full-time jobs also deteriorated during the crisis (Eurofound, 2016b). Regarding more general occupational upgrading over the business cycle, Devereux (2002) showed that during periods of economic expansion, workers in the USA tend to move to higher-paying occupations and that pro-cyclical occupational upgrading is stronger for less-skilled individuals. Research for Europe has shown similar results (see, for instance, Teulings, 1993). Another crucial debate in the literature on labour market transitions revolves around the importance of welfare regimes and country-specific institutional factors, which can either mediate or exacerbate the effect of an economic crisis. Using 2005 Eurobarometer data, a Eurofound-commissioned study on occupational mobility in Europe found that employment regime variations are significant and polarised, especially for early career mobility (Eurofound, 2007). In particular, liberal, liberal-leaning post-socialist and socialdemocratic regimes (such as the UK, Estonia and Sweden, respectively) show the greatest fluidity in their occupational structures, while conservative and Mediterranean country regimes (such as Germany and Italy, respectively) show very high levels of stability.2 In a conservative-leaning post-socialist system (such as Poland), levels of downward mobility over the life course are the highest. Other EU-wide analyses on job mobility report similar findings. In a study by Recchi et al (2006), which made use of different data sources for the late 1990s and early 2000s, the results of separate logistic regressions of the likelihood of experiencing upward and downward mobility pointed to the existence of country specificities in regimes of occupational mobility. In particular, the. highest occupational mobility was found in the Netherlands and the UK, and the lowest was found in France. Similarly, a Danish Technological Institute report focusing on a similar time period confirmed that Nordic, Anglo-Saxon and Baltic countries are those with the highest levels of all dimensions of job mobility (that is, change of job, change of occupation and change of employment status), while regimes with stricter employment protection legislation tend to have medium to low levels of job mobility (especially for skilled workers) and lower upward occupational mobility (DTI, 2008). In conclusion, most of the reviewed papers suggested that specific institutional settings explain different patterns of occupational mobility in Europe.3 Another important aspect often investigated in the literature is the variation in labour market transition rates across different segments of society. Following a previous US study by Royalty (1998), Theodossiou and Zangelidis (2009) focused on the role of gender and education in explaining labour market dynamics in six European countries in the mid-1990s. Their findings showed that women are less mobile than men across jobs but are more likely to exit to non-employment. While these results hold for both upward and downward occupational mobility in most European countries, Ireland, the UK and Finland are among the exceptions, offering similar chances to men and women to move up the occupational scale (Recchi et al, 2006). At the same time, education significantly affects women’s turnover behaviour. Poorly educated women are more likely to exit to non-employment compared with highly educated women and men. Education also plays a significant role in the context of occupational mobility within employment (Theodossiou and Zangelidis, 2009). Indeed, workers with low to medium educational levels not only have a higher risk of status loss but also lower chances for further career development compared with those who are more highly educated (Recchi et al, 2006; Eurofound, 2007). However, recent evidence indicates that opportunities to move into employment for people with low educational attainment have improved since 2008 in Europe, despite still being much lower than for highly skilled people (European Commission, 2016b).. 1. According to the stepping stone hypothesis, temporarily having an inadequate job early in a career plays a significant role in the chance of moving to a higher-ranked position later on. Being over-qualified enhances future promotion opportunities and career progression. Moreover, accepting lower-quality jobs makes it possible for workers to avoid unemployment and its scarring effects. See Scherer (2004).. 2. Barone et al (2011) confirmed that career mobility in Italy is generally low and that little change has occurred over time. Because of structural features and protections traditionally accorded to self-employment and institutional constraint (such as formal requirements and bureaucratic procedures), opportunities for career advancement are rather limited in Italy. Downward flexibility is also negligible.. 3. The main exception is the study by Theodossiou and Zangelidis (2009), which did not find significant differences in job-to-job and job-to-non-employment mobility behaviour across six European countries (Finland, France, Germany, Greece, Spain and the UK).. 6.
(13) Literature review. Finally, age is another relevant factor in the context of labour market transitions. Not surprisingly, there is a significant relationship between age and employment mobility,4 with the highest rates for the 25–34 age group (DTI, 2008). But while a substantial part of job. 4. shifts at the same hierarchical level occurs among workers at a relatively young age, the chances of substantial gains in upward occupational mobility are lower for young people than for older workers (Eurofound, 2007).. Employment mobility is broadly defined in this context as the rate of transition from one employment status to another, and therefore covering both movements in and out of the labour market, and between different types of employment contracts.. 7.
(14)
(15) 2 Analytical framework and methodology level. Because of the limitations of the longitudinal EU-SILC data used for this study, only the occupational definition of a job (ISCO at the twodigit level) is retained. Although previous Eurofound research has pointed out that occupation is more important than sector in the definition of jobs (accounting for most of the explanatory power of the latter in relation to tasks, wages and other attributes; see Eurofound, 2016a, 2017 for more details), using only occupation at the two-digit level reduces the degree of granularity of the analysis and decreases the internal consistency of the units. However, considering the limitations of the data, this level of detail seems like a good compromise, and the approach remains broadly consistent with that of the European Jobs Monitor and other recent approaches to occupation-based structural labour market analysis.. The jobs-based approach The main objective of this report is to study how the recent crisis affected transitions between jobs and employment status in Europe, taking job quality into account. To do this, it takes an occupational perspective, which is inspired by the jobs-based approach that underlies Eurofound’s European Jobs Monitor (see Eurofound, 2008, 2016a; also FernándezMacías, 2012). The key elements of this perspective are summarised below. £. The unit of analysis is shifted from individuals to detailed occupations. Occupations can be defined as positions in productive structures involving a particular bundle of tasks and requiring a particular set of skills. Using detailed occupations as the unit of analysis makes it possible to shift the level of analysis to the productive structure (instead of the unstructured ‘labour market’) and to define job quality in relation to labour market positions, typical task bundles and skills (abstracting from endogenous variability in individual outcomes and attributes). From this approach, each detailed occupation can be understood almost as a separate labour market. The human capital requirements associated with the job as well as the existence of internal labour market dynamics (such as the benefits of seniority) means that a transition within the same occupation is fundamentally different from a transition outside the occupation. From this perspective, the focus is on transitions that cross occupational boundaries since these imply a real change in socioeconomic position and life chances. Also, from this approach, in order to evaluate the chances afforded by a particular transition (say, from unemployment into a particular occupation), it is necessary to look at the average conditions of people in the same occupation rather than at the specific conditions of the new entrant in a new job. This approach is similar but not identical to the jobs-based approach of the European Jobs Monitor. In that approach, the basic unit of analysis is the job, defined as the combination of detailed sector and occupation – the Statistical Classification of Economic Activities in the European Community (NACE) and the International Standard Classification of Occupations (ISCO) at the two-digit. £. Occupations are ranked by their average wages and aggregated into quintiles. Again, the study broadly follows the approach taken in the European Jobs Monitor, although the latter also uses other ranking criteria such as job quality (Eurofound, 2013). In most cases, the job-to-job transitions considered significant for the analysis are those that involve not only changing occupation, but also moving into an occupation in a different wage quintile. In other words, occupations that are in the same quintile are considered to provide more or less equivalent conditions and life chances. In some cases, however, the study looks at transitions taking place between specific occupations in order to extend the analysis or illustrate some general finding with an example (see the Annex).. £. The analysis then categorises labour market transitions that take place among seven basic positions. Five of these positions correspond to occupations ranked by average wages and are of roughly the same size. These can be interpreted as representing ‘low-paid jobs’, ‘mid-low-paid jobs’, ‘mid-paid jobs’, ‘mid-high-paid jobs’ and ‘high-paid jobs’. The remaining two correspond to unemployment and inactivity (in other words, the two possible labour market statuses of the working age population not in employment). The basic structure of the analysis is a 7 x 7 grid showing all the possible transitions between the seven positions and between two different points in time, as shown in Table 1.. 9.
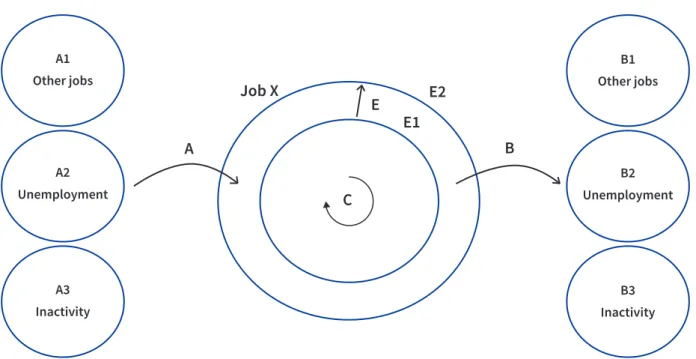
(16) Employment transitions and occupational mobility in Europe: The impact of the Great Recession. Table 1: Employment status transition matrix Position today Low-paid job Mid-low-paid Mid-paid job Mid-high- High-paid job (Q1) job (Q2) (Q3) paid job (Q4) (Q5) Unemployed. Inactive. Position 1 year ago. Low-paid job (Q1) Mid-low-paid job (Q2) Mid-paid job (Q3) Mid-high-paid job (Q4) High-paid job (Q5) Unemployed Inactive Note: Q = Quintile. In the analysis, all the working age population are classified according to their current and last year’s labour market position in one of the matrix’s 49 cells. The cells on the diagonal (shaded) in Table 1 represent stability in labour market position (no change between last year and today). The top left quadrant has 20 cells representing transitions between occupations, while those to the left of the diagonal represent movements down the occupational ladder and those to the right of the diagonal represent movements up. The bottom left quadrant represents transitions from non-employment into jobs of different quality that took place in the last 12 months. The top right quadrant represents transitions from jobs of different quality into non-. employment. Finally, the bottom right quadrant represents stability or shifts between unemployment and inactivity.. Analytical framework How can this be related to the transitions approach with the net change figures that would usually be studied in unemployment statistics or the European Jobs Monitor results? Figure 1 shows a full representation of all the possible flows into and out of a particular job (in a closed economy) and how they add up to the figures of employment levels and net change usually analysed.. Figure 1: Flows into and out of a particular job. A1. B1. Other jobs. Job X. Other jobs. E2. E E1. B. A A2 Unemployment. 10. B2. C. Unemployment. A3. B3. Inactivity. Inactivity.
(17) Analytical framework and methodology. The circle in the middle of Figure 1 represents a particular job or occupation (Job X) (for instance, nurses or health associate professionals) in a particular country. E2 represents the stock of people employed in that job today, while E1 represents the stock of people employed in the same job one year ago. If E1 is subtracted from E2, the result is E, which represents the net change in employment in that job. In the European Jobs Monitor, these are the main numbers used to evaluate how the occupational structure changes over time. Using the average wage of the job and according to its initial employment (E1), the job is located in a particular quintile. The change in employment (E) is then added to the change of all the other jobs in the same quintile to evaluate how much employment in that particular type of job grew. From a dynamic perspective, the net change in the number of people employed in a job (E) can be broken down into the number of people who came into the job (A) minus the number of people who left the job (B) over the same period (in other words, E = A – B). The flows of people into the job can be further broken down into three categories: £. people coming from a different job (A1);. £. people coming from unemployment (A2);. £. people coming from inactivity (A3).. The same breakdown can be done for the flows out of the job (B1, B2 and B3). Finally, C represents flows taking place within the same job/occupation over the last 12 months (for instance, a nurse changing employer but still working as a nurse). Although the underlying framework is the one represented in Figure 1, in most of the analysis the study groups the jobs into quintiles rather than analysing them individually. However, the set of relations depicted in Figure 1 applies to the analysis at the job quintile level (just replacing ‘job’ by ‘quintile’ where necessary). The main difference is that in that case, the flows in and out of the quintile (A1 and B1) can be further differentiated according to the quintile of origin or destination, and this can be used to evaluate whether the change of job implies an upward or downward move in the occupational ladder. The link between this framework and the 7 v 7 mobility matrix presented in Table 1 should be obvious: that is, the flows in and out of a job correspond to the cells outside the diagonal, while those remaining in the job correspond to the diagonal.. 5. Data source To carry out this transition analysis of recent developments in European labour markets, this study used the longitudinal module of the EU-SILC, an annual household survey representative of the working age population that provides separate cross-sectional and longitudinal data. The longitudinal EU-SILC uses a rotating panel structure. Each year, 25% of the sample is substituted after having participated in four consecutive annual waves of the survey. So, in any particular year, four different samples are included in the longitudinal sample of EU-SILC, each one accounting for 25% of the total: one that participates for the first time; one that participates for the second time; one for a third time; and one for a fourth and final time. The variables included in the longitudinal EU-SILC are a sub-sample of the full range of variables available in the crosssectional version. EU-SILC data make it possible to track changes in employment and labour market status for the same individual over a period of four years. But because of the rotating panel structure, that implies using only a fraction of the sample or pooling data for many different years, which complicates the analysis when the objective is to evaluate the impact of an event such as the 2008 crisis. To estimate the differences in the labour market transition patterns before and after the crisis, it is enough to cover the transitions between two consecutive years, hence making it possible to use a much larger sample of the longitudinal EU-SILC (three-quarters of the total, corresponding to all the sub-samples that have participated at least twice in the panel) without the need to pool many different years of data.5 Taking all this into account, it was decided to construct three different samples: £. for the period before the crisis, a sample including all the respondents in the longitudinal EU-SILC of 2006 and 2007 who had participated at least twice, and including all their information for the base year and the year before – this includes three-quarters of the sample participating in 2006, with information on their labour market status for 2005 and 2006, and three-quarters of the sample participating in 2007, with information on their labour market status for 2006 and 2007;. £. for the period immediately after the crisis, a sample including all the respondents in the longitudinal EU-SILC of 2009 and 2010 who had participated at least twice, and including all their information for the base year and the year before;. As Bachmann et al (2015) noted, employing annual data can cause an underestimation of the true labour market mobility as this approach does not cover transitions that occur within the period defined by the two consecutive annual measures. However, they reported that this time-aggregation bias is relatively small, at least with respect to cyclicality.. 11.
(18) Employment transitions and occupational mobility in Europe: The impact of the Great Recession. £. for the period of the second crisis after a failed recovery, a sample including all the respondents in the longitudinal EU-SILC of 2012 and 2013 who had participated at least twice, and including all their information for the base year and the year before.. In other words, this study used the longitudinal EU-SILC data for all the available years except 2005 (the first year of data), 2008 (the year the cycle changed), 2011 (the year the ISCO classification was updated, generating inconsistent occupational trends and also a year of cycle change) and 2014 (the most recent year and also one of cycle change). With this approach, it should be possible to observe three relatively distinct and consistent periods of labour market flows, while maximising the sample size given the constraints of EU-SILC. The wage data used to rank the jobs according to their quality were externally linked from the European Jobs Monitor database. This avoided the need to use the wage data from the longitudinal EU-SILC, which have many problems (Engel and Schaffner, 2012), and ensured consistency with the European Jobs Monitor approach. The jobs were then assigned to quintiles for each of the periods on the basis of the total employment of the current year in each of the pooled datasets (so, for 2006 and 2007 in the first period, and so on). Therefore, the allocation of occupations to quintiles was the same within each of the three periods, but different across them. This made it possible to construct the full mobility grid shown earlier in Table 1 for each of the three periods of analysis, with pooled biannual data in each case. The samples used for the analysis are representative of the working age population in the years covered for six European countries representing different European regions and institutional families (France, Italy, Poland, Spain, Sweden and the UK). All the analysis was carried out separately for each country.. Presentation and analysis of results. the same or another position (in other words, the percentages are calculated horizontally, adding up to 100% for each of the positions one year ago). £. Indicators of specific transitions are constructed for an analysis of year-on-year changes. Although the approach is consistent with the other analysis, the procedure for allocating occupations to quintiles is slightly different. Rather than changing it for each of the different periods, the quintile allocation is constructed in the initial year and maintained consistently for the whole period, with just one break forced by the change in the ISCO classification in 2011.. £. Focusing on specific transitions, and drawing on the three pooled samples of the transition tables, a series of econometric models (binary and multinomial logistic regressions) is constructed to evaluate the impact of sociodemographic and economic variables on the risks or chances of experiencing different types of transition. The coefficients of these models can be interpreted as the relative risk of, for instance, women or young people moving from a high-paid job into unemployment relative to men or middle-aged people (those aged 30–50) over each of the periods studied. In this way, it was possible to analyse whether the impact of the crisis on labour market flows was concentrated on certain categories of the population or associated with certain types of jobs.. Alongside these three main modes of analysis, other approaches were used to complement them where they were considered useful or illustrative. In some cases, the study looks at the transitions typically observed for some particularly significant occupations to illustrate the more abstract patterns discussed at the level of quintiles (and to discuss some exceptions, too – see the Annex). The EU-LFS (which has a much larger sample and more detailed occupational variables) is also used to contrast results and extend the period of analysis. Although the EU-LFS does not make it possible to observe transitions directly since it lacks a panel structure, in some cases transitions can be reconstructed by using retrospective variables.. This report uses the following three approaches to present and analyse the results. £. Simple transition tables are used to give a descriptive analysis of the main patterns of employment and occupational transitions for each of the three periods covered.6 These tables are identical to the grid presented in Table 1, with the cells representing the percentage of people in a particular position one year ago and who are now in. 6. Although these are essentially identical to simple contingency tables, they were constructed as multinomial logit models where the dependent variable was the position of the individual in the seven categories of employment and non-employment in the current year, and the independent variables, the position of the individual in the same seven categories one year ago, with a control variable accounting for the effect of the year of observation.. 12.
(19) 3 Shifts in employment and the jobs structure, 1995–2015 The aim of this report is to study employment and occupational transitions in Europe before and after the 2008 financial crisis. First, however, it is useful to provide some context by briefly presenting the main developments in the EU labour market in the last two decades in relation to the same seven broad categories of labour market analysis used for studying transitions in the rest of the report.. simply at the net change in the number of people who fall into each category over the period.. £. 1995 to 2007, corresponding to a long economic and employment expansion in most, though not all, European countries;. These categories, which provide an exhaustive classification of the working age population (15–64 years old), are inactivity and unemployment, and five initially equal-sized categories (quintiles) of employment sorted according to the average wages of the jobs (from low to high). Although the categories are used to study mobility in the rest of the report, this chapter does not look at the flows between them, but. £. 2008 to 2010, corresponding to the initial shock of the financial crisis;. £. 2011 to 2015, when some countries experienced a continuing decline, while others began a timid recovery.. As in the European Jobs Monitor (Eurofound, 2016b), the years covered are split into three periods: 7. Figures 2, 3 and 4 present graphically the net employment change in the seven categories of the working age population used in the rest of the report.. Figure 2: Absolute change in inactivity, unemployment and employment by quintile, 1995–2007 Netherlands. Finland. Italy. France. Luxembourg. Spain. Germany. Denmark. Portugal. Belgium. Sweden. Greece. UK. Ireland. Austria. Notes: The first light blue bar represents inactivity and the second unemployment. The dark blue bars indicate employment by quintile, from low to high wages. Source: EU-LFS (authors’ calculations) and European Jobs Monitor database (see Eurofound, 2017). 7. Although this division into periods makes sense in the context of the economic cycle, it is also necessary for purely technical reasons. In 2008 and 2011, the standard classifications of occupation and sector were substantially revised, making the trend inconsistent before and after when using a jobs-based methodology (see Eurofound, 2013 for details). Only data for the EU15 (the EU Member States before the 2004 and subsequent accessions) are presented, for which there is consistent trend information.. 13.
(20) Employment transitions and occupational mobility in Europe: The impact of the Great Recession. Figure 3: Absolute change in inactivity, unemployment and employment by quintile, 2008–2010 Netherlands. Finland. Italy. France. Luxembourg. Spain. Germany. Denmark. Portugal. Belgium. Sweden. Greece. UK. Ireland. Austria. Notes: The first light blue bar represents inactivity and the second unemployment. The dark blue bars indicate employment by quintile, from low to high wages. Source: EU-LFS (authors’ calculations) and European Jobs Monitor database (see Eurofound, 2017). Figure 4: Absolute change in inactivity, unemployment and employment by quintile, 2011–2015 Netherlands. Finland. Italy. France. Luxembourg. Spain. Germany. Denmark. Portugal. Belgium. Sweden. Greece. UK. Ireland. Austria. Notes: The first light blue bar represents inactivity and the second one unemployment. The dark blue bars indicate employment by quintile, from low to high wages. Source: EU-LFS (authors’ calculations) and European Jobs Monitor database (see Eurofound, 2017). 14.
(21) Shifts in employment and the jobs structure, 1995–2015. The broad trends of structural change in employment and non-employment are well-known and have been discussed in previous reports; see, for instance, Eurofound (2013) and Fernández-Macías (2012). In the initial period (1995–2007), there was a generalised expansion of employment (and decline in unemployment), which was associated with very different patterns of structural change across different European regions. £. In continental Europe, there was job polarisation, with a significant relative expansion of low-paid and high-paid jobs relative to the middle, a trend also found in Ireland and the UK, though less starkly. (Austria is an outlier, being more similar to a southern country in this respect.). £. In northern Europe, there was a strong and clear upgrading, with employment growing faster in higher-paid jobs.. £. In southern Europe, there was a centripetal development, with significant relative gains for mid-paid jobs.. In the first period of the crisis (2008–2010), there was a generalised decline in employment and an increase in both unemployment and inactivity. In most cases, this was associated with a pattern of negative polarisation of the employment structure (in most countries, employment losses were concentrated in the middle). After 2011, the patterns across regions started diverging again. £. In southern Europe, there was a continuation of the negative trends of the recession, with negative job polarisation and unemployment still growing significantly.. £. There were employment gains in continental Europe – with continuing job polarisation and, in some cases, still increasing unemployment.. £. There was a return to upgrading employment expansion in most of northern Europe as well as in Ireland and the UK.. But, after 2011, job polarisation was much more pervasive than in the expansionary period before 2008, and unemployment continued to grow in many cases (though often more moderately). Those are the broad patterns of structural change of the European working age population inside and outside the labour market. They describe how each of the magnitudes in the seven-fold classification of the working age population changed over time, without trying to identify links between them. How are developments in inactivity and unemployment linked to the patterns of change in the structure of employment? Is job polarisation associated with more or less growth in unemployment or inactivity? Or with structural upgrading, or the relative expansion of middle quintiles?. The link between inactivity and the structure of employment is the most complicated one. Being inactive literally means being outside the labour market. This can be more or less permanent (arising from disability, for instance), linked to a life course stage (young people are more likely to be in education, older people are more likely to be retired) or to changing economic conditions (some people can move in or out of the labour force depending on their family income or their perceived prospects, depending on labour market conditions). Each of these types of inactivity can be very differently associated with the patterns of structural change in employment. For instance, a person’s first entry into the labour market can be associated with relatively lower-paid jobs, but that will strongly depend on the level of education of the entrant (for example, people who enter late because they pursue a Masters of Business Administration are likely to enter directly into high-paid occupations). People leaving employment altogether (retiring) could come from any type of job; but since the focus here is on early retirement (the analysis is restricted to the working age population), it is likely to be more frequent in relatively well-paid jobs that offer better preretirement options. Only for the working age population who move in and out of the labour market depending on general economic conditions might there be some link between developments in inactivity and employment. This most likely affects the bottom quintiles (since a detachment from employment can negatively affect occupational prospects). The results shown in Figures 2, 3 and 4 illustrate this difficulty of linking the trends in inactivity and developments in different labour market segments. In most cases, the inactive population increased over the 1995–2007 period, especially in Finland, France and Sweden; only in the Netherlands did it decrease significantly over those years. In the first crisis period, the inactive population tended to increase even more generally and significantly, particularly in Finland, Italy and the Netherlands, but there are significant exceptions such as Germany and Sweden. After 2011, inactivity expanded significantly only in Denmark and Finland. But the main point is that this study cannot find any clear link between the change in the number of inactive people and the different patterns of structural change in employment when looking at the net change figures over the three periods. Unemployment, on the other hand, should be much more directly linked to developments in the employment structure. By definition, unemployment is a temporary separation from employment that should be over as soon as the unemployed person finds a suitable job. Both the risks of losing a job and the chances of finding another job are likely to be unequally distributed throughout the employment structure, as shown by the patterns of structural change displayed in Figures 2, 3 and 4.. 15.
(22) Employment transitions and occupational mobility in Europe: The impact of the Great Recession. Employment losses are concentrated in mid- and lowpaid jobs. The highest-paid jobs underwent quite a consistent expansion over the whole period, with very few cases of net job destruction even when the crisis was at its worst. Particularly in the first period of the crisis and, in many cases, in the second period, too, there was a simultaneous net destruction of mid-paid jobs and an increase in unemployment, which suggests that the latter could have been fed mostly from the former. But until the actual transitions are examined, this is not certain. It could be that those displaced from the middle managed to get low-paid jobs, and, therefore, those finding themselves without jobs came from the low rather than the middle quintiles. As for employment opportunities, the strong expansion of well-paid jobs in the good years and their resilience in the bad years suggests that there would be more opportunities at the top. But, again, until the actual transitions are examined, this is not proven. Although, in the initial period, unemployment declined and good jobs expanded simultaneously in most cases, the link between these trends is far from clear. It could be that the unemployed found low-paid jobs and moved up the occupational ladder later or that the people displaced by them did. It seems plausible that many of the new recruits into the highest-paid occupations would come directly from inactivity because these are roles that are likely to demand a high level of education. Some of the fastest-growing occupations are highly qualified professions such as doctors or teachers.. 16. The last point raises an important policy issue. Is there a trade-off between unemployment and low-paid (or, in general, low-quality) employment? If so, a particular type of relationship might have been expected between developments in unemployment and the lowest wage quintiles shown in Figures 2, 3 and 4. In the 1995–2007 expansion, at least, unemployment should have declined most in those countries where the lowest quintiles grew faster, and vice versa. That was clearly not the case. There are many examples, in different European regions, where significant declines in unemployment were associated with less rather than more employment creation in the lowest quintiles. These include Denmark and Finland in the north and Italy and Spain in the south. In the Netherlands, unemployment declined as the bottom quintile grew, but inactivity declined even further. In Germany, unemployment grew about as much as employment in the bottom quintile (although it could be argued that without that, it would have grown even more). In Belgium and the UK, it was not the lowest but the second-lowest quintile that expanded while unemployment declined. So, at least superficially, the simple narrative of a trade-off between unemployment and the creation of low-paid jobs does not fit the net change findings..
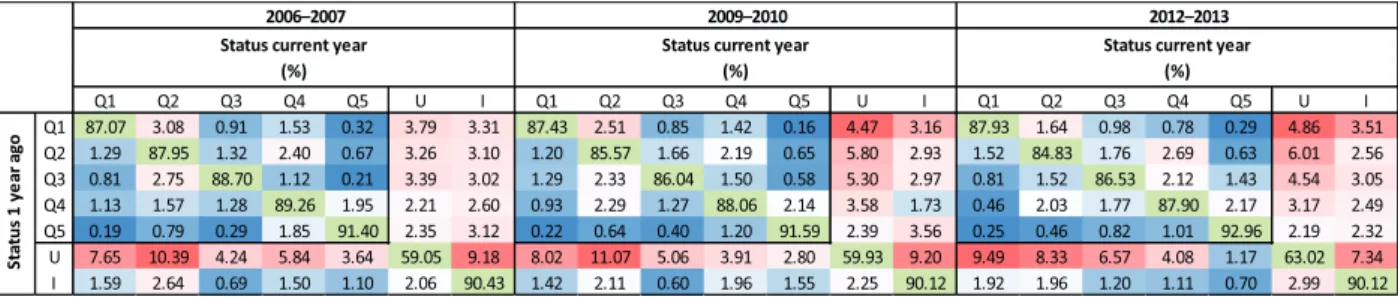
(23) 4 Impact of the crisis on occupational and employment transitions In this chapter, the EU-SILC longitudinal data are used to analyse the individual-level yearly transitions between inactivity, unemployment and jobs of different quality in six European countries before and after the Great Recession. The six countries are France, Italy, Poland, Spain, Sweden and the UK.. found a job in any of the five quintiles). For each country, three tables have been generated:. The main analytical device is the detailed observation of mobility tables representing the percentage of the working age population that, at the start of the period, was in a particular category (say, unemployed) and ended the period in any one of the seven categories (that is, remained unemployed, became inactive, or. £. one representing the mobility patterns before the crisis (2006–2007);. £. another immediately after the crisis (2009–2010);. £. a third in the second period of the crisis or beginning of the recovery, depending on country (2012–2013).. The three mobility tables for each country are shown in Tables 2–7. To facilitate the visual inspection and interpretation of the tables, colour gradations have been added to the cells according to the values (red for the highest values and blue for the lowest; the diagonals representing no change in the initial position are shown in green).. Table 2: Mobility tables – France. Status 1 year ago. 2006–2007 Status current year (%) Q1 Q1 87.07 Q2 1.29 Q3 0.81 Q4 1.13 Q5 0.19 U 7.65 I 1.59. Q2 3.08 87.95 2.75 1.57 0.79 10.39 2.64. Q3 0.91 1.32 88.70 1.28 0.29 4.24 0.69. Q4 1.53 2.40 1.12 89.26 1.85 5.84 1.50. Q5 0.32 0.67 0.21 1.95 91.40 3.64 1.10. 2009–2010 Status current year (%) U 3.79 3.26 3.39 2.21 2.35 59.05 2.06. I 3.31 3.10 3.02 2.60 3.12 9.18 90.43. Q1 87.43 1.20 1.29 0.93 0.22 8.02 1.42. Q2 2.51 85.57 2.33 2.29 0.64 11.07 2.11. Q3 0.85 1.66 86.04 1.27 0.40 5.06 0.60. Q4 1.42 2.19 1.50 88.06 1.20 3.91 1.96. Q5 0.16 0.65 0.58 2.14 91.59 2.80 1.55. 2012–2013 Status current year (%) U 4.47 5.80 5.30 3.58 2.39 59.93 2.25. I 3.16 2.93 2.97 1.73 3.56 9.20 90.12. Q1 87.93 1.52 0.81 0.46 0.25 9.49 1.92. Q2 1.64 84.83 1.52 2.03 0.46 8.33 1.96. Q3 0.98 1.76 86.53 1.77 0.82 6.57 1.20. Q4 0.78 2.69 2.12 87.90 1.01 4.08 1.11. Q5 0.29 0.63 1.43 2.17 92.96 1.17 0.70. U 4.86 6.01 4.54 3.17 2.19 63.02 2.99. I 3.51 2.56 3.05 2.49 2.32 7.34 90.12. Q2 0.46 88.22 0.53 0.30 0.13 4.33 1.27. 2012–2013 Status current year (%) Q3 Q4 Q5 0.22 0.14 0.20 0.37 0.29 0.06 90.77 0.57 0.32 0.38 92.63 0.26 0.11 0.41 92.34 2.58 2.58 2.25 1.11 1.15 1.28. U 8.36 6.30 3.95 3.30 2.43 60.74 7.24. I 5.74 4.34 3.67 2.87 4.35 20.37 85.59. Notes: Q1 = Quintile 1, Q2 = Quintile 2, etc.; U = unemployment ; I = Inactivity Source: EU-SILC (authors’ calculations). Status 1 year ago. Table 3: Mobility tables – Italy. Q1 Q1 85.51 Q2 1.13 Q3 0.55 Q4 0.77 Q5 0.38 U 5.74 I 1.31. Q2 1.51 88.87 1.15 0.72 0.47 5.25 1.15. 2006–2007 Status current year (%) Q3 Q4 Q5 0.91 0.80 0.61 1.29 0.84 0.36 90.65 1.08 0.70 1.29 90.17 0.73 0.85 0.70 92.35 3.58 3.35 2.27 1.05 0.96 1.04. U 4.19 2.91 1.83 1.82 1.52 55.17 5.63. I 6.46 4.60 4.03 4.50 3.73 24.64 88.86. Q1 86.57 0.84 0.40 0.40 0.35 6.27 1.70. Q2 0.94 88.39 0.33 0.39 0.26 5.57 1.34. 2009–2010 Status current year (%) Q3 Q4 Q5 0.80 0.36 0.23 0.63 0.36 0.47 91.43 0.81 0.45 1.10 91.10 0.46 0.59 0.56 92.65 3.61 3.34 3.26 1.23 1.08 1.50. U 4.92 4.45 2.62 2.30 1.65 55.70 6.25. I 6.18 4.86 3.97 4.26 3.96 22.25 86.90. Q1 84.88 0.42 0.19 0.25 0.22 7.15 2.36. Notes: Q1 = Quintile 1, Q2 = Quintile 2, etc.; U = unemployment ; I = Inactivity Source: EU-SILC (authors’ calculations). 17.
(24) Employment transitions and occupational mobility in Europe: The impact of the Great Recession. Status 1 year ago. Table 4: Mobility tables – Poland. Q1 Q1 77.43 Q2 2.03 Q3 1.52 Q4 2.02 Q5 0.52 U 9.50 I 2.43. Q2 2.86 83.61 2.81 1.40 0.42 7.76 2.72. 2006–2007 Status current year (%) Q3 Q4 Q5 2.83 2.83 1.14 3.58 1.90 0.33 81.20 5.00 1.98 4.92 80.86 4.67 1.39 4.22 89.45 9.01 3.77 0.90 1.78 1.11 0.92. U 7.21 3.35 4.47 2.95 0.64 55.38 5.45. I 5.71 5.21 3.02 3.17 3.36 13.67 85.59. Q1 82.85 1.30 1.48 1.27 0.44 9.73 2.48. Q2 1.71 88.78 1.45 0.94 0.19 6.26 2.26. 2009–2010 Status current year (%) Q3 Q4 Q5 1.39 2.09 0.54 1.93 1.07 0.29 85.16 2.71 0.85 2.15 88.32 1.68 0.28 1.75 93.98 9.20 4.00 1.26 1.83 1.14 0.85. U 6.18 2.76 5.19 2.72 1.03 48.66 3.57. I 5.25 3.87 3.17 2.92 2.34 20.88 87.88. Q1 85.04 1.39 1.03 0.99 0.53 10.35 2.50. Q2 1.27 89.76 0.80 1.13 0.09 6.68 1.35. 2012–2013 Status current year (%) Q3 Q4 Q5 1.37 0.83 0.83 1.20 0.59 0.25 90.62 0.82 0.81 1.16 91.12 1.34 0.27 0.68 95.22 5.09 2.87 1.66 1.26 0.96 1.11. U 6.87 3.88 3.51 2.92 1.63 61.44 4.43. I 3.79 2.93 2.40 1.34 1.59 11.91 88.39. Q2 3.23 74.49 3.89 2.94 1.66 7.12 2.18. 2012–2013 Status current year (%) Q3 Q4 Q5 5.43 1.12 0.83 2.68 2.07 0.47 78.65 2.73 1.50 4.53 79.40 2.44 1.52 2.41 87.21 4.13 3.01 1.42 0.94 1.22 0.90. U 12.14 15.15 10.12 7.40 4.69 66.05 13.73. I 5.02 2.79 2.07 2.47 1.82 12.89 78.20. Q2 6.03 68.45 10.54 3.93 4.21 12.67 5.29. 2012–2013 Status current year (%) Q3 Q4 Q5 2.42 3.28 0.66 11.05 4.42 3.89 70.16 3.85 9.34 3.06 80.77 7.13 9.62 7.55 75.85 6.23 2.69 1.71 2.70 4.16 1.80. U 3.46 3.23 2.18 0.97 0.56 43.57 8.57. I 5.37 5.27 1.81 2.91 1.30 16.13 71.15. Q2 4.35 76.48 6.50 2.11 2.20 13.07 3.26. 2012–2013 Status current year (%) Q3 Q4 Q5 2.78 2.69 2.65 6.54 2.68 2.16 72.18 5.15 6.84 5.59 77.38 6.93 6.37 6.04 77.35 5.33 3.68 3.04 2.36 1.71 1.88. U 2.27 2.89 1.55 0.73 1.41 42.42 5.82. I 8.24 4.21 5.10 3.56 4.13 22.89 78.16. Notes: Q1 = Quintile 1, Q2 = Quintile 2, etc.; U = unemployment ; I = Inactivity Source: EU-SILC (authors’ calculations). Status 1 year ago. Table 5: Mobility tables – Spain. Q1 Q1 74.23 Q2 5.08 Q3 1.85 Q4 2.77 Q5 0.38 U 10.42 I 3.59. Q2 5.45 71.41 6.98 5.96 0.80 11.40 2.97. 2006–2007 Status current year (%) Q3 Q4 Q5 2.13 4.00 0.79 6.19 6.27 1.40 75.35 4.82 2.65 3.87 77.15 4.55 1.74 5.14 87.06 7.60 5.86 3.63 1.22 2.06 2.05. U 7.01 6.05 5.69 3.39 1.99 41.20 6.00. I 6.38 3.60 2.66 2.31 2.90 19.89 82.11. Q1 72.91 3.28 2.13 2.19 0.24 9.96 2.85. Q2 3.06 76.65 2.43 1.99 0.68 4.00 1.60. 2009–2010 Status current year (%) Q3 Q4 Q5 3.04 2.30 0.41 3.58 2.31 0.79 78.04 2.35 1.63 4.78 76.93 4.23 1.32 2.33 90.34 6.97 3.01 2.92 0.95 1.19 1.81. U 14.26 9.73 11.71 7.99 3.23 60.65 9.67. I 4.01 3.66 1.72 1.89 1.87 12.48 81.92. Q1 72.24 2.37 1.05 0.82 0.69 5.39 2.83. Notes: Q1 = Quintile 1, Q2 = Quintile 2, etc.; U = unemployment ; I = Inactivity Source: EU-SILC (authors’ calculations). Status 1 year ago. Table 6: Mobility tables – Sweden. Q1 Q1 77.08 Q2 4.13 Q3 3.71 Q4 3.05 Q5 1.20 U 17.07 I 8.46. Q2 3.80 73.21 7.50 2.89 1.02 8.26 4.42. 2006–2007 Status current year (%) Q3 Q4 Q5 4.66 3.53 1.87 11.65 3.72 1.97 71.91 7.02 5.02 5.57 74.62 9.22 6.16 10.35 78.41 9.89 4.62 6.09 3.96 4.19 2.81. U 3.32 1.62 1.21 1.29 0.72 28.97 6.34. I 5.75 3.71 3.63 3.36 2.15 25.09 69.82. Q1 78.82 4.10 3.53 4.05 1.02 14.37 6.66. Q2 4.20 72.10 7.93 6.26 3.79 10.32 4.37. 2009–2010 Status current year (%) Q3 Q4 Q5 2.63 4.66 1.46 6.65 6.15 2.66 74.74 5.39 3.91 3.03 71.57 10.37 2.54 11.44 78.08 3.69 6.01 3.53 2.23 3.17 2.19. U 2.62 4.31 2.43 1.73 1.22 43.25 8.50. I 5.60 4.03 2.08 2.99 1.90 18.82 72.88. Q1 78.77 3.68 2.11 1.23 0.89 17.01 6.33. Notes: Q1 = Quintile 1, Q2 = Quintile 2, etc.; U = unemployment ; I = Inactivity Source: EU-SILC (authors’ calculations). Status 1 year ago. Table 7: Mobility tables – UK. Q1 Q1 83.80 Q2 2.21 Q3 2.24 Q4 1.69 Q5 0.82 U 14.18 I 8.38. Q2 2.64 84.39 1.98 1.20 1.95 11.52 3.07. 2006–2007 Status current year (%) Q3 Q4 Q5 1.64 1.25 1.06 1.93 1.89 2.69 88.06 1.02 1.87 0.64 87.86 3.57 1.25 2.74 89.41 6.57 5.61 3.62 1.21 3.25 1.01. U 1.20 1.90 0.93 0.54 0.44 32.15 3.06. I 8.42 4.98 3.90 4.48 3.39 26.35 80.01. Q1 78.41 4.49 2.34 3.91 1.94 13.86 6.81. Q2 4.16 73.53 5.43 5.29 3.89 8.40 2.96. 2009–2010 Status current year (%) Q3 Q4 Q5 1.67 3.71 1.01 3.85 5.55 3.64 77.00 2.76 5.11 2.03 76.19 5.91 4.84 7.55 76.35 4.52 2.65 2.11 1.25 2.96 1.17. Notes: Q1 = Quintile 1, Q2 = Quintile 2, etc.; U = unemployment ; I = Inactivity Source: EU-SILC (authors’ calculations). 18. U 2.31 2.47 3.04 1.44 1.44 35.90 5.19. I 8.74 6.46 4.31 5.23 4.00 32.56 79.66. Q1 77.02 5.04 2.68 3.70 2.50 9.56 6.81.
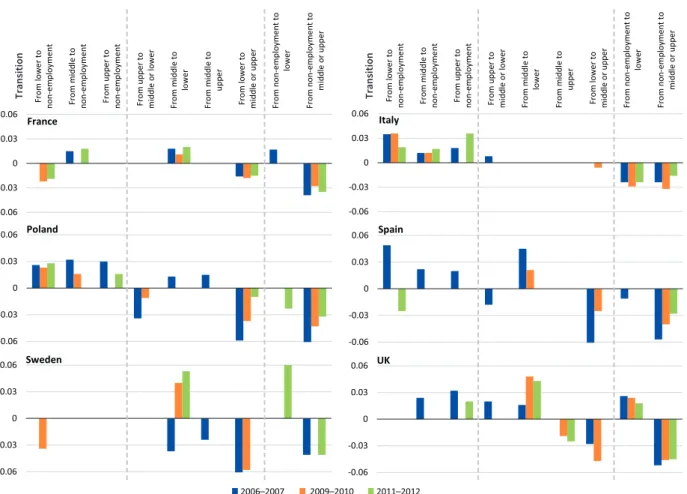
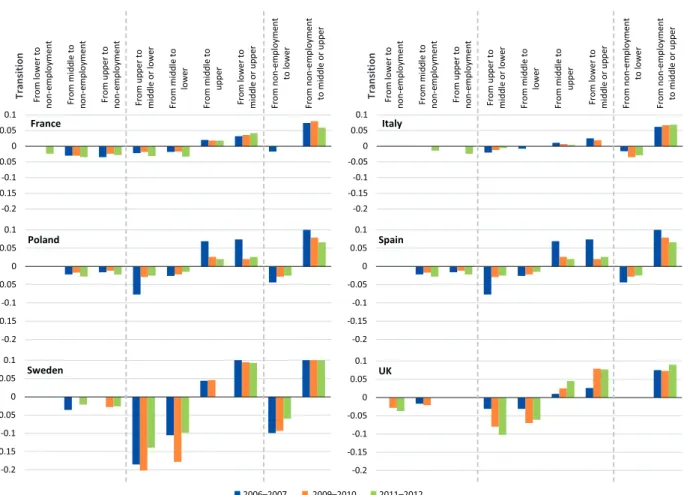
(25) Impact of the crisis on occupational and employment transitions. Transitions into and out of inactivity Transitions into and out of inactivity are represented in the mobility tables in the lowest row and the last column. The lowest row shows transitions from inactivity – how many people who were inactive in the initial year of each transition window had moved into another category one year later. The last column shows transitions into inactivity – how many people initially in any one of the seven possible categories were in the inactive category one year later. The following observations can be made.. £. The persistence of unemployment is much lower than that of inactivity, although there are very significant differences between countries, ranging from around 30% in Sweden and the UK to around 60% in France and Italy. In most countries, this persistence increased significantly in the second and third periods as a result of the crisis. The increase is particularly striking in Spain, where the share of unemployed who could not find a job in the one-year windows observed rose from 41% to 66% (Table 5).. £. Flows into and out of unemployment are strongly skewed towards the bottom of the occupational structure everywhere. The chances of finding a job in the bottom quintiles are at least two or three times higher than the chances of finding a job at the top. The differential chances of losing one’s job are even more skewed, although there are significant flows between unemployment and the other quintiles, too, in all the periods. The countries where there is more fluidity between unemployment and low-paid jobs (in both directions) are Poland and Spain. In Sweden and the UK, there are significant flows between unemployment and low-paid jobs but fewer flows in the other direction; instead, in these countries there is more fluidity between jobs (see below).The impact of the crisis on unemployment is mostly through an increase in job losses (flows out of employment) rather than a decrease in the number of workers being hired (flows into employment), although both phenomena can be observed to some extent. So the net increase in unemployment observed after 2008 is more the result of more people being let go than of fewer people finding jobs, according to the analysis. Tables 2–7 also show that transitions from employment into unemployment remained skewed towards lowerpaid jobs, but with a significant increase in the second and third quintiles in some countries (particularly France and Spain), which corresponds to the negative polarisation observed for net change in Chapter 3.. £. Another interesting finding is that, although the overall chances of finding a job did not decline very significantly, they did become more skewed by quintile. This is shown more clearly in Figure 5, which shows the differences in transition rates from unemployment into Quintiles 1 and 2 (low-paid), and from unemployment into Quintiles 3, 4 and 5 (mid- and high-paid) between 2006 and 2014. Transitions from unemployment into mid-paid and well-paid jobs declined more significantly in all countries over the period than transitions into lower-paid jobs, with the exceptions of Spain and the UK, where transitions into lower-paid jobs declined significantly.. Inactivity is a very stable category of the working age population, much more stable than unemployment. In all countries and periods, more than 70% of those who started the period inactive remained so. This stability of the inactive population was not significantly affected by the crisis (again, in stark contrast with unemployment, as is discussed later). This persistence of inactivity is significantly higher in France, Italy and Poland (around 90%), and particularly low in Sweden (around 70%). Flows into and out of inactivity are slightly skewed towards the bottom of the occupational structure, but again less so than for unemployment. It is interesting to see that flows into and out of inactivity are more skewed towards the lower quintiles in Sweden and the UK, which are otherwise the countries with the most mobility across quintiles, as will be seen later. Flows into and out of inactivity were also less affected by the crisis. Tables 2–7 show hardly any increase in flows into inactivity (despite the large drops in employment in many cases) and only a small decline in the observed flows from inactivity into employment. So, for inactivity, these results largely confirm earlier observations based on the discussion of recent net changes in labour markets. Developments in inactivity are less affected by the economic cycle, and the probabilities of moving in and out of inactivity are not strongly determined by occupational differentials.. Transitions into and out of unemployment Transitions into and out of unemployment are shown in the column and row labelled ‘U’ in Tables 2–7 and tell a very different story from the data on inactivity. In this case, both the effect of the cycle and the differentials across quintiles are much more significant. This leads to the following observations.. 19.
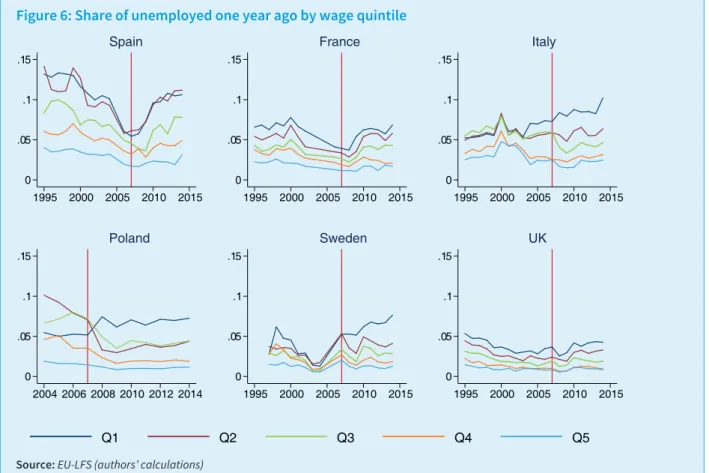
(26) Employment transitions and occupational mobility in Europe: The impact of the Great Recession. Figure 5: Transition rates from unemployment, by quintile of destination (two-year moving average) Spain. France. Italy. Poland. Sweden. UK. % from unemployment into different quintile. .3. .2. .1. .3. .2. .1 2006 2008 2010 2012 2014 2006 2008 2010 2012 2014 2006 2008 2010 2012 2014. Into low quintile. Into middle or high quintile. Source: EU-SILC (authors’ calculations). Box 1: Transitions from unemployment to employment (EU-LFS data) While EU-SILC data make it possible to measure labour market flows properly (with the exception of those taking place within the same job/occupation), its limited sample size and time coverage represent constraints. The EU-LFS can complement the main findings of the current analysis by extending considerably the period of analysis and by exploiting a much larger sample size. However, EU-LFS data make it possible only to measure pseudo-flows in the labour market by making use of retrospective questions, since the EU-LFS lacks the same panel structure of EU-SILC. Figure 6 shows the share of unemployed one year ago 8 by quintile for the six countries investigated in this report. With the exception of Poland, for which data are available only since its accession to the EU in 2004, the time period covered is from 1995 to 2015. Since the beginning of the recession in 2007 (indicated by the red vertical line), the share of unemployed increased in the year before the survey in every country with the exception of Poland and the UK. This is particularly marked in Spain and to a lesser extent in France, Italy and Sweden, where it is clear that the increase was driven by the dynamic of the lowest quintile(s). This confirms that, during the crisis, low-paid jobs increasingly offered more employment opportunities for those who were in a situation of non-employment. Long-term trends reveal heterogeneous patterns. A process of convergence in the share of unemployed people one year before by wage quintile is apparent between 1995 and the beginning of the crisis, particularly in France and Spain (the situation of Poland is more difficult to assess due to a shorter time coverage). In the case of Italy and Sweden, it seems that a break in the series occurred a few years before, in the early 2000s.. 8. 20. The variable WSTAT1Y is used to compute the share of unemployed one year ago (that is, one year before the interview). Because of conceptual differences, WSTAT1Y should be directly compared with the variable MAINSTAT (main labour status) and not with the variable ILOSTAT (ILO work status), which is also used to construct the wage quintiles. However, for the purposes of this study, it was found that the two measures produce similar patterns..
(27) Impact of the crisis on occupational and employment transitions. Figure 6: Share of unemployed one year ago by wage quintile Spain. France. Italy. .15. .15. .15. .1. .1. .1. .05. .05. .05. 0. 0 1995. 2000. 2005. 2010. 2015. 0 1995. 2000. Poland. 2005. 2010. 2015. 1995. Sweden .15. .15. .1. .1. .1. .05. .05. .05. 0 2004 2006 2008 2010 2012 2014. Q1. 2005. 2010. 2015. 2010. 2015. UK. .15. 0. 2000. 0 1995. 2000. 2005. Q2. 2010. Q3. 2015. 1995. Q4. 2000. 2005. Q5. Source: EU-LFS (authors’ calculations). Looking at individual-level transitions, there is a significant amount of fluidity between unemployment and low-paid jobs in most countries and across all periods. But the actual implications of this fluidity for the employment chances of workers can vary significantly across countries because of other observable differences. Only in Sweden and the UK is there a significant degree of mobility between quintiles that suggests the possibility that an entry into a low-paid occupation can lead to a later move up the occupational ladder. This finding is reinforced by the fact that, in these countries, the flows from employment into unemployment are much lower. In Poland and Spain, however, the high degree of fluidity between unemployment and low-paid jobs works both ways, suggesting a dual labour market with very unstable employment trajectories at the bottom of the occupational structure. In France and Italy, the results suggest a similar dynamic, although to a much lesser extent.. stability across quintiles more broadly by looking at the evolution of tenure according to EU-LFS data). £. Persistence in the same quintile for at least a year is generally high (much higher than persistence in unemployment, for instance). But, again, the differences between countries are very significant. They are highest in France and Italy, and lowest in Spain, Sweden and the UK.. £. Persistence in the same quintile tends to be slightly higher in the higher quintiles, but this varies a lot. There are big differences in Spain (87% in Q5 versus 74% in Q1) and Poland (89% in Q5 versus 77% in Q1) in 2006–2007, for instance, and very small differences in Sweden, France and the UK. In Sweden and the UK, in fact, in some periods there is more persistence in low-paid jobs than in high-paid ones.. £. Looking specifically at the patterns of mobility (that is, cells outside the diagonal), even bigger differences can be seen. Flows between quintiles are very low in France and Italy, even between adjacent ones, while they are very significant in Sweden and the UK, and in Spain before the crisis.. £. The crisis did not have a significant effect on the rate of persistence in the same quintile, but it did decrease significantly the transitions between quintiles in Italy, Poland and Spain. In the UK, persistence in the same quintile declined and flows between quintiles grew after 2008, unlike in other countries.. Transitions between quintiles Transitions between quintiles are shown in the five first rows and columns (labelled Q1–Q5) of Tables 2–7. It is important to bear in mind that the focus is on transitions between jobs that are classified as belonging to the different quintile according to their average wages; in other words, some workers may change jobs within the same quintile and they would not be classified as significant transitions (Box 2 discusses job. 21.
Figure


+7


Documento similar
In the previous sections we have shown how astronomical alignments and solar hierophanies – with a common interest in the solstices − were substantiated in the
The participation gap, which is the difference between the employment-to-population ratio at the potential (full) and actual levels of employment in a given year is derived
In the preparation of this report, the Venice Commission has relied on the comments of its rapporteurs; its recently adopted Report on Respect for Democracy, Human Rights and the Rule
The exhibition and the catalogue provide a series of samples that exemplify a phase in the ongoing dialectic between local identities versus connected and communicative
Despite the sharp slowdown in recruitment in the public sector since 1983, this sector remains a key employer in the Moroccan labour market with a share of 22% of total employment
The main challenges related to the employment and labour market can be summarized in some aspects, for example, the job creation has been one of the most noticeable
The particular effect of FDI on male employment rates shown in column one indicates that FDI has a positive and significant effect on total employment rate in
In the “big picture” perspective of the recent years that we have described in Brazil, Spain, Portugal and Puerto Rico there are some similarities and important differences,
