Factors affecting survival of new firms in the financial crisis: the role of the local milieu
8
0
0
Texto completo
(2) Proceedings of the 2013 International Conference on Economics and Business Administration. • Localized proximity relationships that enhance the productivity of local factors. Both, the human personal characteristics and the institutional environment shape intentions of individuals into performing certain entrepreneurial behavior. The combination of all them determines the entrepreneurial environment. This environment refers, on the one hand, to the overall economic, socio-cultural and political factors that influence people’s willingness and ability to undertake entrepreneurial activities. On the other, it refers to the availability of assistance and support services that facilitate the start-up process [10].. • Cultural elements and values that determine local structures and define local identities. • Rules, norms and practices that define a local governance model This new approach is based in the complex relationships which influence how economic agents perceive economic reality, are receptive to external stimuli, react creatively and are able to cooperate. Local trust and creativity, a sense of belonging, creativity and connectivity are more and more interpreted as key factors for local growth [20].. In the knowledge-driven economies, firms are usually engaged in cooperative processes with other local firms, economic agents and the public administration for the conception and provision of specific resources and external assets that cannot be easily obtained via market developments [11].. The seed of this approach was in the GREMI approximation to local innovative environments [21] [22] [23] [24] [25] [26]. The innovative milieu consists of shared values, common representations and codes, a strong sense of belonging, trust, common professional background and economic specialization that help firms and entrepreneurs to achieve a better economic performance. The distinctive factor of an innovative milieu is the significance of social capital on the innovation process. In particular, the development of relational networks based on confidence, formalized in cooperative innovation projects and geared towards generating and disseminating knowledge.. This process of strategic cooperation is facilitated by specific territorial conditions. When a particular richness of interfirm interactions of untraded interdependencies exists, they generate cumulative learning processes enhancing the innovativeness and competitiveness of a local territorial system [12]. The endogenous development literature has promoted a more cognitive approach to innovation and local growth processes. This approach illustrates innovation and entrepreneurship as the consequence of collective leaning processes and the existence of common rules, codes and norms of behavior. The most prominent feature of this cognitive approach is that space becomes a source of knowledge creation, since it embeds channels of knowledge transfer and thus collective learning provides local firms with positive external effects on factor productivity.. In the innovative milieux, knowledge and information are transferred by a high level of labor market mobility, by intense innovative interactions between customers and suppliers and by firm spin-offs. So, through strategic alliances and nonequity cooperation agreements, firms learn through this kind of network cooperation.. So, literature on regional economics is increasingly giving attention to intangible, atmosphere-type, local synergy and governance factors, as social capital [13] [14], relational capital [15] [16] or knowledge assets [17] [18].. Moreover, the local milieu acts as an uncertainty-reducing operator which works through cooperation, sharing and collective learning [27]. The functions of informationgathering, the codification of knowledge and the selection of decision-making routines are undertaken in a more socialized and collective way than in the case of the R&D departments in isolated firms, because information rapidly circulates and productivity rises because of geographical proximity.. Recently, the concept of territorial capital is emerging. According to reference [19], each area has a specific capital — its territorial capital — that is distinct from that of other areas and is determined by many factors. These factors may include the area’s geographical location, size, inputs endowment, climate, traditions, natural resources, quality of life or the agglomeration economies provided by its cities. They may also include its business incubators and industrial districts or other business networks that reduce transaction costs. And other factors may be untraded interdependencies such as understandings, customs and informal rules that enable economic actors to work together under conditions of uncertainty. Lastly, there is an intangible factor —the environment — which is the outcome of a combination of institutions, rules, practices, producers, researchers and policymakers that make a certain creativity and innovation possible.. Learning in a milieu takes place in a spontaneous and socialized manner within the local labor market through forms of stable and enduring collaboration between customers and suppliers based on loyalty and trust. These relations produce a transfer of codified and tacit knowledge between them which triggers processes of innovation and specific technological trajectories. In a turbulent environment characterized by difficulty in information collection, processing and assessment, strong interdependence between the decisions of different actors and great complexity in the external environment, economic actors fins in the local milieu the necessary support for coping with uncertainty [28].. Therefore, this concept goes far beyond a specific space and it refers to a system of:. II.. • Pecuniary and technological externalities. CONTEXT ANALYSIS. Despite the ubiquitous existence of policies promoting entrepreneurship, the rates differ widely among places because, as far as economic activity tends to cluster geographically,. • Localized production activities, skills and know-how. 173.
(3) Proceedings of the 2013 International Conference on Economics and Business Administration. variables – taking the value of 1 when the characteristic is present and 0 otherwise. These five components were:. entrepreneurship also tends to concentrate. And some cities are increasingly becoming competing actors on the global scene, given their nature of clusters of public goods and externalities and enhancers of interaction and local synergies. Entrepreneurship is becoming a local affair because the location of an agent matters for the decision to start a firm and the local level of current start-up activity has a positive effect on the likelihood to become an entrepreneur [29]. In addition, the local social environment is also highly significant for entrepreneurship [30].. • The entrepreneur regards BA staff as an agent of innovation • The entrepreneur considers that cooperative network created and managed by BA favors the development of strategic alliances • The entrepreneur considers that cooperative network created and managed by BA is a mechanism for knowledge dissemination. We have seen that the economic literature on innovative environments identifies the presence of a set of elements that are decisive in improving the competitive performance of the firms that belong to it: a particular geographical area, a set of actors, several tangible, intangible and institutional common elements; and even more important, the ability to share an organizational logic, a learning system and a relational culture.. • The experience of cooperation with BA allows an entrepreneurial environment to be shared with other firms • This interaction generates a common shared culture. Following the same methodology, the Innovative Behavior indicator (IB) also takes values from 0 to 5. In this case, the dummy variables were:. We focus our research in the city of Barcelona (Spain), one of the smartest European cities, with a high entrepreneurship rate. In a previous research [31], we detected the presence and intensity of those strategic elements among the entrepreneurs that develop their new firms with the support of Barcelona Activa (BA), the local development agency of the Barcelona City Council.. • The firm develops ICT-based innovations • The firm has established strategic alliances with other firms located in BA’s facilities • There are knowledge generation and dissemination links with these firms. The fieldwork consisted of a combination of complementary techniques, both qualitative and quantitative, and was carried out over a one-year period (April 2005 to April 2006). From a qualitative point of view, we conducted 22 indepth interviews with entrepreneurs belonging to the core network of BA. Six of them were subsequently used in the questionnaire design, while the rest served for confirmatory purposes. Moreover, the research team held seven interviews with different key staff members of BA. Finally, a total of three different focus groups were held. In them, entrepreneurs and experts discussed financing entrepreneurship, innovation and training, and networking and e-commerce.. • The firm has established cooperation agreements in order to develop innovations with suppliers, clients or scientific institutions • The firm develops economic activities with competitors. The combination of these two categories leads us to identify the three different profiles of firms that will allow the scope and effects of the innovative milieu to be evaluated. The names we have given to these profiles are the following: Milieu Effect, Milieu Seeker and Milieu Unaware. Two indicators were used as a proxy to highly successful companies. The first corresponds to the High Business Success (HBS) Indicator, which is a dummy variable taking the value of one when the next conditions are met:. For the quantitative analysis we conducted a survey among the population of entrepreneurs who lead a company that usually interacts with BA, a group that we define as the core network (256 individuals); that is, those that could be considered part of the environment created by BA. The questionnaire was administrated by e-mail, with a 52.4% response rate of the population under study (136 questionnaires). This response rate falls within the usual limits of online surveys [32] and, under the hypothesis of a random sample, this would mean a precision of +/–4.87% for a situation of maximum uncertainty (p=q =0.5) and a confidence level of 95%.. • The company expects profits in the year of the survey. • Both the expected turnover and the number of full-time employees increase with respect to the previous year, or one of the two increases while the other remains constant. The second corresponds to the High Quality Job Creation (HQJC) Indicator, which is also a dummy variable taking the value of one when: • The company pays medium-high salaries, that is, the gross wage per employee equals or exceeds the average salary in Spain (18,000 EUR per year).. In order to better appreciate the scope of the innovative environment, we built two variables that gather, on the one hand, the entrepreneur’s perception of the innovative environment; and, on the other, the innovative behavior of the firm he or she owns.. • The company shows a positive one-year evolution in the total number of full-time employees.. In order to build the Perception of the Innovative Environment indicator (PIE), five subjective considerations were taken into account. By adding them we obtain an indicator with values from 0 to 5, as all of them were dummy. To be included in the Milieu Effect category, a firm must show a medium-high level of innovative behavior and its leader must show a medium-high perception of innovative environment. This group represented 22,1% of the whole. 174.
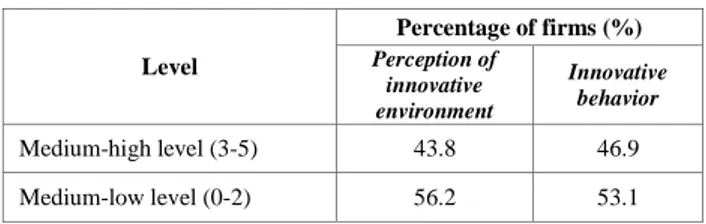
(4) Proceedings of the 2013 International Conference on Economics and Business Administration. growth. All these facts lead to very discrete global performance indicators (HQJC and HBS).. population under study. The Milieu Seeker category encompasses those cases with medium-low innovative behavior and medium-high innovative perception. It had a similar importance in the whole population (21.3%). Finally, the Milieu Unaware category groups those cases in which innovative behavior is medium-high whereas perception remains medium-low. Its weighting is low (14.0%). In turn, these profiles identify three different types of companies (Table I).. TABLE I.. However, they rate interaction with BA’s environment very highly. And what is most important, given their weaknesses, they expect to improve their market success possibilities by taking the most advantage of the networking and knowledge transfer mechanisms provided by the environment. Finally, the Milieu Unaware profile encompassed a group with a very low propensity to interact with BA’s environment. Conversely, these firms show a high performance, good market position, significant innovation levels supported by ICT use, and, in some cases, high export rates. However, they did not develop innovative growth strategies while their performance indicators remained rather average. Despite the fact that a significant number of them were part of the incubator, firms in this group did not take advantage of BA’s environment opportunities, probably because, in their present situation, they did not perceive any benefit.. USE OF THE INNOVATIVE ENVIRONMENT AND FIRM DEVELOPMENT. Characteristics of the firma. Percentage of firms (%) Milieu Effect. Milieu Seeker. Milieu unaware. Total Sample. 43.3. 17.2. 31.6. 33.1. 63.3. 24.1. 47.4. 46.3. 43.3. 24.1. 47.4. 41.2. 63.3. 55.2. 63.2. 63.2. 43.3. 17.2. 21.1. 30.9. Performance High Quality Job Creation (HQJC) High Business Success (HBS). The main objective of this research is to identify the key factors that explain the survival or failure of the firms created with the support of in the BA’s environment and policies. As far as the financial crisis has dramatically impacted on the evolution of Spanish firms during recent years, our research could also provide information about the consequences of financial leverage on the probability of endurance of new firms.. Market openess Developing export activities Sales in non-local markets E-commerce sales Competitive strategy Cost leadership. 20.0. 28.6. 5.3. 20.7. Product differentiation. 50.0. 17.9. 52.6. 40.7. Specialization. 30.0. 53.6. 42.1. 38.5. New products and new markets. 33.3. 31.0. 5.3. 27.2. Strategic aliances. 20.0. 24.1. 0.0. 17.4. Group creation. 20.0. 6.9. 0.0. 7.4. Network organisation. 20.0. 6.9. 5.3. 8.1. For this purpose it is necessary to analyze the economic and financial information of new firms. As a consequence, it has been investigated, in this second stage of the research, the business evolution during the period 2006-2011 of a sample of firms that in 2006 were located in the incubation spaces or were benefited from BA’s policies. In particular, we have examined the behavior of 64 new firms in the worst period of financial crisis and economic downfall in Spain.. Growth strategy. a.. According to economic activity, 39.1% of firms are developing activities in the ICT sector and the rest are included in different categories of the tertiary sector (mainly, personal or business services). Table II shows the distribution of the sample according to the described categories.. Source: Lladós et al. (2009). TABLE II.. Firms with a Milieu Effect profile were the most likely to show innovative forms of growth, both within a group or in a network. Their most common strategy was based on product differentiation, whereby they were the most frequent users of the internet for commercial purposes. Indeed, better use of the environment is distinctly related to the presence of good performance levels, as long as both the HQJC and the HBS indicators stay above the total population average and above the rest of the profiles under study.. DISTRIBUTION OF THE SAMPLE Percentage of firms (%). Milieu Effect. Milieu Unaware. Milieu Seeker. Rest. 26.56. 20.31. 17.19. 35.94. Depending on the values of the PIE and IB indicators, it can be observed that, in the sample of new firms, innovative behavior is slightly higher than the perception of innovative milieu (see Table III) whereas the medium-high level is a minority in both cases (46.9% and 43.8%, respectively).. Companies with a Milieu Seeker profile were in a consolidation stage. They faced some difficulties in developing their business as well as in their competitive position. Their low presence in international markets was accompanied by lower success levels as well as product differentiation weaknesses. They almost never use the internet for commercial purposes; nor have they manifested any innovative forms of. 175.
(5) Proceedings of the 2013 International Conference on Economics and Business Administration. TABLE III.. • MFA: Value of Material Fixed Assets in 2011. It includes the investments of the firm in equipments, machinery, buildings and other assets.. INNOVATIVE PERCEPTION AND INNOVATIVE BEHAVIOR Percentage of firms (%) Perception of innovative environment. Innovative behavior. Medium-high level (3-5). 43.8. 46.9. Medium-low level (0-2). 56.2. 53.1. Level. III.. • IFA: Value of Immaterial Fixed Assets in 2011. It includes the investments of the firm in non-tangible assets, as patents, goodwill or royalties. • FTA: Foreign trade activity. It takes value 1 when sales in foreign markets meant more than one-third of the commercial activity in 2006.. METHOD AND RESULTS. • ECA: E-commerce activity. It takes value 1 when firm was using internet as a sales channel in 2006.. Data collection was performed by means of the described web-based survey to entrepreneurs and also from the SABI database, which contains information about company accounts, ratios, activities, ownership and management of a wide sample of Spanish firms.. • ICT: It takes value 1 when firm develops its activity in this economic sector. The model also includes binary variables (dummies) to identify if the belonging of the firm to the MILIEU, UNAWARE or SEEKER groups influences the chances of survival.. Tests of the model were performed through a binomial logistic regression model (Logit). This type of regression analysis is used for predicting the outcome of a categorical dependent variable, based on a set of predictor variables. Model estimation was done with the maximum likelihood approach.. We predict the outcome variable SE using all these continuous and categorical variables. The categorical option specifies that rank is a categorical. The output is shown in sections, each of which is discussed below.. With the logistic regression we try to determine the impact of multiple independent variables presented simultaneously to predict the success or failure of the new firms.. Table V shows the overall test for the model that includes the predictors. The chi-square value of 34.98 with a p-value of less than 0.0005 tells us that the model as a whole fits significantly better than a model with no predictors.. Consequently, the dependent variable is SE (Successful Evolution). It takes value 1 when the turnover has increased in last five years and the net wealth is positive in 2011. The net wealth is calculated as the subtraction between assets and liabilities. The rate of success was 54.7% (Table IV).. TABLE V.. It takes value 0 when the firm has leaved the market, the income has decreased or the net wealth is negative at the end of the period. In particular, six of the firms included in the sample failed before their third year of life because of a poor business plan. TABLE IV.. Step 1. Percentage of firms (%) SE = 1. SE = 0. Number of firms. Milieu Effect. 52.9. 47.1. 17. Milieu Unaware. 76.9. 23.1. 13. Milieu Seeker. 36.4. 63.6. 11. Rest. 52.2. 47.8. 23. Total. 54.7. 45.3. 64. Chi-square. df. Sig.. Step. 34.979. 10. 0.000. Block. 34.979. 10. 0.000. Model. 34.979. 10. 0.000. The fit of the model is shown in tables VI and VII. The Model Summary table shows the results of the -2*log likelihood-ratio test (53.18). Small test values indicate a good fit as the fitted model deviates less from the saturated model. This result is confirmed by the two different measures of pseudo R-square. Both of them evidence the goodness-of-fit, indicating a moderately strong relationship between the predictors and the prediction.. FIRMS’ PERFORMANCE (2006-2011). Category. OMNIBUS TEST OF MODEL COEFFICIENTS. TABLE VI.. The independent variables in the model are the following:. b.. • LPROD: Level of labor productivity in 2011, determined as the quotient between sales and employment in the firm.. MODEL SUMMARY. Step. -2 Log likelihood. Cox & Snell R Square. Nagelkerke R Square. 1. 53.181b. 0.421. 0.563. Estimation terminated at iteration number 10 because parameter estimates changed by less than .001. As well as the goodness-of-fit statistics we want to look also at the proportion of cases the model classifies correctly. The Classification table tells us how many of the cases where the observed values of the dependent variable were 1 or 0 respectively have been correctly predicted. The 69.0% were. • DEBT: Level of indebtedness in 2011, determined as the quotient between debts and assets in the firm.. 176.
(6) Proceedings of the 2013 International Conference on Economics and Business Administration. correctly classified for the failure group and 85.7% for the success group. Overall 78.1% were correctly classified. TABLE VII.. CLASSIFICATION TABLE. According to the Wald criterion, the results demonstrated that some variables have a significant contribution to the prediction. In particular, the success of the new firms included in the sample seems to be associated to the fulfillment of high levels of labor productivity and the development of commercial activities in the foreign markets.. C. Predicted SE 0. 1. Correct. 0. 20. 9. 69.0. 1. 5. 30. 85.7. Observed Step 1. SE. Percentage. Overall Percentage. Not surprisingly, the financial leverage has also played a crucial role in the economic performance of firms. The context of recession and credit restriction has handicapped the evolution of the most indebted firms.. 78.1. Although physical capital investment does not affect the probabilities of success, those firms which stand out from the rest because their expenditure in intangible assets perform a less satisfactory evolution during the economic crisis.. c. The cut value is .500. Finally, Table VIII shows the Hosmer & Lemeshow test statistic. As the p-value is much greater than .05, the model prediction fits the observed data at an acceptable level, because well-fitting models show non-significance on this test. TABLE VIII.. Technology and sectoral specialization contribute also to the model, as the firms developing ICT activities exhibit a higher prediction of success. However, the use of internet as a sales channel has not been a certain protection against the economic recession for nascent firms.. HOSMER & LEMESHOW TEST. Step. Chi-square. df. Sig.. 1. 2.942. 8. 0.938. Firms with more innovative behavior or greater perception of innovative milieu in 2006 do not show statistically significant values in the prediction model. This is the case of firms included in the MILIEU, UNAWARE or SEEKER categories. Therefore, the interaction with the local environment has not been enough to improve the probabilities of success.. In Table IX we see the coefficients (B), the standards errors (S.E.), the Wald test statistic with associated degrees of freedom (df) and p-values (Sig.), and the exponential coefficient (Exp(B)) –also known as an odds ratio.. We conduct an analysis of variance (ANOVA) to test if differences in levels of productivity, indebtedness, sectoral specialization, intangibles endowment or foreign trade between MILIEU and the other categories could explain the nonsignificance of milieu effects in the logistic regression. The results are shown in Table X. Since differences in all the economic and financial variables among groups are not statistically significant, the poor influence of the milieu effects is confirmed.. The Wald statistic and associated probabilities provide information about the significance of each predictor in the equation and the Exp(B) column presents the extent to which raising the corresponding measure by one unit influences the odds ratio. If the value exceeds 1 then the odds of an outcome occurring increase and if the result is less than 1, any increase in the predictor leads to a drop in the odds of the outcome occurring. Therefore, the odds ratio is a measure of effect size. TABLE IX.. TABLE X.. B. S.E.. Wald. df. Sige. Exp(B). LPROD. 0.005. 0.002. 4.095. 1. 0.043. 1.005. DEBT. -0.035. 0.015. 5.343. 1. 0.021. 0.966. ICT. 2.155. 0.839. 6.604. 1. 0.010. 8.628. MFA. 0.003. 0.002. 1.297. 1. 0.255. 1.003. IFA. -.004. 0.002. 6.975. 1. 0.008. 0.996. FTA. 2.874. 1.401. 4.207. 1. 0.040. 17.706. Step Step 1d. VARIABLES IN THE EQUATION. ECA. -1.008. 1.298. 0.603. 1. 0.437. 0.365. MILIEU. 1.096. 0.997. 1.208. 1. 0.272. 2.992. UNAWARE. 1.577. 1.050. 2.256. 1. 0.133. 4.842. SEEKER. 0.678. 1.066. 0.405. 1. 0.524. 1.971. Constant. 0.656. 1.120. 0.343. 1. 0.558. 1.928. ANOVA ANALYSIS. Step. F valuef. Sig.. LPROD*MILIEU. 0.054. 0.817. DEBT*MILEU. 0.571. 0.453. ICT*MILIEU. 0.134. 0.715. IFA*MILIEU. 2.258. 0.138. FTA*MILIEU. 0.255. 0.616. f. Since Snedecor's F distribution derives from independent random variables with Chi-Squared distribution, F-value is asymptotically equivalent to a Chi-Squared test.. IV.. CONCLUDING DISCUSSION. Although from the point of view of a productive local system, BA cannot be identified as a GREMI-style innovative milieu, from its actions and interactions with entrepreneurs it can be deduced that BA was contributing to the emergence of an important innovation cluster. Additionally, its institutional support was also a crucial element for improving the absorptive. d. Variables entered on step 1: LPROD, DEBT, ICT, MFA, IFA, FTA, ECA, MILIEU, UNAWARE and SEEKER e. p-values are obtained according to Student’s t-distribution.. 177.
(7) Proceedings of the 2013 International Conference on Economics and Business Administration. capacity of the new companies and their access to strategic cooperative networks [33].. REFERENCES. The goal of this investigation is to understand how things have changed during the recent crisis. From a sample of 64 firms, a logistic regression analysis was conducted to predict success of nascent firms in the financial crisis using a wide set of variables as predictors. There is a moderately strong relationship between prediction and grouping and the Wald criterion demonstrated that some economic and financial variables made a significant contribution to prediction.. [1] [2] [3]. [4]. In particular, the born-global and high productivity ICT firms show the best prediction of success. However, milieu variables do not contribute to explain economic development of firms. Although firms with better initial performance and high innovative behavior (both categories MILIEU and UNAWARE) show higher logistic coefficients in the equation, the B values are not statistically significant.. [5]. [6] [7]. The variable of foreign trade specialization has the bigger influence on the odds ratio. As the stagnation of demand and incomes persists, the external markets are becoming the main source of growth and business opportunities for firms in Spain. This result would confirm that export orientation makes a significant additional contribution to economic growth [34]. Since there is a lack of local markets for advanced technology from start-ups, the propensity to born global is higher [35].. [8] [9] [10]. On the other hand, a high rate of capital intensity does not guarantee success. As big capital investments in new firms are usually financed with external funding, firms are facing strong difficulties to balance assets and liabilities and to generate incomes enough to meet the debt service. So much the worst is the prediction for companies with big investments in intangibles assets.. [11]. Firms developing technology-intensive activities evidence a much better performance than nascent firms in other tertiary activities. Probably, the strategic use of ICT provides firms with more organizational flexibility and more adaptive capacity to turbulent environments. Creative use of ICT would also encourage local cooperation [36] and the emergence of communities of enterprise that create value [37].. [14]. [12]. [13]. [15]. [16]. [17]. Even so, firms based on e-commerce have not made the difference in the financial crisis. Viability has been also challenged if they do not fulfill high levels of productivity.. [18]. This investigation contributes to realize how the longlasting financial crisis is affecting the survival of nascent firms that benefit from the membership or interaction with a hightechnology innovation cluster.. [19] [20]. [21]. In the case of BA, milieu effects have been insufficient to confront the damages of financial crisis, since to a great extent the successful evolution of start-up businesses seems to be linked to internationalization, productivity and adequate funding policies. If the interaction with the milieu does not motivate this response, the prospect of success would be less favorable. Adaptation and change are becoming key processes in the development and resilience of local economies [38]. In any case, the influence of plausible milieu effects should be tested in other environments.. [22]. [23]. 178. P. Romer, “Increasing returns and long-run growth”, Journal of Political Economy, vol. 94 (5), pp. 1002-37, 1986. R. Lucas, “On the mechanics of economic development”, Journal of Monetary Economics, vol. 22 (1), p. 3-42, 1988. Z. Griliches, “Issues in assessing the contribution of R&D to productivity growth”, Bell Journal of Economics vol.10 (1), pp. 92-116, 1979. Z. Griliches, “The search for R&D spillovers”, Scandinavian Journal of Economics, vol. 94, Supplement, pp. 29-47, 1992. D. B. Audretsch and A. R. Thurik, “What’s new about the New Economy? Sources of Growth in the Managed and Entrepreneurial Economies” Industrial and Corporate Change vol. 10 (1), pp.: 267-315, 2001. D. B. Audretsch, “Entrepreneurship capital and economic growth”, Oxford Review of Economic Policy, vol. 23 (1), pp. 63-78, 2007. Z. Acs, D. B. Audretsch, P. Braunerhjelm and B. Carlsson, “The Missing Link: The Knowledge Filter and Endogenous Growth”, Center For Economic Policy Research, Discussion Paper 4783, 2004. D. B. Audretsch, M. C. Keilbach and E. E. Lehmann, “Entrepreneurship and Economic Growth”, Oxford, Oxford University Press, 2006. P.A. Geroski, “What do we know about entry?”, International Journal of Industrial Organization, vol 13 (4), pp. 421-440, 1995. D. R. Gnyawali and D. S. Fogel, “Environments for Entrepreneurship: Key Dimensions and Research Implication”, Entrepreneurship: Theory and Practice, vol 18 (4), pp. 43-62, 1994. P. Cooke and K. Morgan, “The associational economy. Firms, regions, and innovation”, Oxford, Oxford University Press, 1998. M. Storper, “The resurgence of regional economies ten years later: the region of untraded interdependencies”. European Urban and Regional Studies, vol. 2 (3), pp. 191-221, 1995. J. S. Coleman, “Social Capital in the Creation of Human Capital”, American Journal of Sociology, vol. 94,Supplement, pp. S95-S120, 1988. R. D. Putnam, “What Makes Democracy Work?, National Civic Review, vol. 82 (2), pp. 101-107, 1993. R. Camagni, “The city as a milieu: applying GREMI’s evolution to urban evolution”, Revue d’Economie Régionale et Urbaine, vol. 3, pp. 591-606, 1999. R. Capello and A. Faggian, “Celloective Learning and Relation Capital in Local Innovation Processes”, Regional Studies, vol. 39 (1), pp. 75-87, 2005. L. Anselin, A. Varga and Z. Acs, “Local geographical spillovers between university research and high technology innovations”, Journal of Urban Economics, vol. 42 (3), pp.422–48, 1997. D. Foray, “L’Economie de la Connaissance”, Paris, La Découverte, 2000. OECD, “Territorial Outlook”, Paris, OECD, 2001. R. Camagni, “Teritorial capital and regional development” in R. Capello and P. Nijkamp “Handbook of Regional Growth and Development Theories”, Edward Elgar, Cheltenham, pp. 118-132, 2009. P. Aydalot, “Trajectoires technologiques et milieux innovateurs”, in P. Aydalot, “Milieux innovateurs in Europe”, GREMI, Paris, pp. 345-361, 1986. R. Camagni, “Local milieu, uncertainty and innovation networks: towards a new dynamic theory of economic space” in R. Camagni “Innovation Networks: Spatial Perspectives”. Belhaver-Pinter, London, pp. 121-144, 1991. D. Maillat and B. Lecoq, “New technologies and transformation of regional structures in Europe: The role of the milieu”, Entrepreneurship & Regional Development, vol. 4 (1), pp. 1-20, 1992..
(8) Proceedings of the 2013 International Conference on Economics and Business Administration. [33] M. Fernández-Ardèvol and J. Lladós, “Determinants of Science-Based Cooperation: Evidence in a Sample of Small and Micro Firms”, Managing Global Transitions, vol. 9 (4), pp. 319-33, 2011. [34] J. Hessels and A. van Stel, “Entrepreneurship, export orientation and economic growth”, Small Business Economics, vol. 37 (2), pp. 255-268, 2011. [35] R. Camagni and R. Capello, “ICTs and territorial competitiveness in the era of Internet”, The Annals of Regional Science, vol. 39 (3), pp. 421438, 2011. [36] H. Etzkowitz, F. Solé and J.M. Piqué, “The Creation of born Global Companies within the Science Cities: An approach from Triple Helix”, Engevista, vol. 9 (2), pp. 149-164, 2007. [37] C. Mason, T. Castleman ad C. Parker, Craig (2008) “Creating value with regional communities of SMEs”, in Tan, Felix (eds), “Global information technologies : concepts, methodologies, tools and applications, pp. 2134-2143, Information Science Reference, Hershey, 2008. [38] J. Simmie and R. Martin, “The economic resilience of regions: towards and evolutionary approach”, Cambridge Journal of Regions, Economy and Society, vol. 3 (1), pp. 27-43, 2010.. [24] D. Maillat, M. Quévit and L. Senn, “Réseauxd’innovation et milieux innovateurs: un pari our le développement régional”, GREMI, Neuchâtel, 1993. [25] O. Crevoisier, “Proximitiy and territory versus space in regional science”, Environment and Planning, vol. 28(9) pp. 1683 – 1697, 1996. [26] R. Ratti, A. Bramanti and R. Gordon, “The Dynamics of Innovative Regions: the GREMI approach”, Aldershot, Ashgate, 1997. [27] R. Capello, “Spatial transfer of knowledge in high-tech milieux: learning vs. collective learning processes”, Regional Studies, vol. 3 (4), pp. 353365, 1999. [28] M. Fromhold-Eisebith, “Innovative Milieu and Social Capital— Complementary or Redundant Concepts of Collaboration-based Regional Development?”, European Planning Studies, vol. 12 (6), 2004. [29] J. Wagner and R. Sternberg, “Start-up activities, individual characteristics, and the regional milieu: Lessons for entrepreneurship support policies from German micro data”, The Annals of Regional Science, vol. 38 (2), pp. 219-240, 2004. [30] H. E. Aldrich and C. M. Fiol, “Fools Rush in? The Institutional Context of Industry Creation”, The Academy of Management Review, vol. 19 (4), pp. 645-670, 1994. [31] J. Lladós, M. Fernández-Ardèvol and J. Vilaseca, "Innovative milieu, micro firms and local development in Barcelona". International Journal Entrepreneurship and Small Business, vol. 7 (2) pp. 214-231, 2009. [32] D. Heerwegh and G. Loosveldt, “An experimental study on the effects of personalization, survey length statements, progress indicators, and survey sponsor logos in web surveys”, Journal of Official Statistics, vol. 22 (2), pp. 191-210, 2006.. 179.
(9)
Figure


Documento similar
“ CLIL describes a pedagogic approach in which language and subject area content are learnt in combination, where the language is used as a tool to develop new learning from a
In the “big picture” perspective of the recent years that we have described in Brazil, Spain, Portugal and Puerto Rico there are some similarities and important differences,
In the preparation of this report, the Venice Commission has relied on the comments of its rapporteurs; its recently adopted Report on Respect for Democracy, Human Rights and the Rule
The possibility to identify potential high job growth entrepreneurs through their motivations, innovative behavior, export orientation, and the moderating effect of
The purpose of the research project presented below is to analyze the financial management of a small municipality in the province of Teruel. The data under study has
Parameters of linear regression of turbulent energy fluxes (i.e. the sum of latent and sensible heat flux against available energy).. Scatter diagrams and regression lines
Given the much higher efficiencies for solar H 2 -generation from water achieved at tandem PEC/PV devices ( > 10% solar-to-H 2 energy efficiency under simulated sunlight) compared
The article ends with an examination of the transnational operations in Cuba of the French firm Derosne & Cail, one of the most innovative engineering firms of
![ff erences,ininteractionwith , ].Tobetterunderstandthisreality,recentresearchhastakenashifttowardsanalyzingandunderstandingindividualdi assessmentofuniversityqualityincorporatessatisfactionwiththeuniversityexperience,andhowitprovidesforpsychologicalwell-be](data:image/gif;base64,R0lGODlhAQABAIAAAP///wAAACH5BAEAAAAALAAAAAABAAEAAAICRAEAOw==)