TítuloComparison of three pilot plants filled with organic materials for the treatment of air pollutants from a composting plant
8
0
0
Texto completo
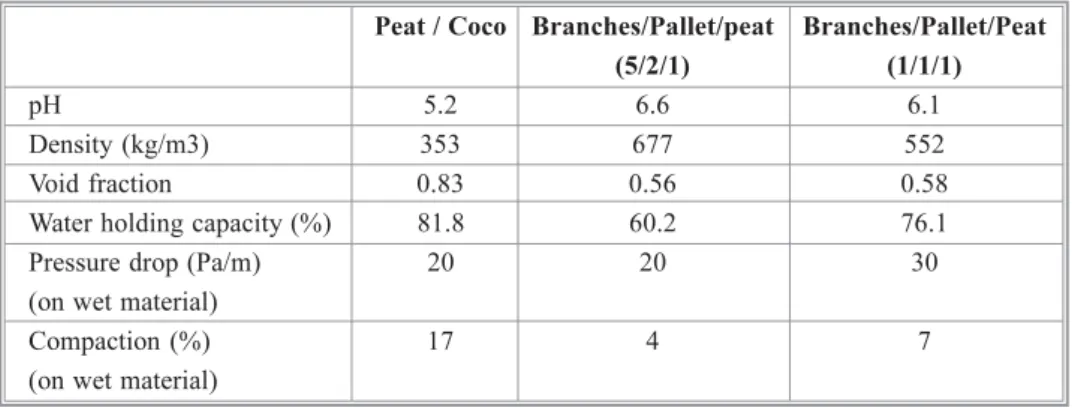
(2) 598. SÉBASTIEN BASSIVIÈRE, FLORENCE DUCRAY and CHRISTOPHE RENNER. (VOCs). However the associated cost of such an air treatment often drives the composting plant’s owner to lower the investment particularly when the technical choice of the bacteria supporting material has to be done. Then the tendency could be to choose a cheap supporting media easily available in the surrounding of the composting plant Nevertheless the pollutant removal efficiency of biofiltres depends a lot on the quality and the characteristics of the material used. So the cost/efficiency balance of the supporting media has to be clearly determined in order to help the operator in his choice. The goal of this experimentation was to evaluate the removal efficiency of VOC, Odours Units and Ammonia by 3 mixes of organics materials that can be used in biological filtration and to estimate the main operational costs associated to each material (ΔP, sell cost, water consumption). To do so, three pilot plants have been operated since August 2006 on a composting plant in the south-west of France.. 2 MATERIALS AND METHODS 2.1 ORGANIC MEDIA The 3 materials selected for biofiltration trials were: i). a mix of peat (1 vol.) and of long coco fibres (1 vol.) (biofiltre F1). This media is widely used in usual biofiltres and is easily available on the market at a cost of 70 €/ton. ii) a mix of oversized branches /pallet fragments/blond peat in a volume ratio of 5/2/1 (biofiltre F2). This media is directly made at the composting plant at an approximate cost of 40 €/ton. iii) a mix of oversized branches /pallet fragments/blond peat in a volume ratio of 1/1/1 (biofiltre F3). Same availability and cost than media 5/2/1. Physical and chemical characteristics of those media have been previously determined at the lab scale (pH, density, void fraction, water holding capacity, pressure drop and compaction) to estimate their potential in being a useful bacterial support (table 1). Differences observed between the three mixes are mainly due to the peat content that lowers the pH value and gives bigger void fraction, water holding capacity but also compaction capacity. The higher compaction capacity of the peat/coco mix represents the only bad point in this evaluation compared to the other media. However those differences cannot lead to eliminate a potential media for biological filtration purposes..
(3) 599. COMPARISON OF THREE PILOT PLANTS FILLED WITH ORGANIC MATERIALS. Table 1. Physical and chemical characteristics of the media tested.. pH Density (kg/m3) Void fraction Water holding capacity (%) Pressure drop (Pa/m) (on wet material) Compaction (%) (on wet material). Peat / Coco Branches/Pallet/peat (5/2/1) 5.2 6.6 353 677 0.83 0.56 81.8 60.2 20 20 17. Branches/Pallet/Peat (1/1/1) 6.1 552 0.58 76.1 30. 4. 7. 2.2 PILOT PLANTS The characteristics of each pilot are: surface = 3.14m2, diameter = 2m, high of material = 1,15 m + 0,25 m of draining layer. Filters are closed with a plastic cover (figure 1). All of them are fed with the polluted air made of a mix of process air pumped out of the compost piles and of ambient air coming from the fermentation and maturation buildings. Each air pipe feeding each filter is fitted with an automated air valve controlled by online air flowmeter in order to ensure a constant flow in spite of pressure drop variations. Four periods have been defined to test increasing air velocities throughout the filters (125 m/h; 175 m/h, 210 m/h and 95 m/h). Filters are maintained wet with tap water sprayed during 15 sec. every hour what delivered a flow of 10Liters/day/m2. The water is not recirculated and is drained to the sewer network.. Figure 1. View of the three pilot plants and air pipes network..
(4) 600. SÉBASTIEN BASSIVIÈRE, FLORENCE DUCRAY and CHRISTOPHE RENNER. 2.3 ANALYTICAL METHODS Ammonia and VOC were continuously monitored respectively with an Infra Red Gas Filter Correlation analyser (IR GFC) (Model MIR 9000, Environnement S.A.) and with a Flame Ionisation Detector (FID) analyser (Model 109A, JUM) that also measure methane (CH4) and Non Methane Hydro Carbons (NMHC). Sampling was alternatively made at the inlet and the outlet of each biological filter for periods of 20 min. Once a month, drain water of each filter was collected during 24 hours and analysed for NH4, NTK, NO3 and NO2 according to European or International Standardisation. At the same time, air samples had been collected in Tedlar® bags with a Teflon® coated pump. Then odours units (O.U.) determination had been done with a dynamic olfactometer (Model Odile, Odotech Inc.) according to the European Standard NF EN13725. Relative humidity (%) and Pressure Drop (mbar) in filters was measured by appropriate probe and sensor.. 3 RESULTS AND DISCUSSION 3.1 PRESSURE DROP AND HUMIDITY The evolution of pressure drop (ΔP) follows clearly the increasing of air flow (and air velocity) (Graph. 1). This phenomenon is less important for biofilter 1 for which the void fraction is significantly higher than in other filters. Biofilter 2, with the lower void fraction, is the one that reaches the highest pressure drop. At the end of trials, the return to initial pressure drop is easily obtained when lowering the air velocity. Theses ΔP values remain very low and acceptable even after a long running time. Humidity remains very constant in every filter and is close to the recommended value of 30 %, and that in spite of a constant water flow for varying air velocities (Graph 2). This very important parameter assesses of the good running of filters and could have been more easily achieved with the use of covers above filters. 3.2 EFFICIENCY OF ODOURS UNIT ABATEMENTS Odours unit have been measure in three different laboratories in order to have a comparison and an idea of the large variations of results that can be associated with such an analysis. For example the sample taken from the air entering the biofiltres we had obtained values rising from 9000 O.U. to 15 000 O.U with the first lab, from 6000 to 28 000 with the second one and from 21 000 to 28 000 with the third lab. Fortunately the tendencies are the same when we consider the evolution of O.U. abatement versus the increases of air flow. Values were started at a very good abatement level of nearly 95% in each filter at an air flow of 390 m3.h-1. Then the more the air.
(5) COMPARISON OF THREE PILOT PLANTS FILLED WITH ORGANIC MATERIALS. Graph 1. Evolution of pressure drop in the three biofilters.. Graph 2. Evolution of Relative Humidity (%) in the three filters.. 601.
(6) 602. SÉBASTIEN BASSIVIÈRE, FLORENCE DUCRAY and CHRISTOPHE RENNER. flow increased, the more the abatement efficiency decreased and this to raise no more than 40% in the worst case (Graph 3). Every laboratory also showed that filter 1 was the less efficient when filter 2 and 3 could be considered as similar.. Graph 3. Abatement of Odours Unit (%).. 3.3 EFFICIENCY OF AMMONIA AND NMHC REMOVAL The ammonia concentration in the polluted air was at a mean value of 25 mg.Nm3 at the beginning of trials and reached 75 mg.m3 at the end, what begins to be high for such biofiltres. The removal efficiency of NH3 is considerably lower in biofilter 1 (30% to 50% max) than in filters 2 and 3 (around 90% whatever the air flow was). For each filter we can not find any relationship between de NH3 removal and the air flow tested (Graph 4). This is of a great interest when we consider that the usual velocity applied on that type of filter is 100m.h-1 (air flow 315 m3.h-1) and that we could have applied more than twice time this velocity without decrease of the removal efficiency. Whatever the global ammonia abatement was, the analyses made on the drain water have shown that a large amount of NH4+ was found in this water. This led us to conclude that a great part of the removal was more due to a simple washing than to a biological activity. If we make the mass balance of nitrogen in the inlet air and outlet air of filters and in drain water we can see that 15% (filter 1) to 30% (filters 2 and 3) of entering ammonia is founded in drain water (Graph 5). That mean that for filter 1.
(7) COMPARISON OF THREE PILOT PLANTS FILLED WITH ORGANIC MATERIALS. Graph 4. Ammonia removal efficiency (%).. Graph 5. Part of Nitrogen (ammonia form) recovered in drain water (%).. 603.
(8) 604. SÉBASTIEN BASSIVIÈRE, FLORENCE DUCRAY and CHRISTOPHE RENNER. approximately 50% of ammonia is eliminate by washing. This value is of 30% for biofiltres 2 and 3. This difference can be explained by the bigger contact surface offered in Filters 2 and 3 compared to filter 1. Concerning the Non Methane Hydro Carbons, tendencies are more difficult to be distinguished. We just could observe that a global removal efficiency of 20% to 50% is obtained (Graph 6). The abatement of NMHC seems to best with an air velocity of 100m.h-1 and lower for higher flows.. Graph 6. Removal efficiency of NMHC (%).. 4 CONCLUSIONS In conclusion we could have observed a better ammonia removal on filters filled with a cheaper home-made media than on a traditional media made of coco fiber and peat. This remains true even if we have seen water washing of NH3 on all the filters. The part of this physical treatment is approximately 50% on coco/peat against 25 to 30% on wood/pallet/peat. No great differences occur between filters 2 and 3. A better understanding of the performance differences is going to be conduced, including microbiological investigation. However the removal efficiency of NMHC is similar on all filters. If we consider the same tendencies on Odours Unit abatement, we could suppose that the main part of odours nuisance due to a composting plant seems to remains in the Volatile Organic Compounds content in the air treated.
(9)
Figure
Documento similar