Debt overhang: A review of the Latin American experiences of the eighties The case of Brazil
25
0
0
Texto completo
(2) Several factors affected negatively the debt burden after 1979: the aforementioned higher interest rate, the worldwide recession that followed the second oil shock, and its consequent lower price for commodities. Real interest rate deflated by the evolution of commodity prices turned to be extremely positive during the following years. Interest payments during this period highly increased (both because of higher interest rates and larger debt volumes) while net exports decreased. Thus, there is a structural change in the current account affecting most countries in the region, including Brazil. Trade deficit as a percentage of the current account fell, while interest payments were rising dramatically, partly because of debt-financing of previous deficits. This, in turn, led to increasing debt and an even higher structural level of interest payment (Pastor, 1989).. Prior to 1979, borrowings by Latin American countries were associated with financing the deficit in foreign trade. Gradually, under the new financial conditions, new external obligations were directed in an increasing proportion to cover the payment. of. interests. from. previously. contracted. financial. liabilities.. Expectations of external lenders in this kind of process, where new loans from similar sources are needed in order to fulfill prior obligations, may turn unstable, and credit requirements on the debtor economy may become more demanding. This potentially unstable process was soon interrupted because financial markets became rationed for highly-indebted sovereigns and voluntary external financing turned out to be constrained for Latin America. The scarcity of external resources became especially acute after the Mexican moratorium of 1982.. 2.
(3) Graph 3. Federal Funds interest rate and US inflation.. Source: Federal Reserve Board.. The lack of foreign financial sources makes it extremely difficult to finance a current account imbalance. A large burden of interest payments can easily exhaust export revenues and preclude imports of investment goods that are needed for growth. In such a case, the debt burden can create a trap that inhibits any growth policies (Roubini, 1997). This was the prevalent situation in Latin America during most of the eighties. That period was later labeled by ECLAC as the “lost decade” for development for Latin America. We do not merely aim at retelling once again such story. In fact, there are several narratives and analysis around the economic process that evolved from the implosion of the debt crisis until growth was finally resumed, although at a slow pace, after a major delay 1. However, by placing such historical experience in a present-day perspective, we extend our aim to extracting potentially useful lessons for the treatment of current problems, particularly in the European periphery, which –five years after the implosion of its own crisis- is still struggling with a 1. See, for example, Ocampo et al. (2014) for a more recent review.. 3.
(4) recessionary scenario and unpromising perspectives. Aggressive austerity programs followed by many European governments did not yet deliver the outcome expected by their promoters. Real government spending per capita has indeed been falling, but growth remained out of sight and real variables persist in a depressed state. In Spain, for example, industrial output per capita has plummeted and is now back to its 1976 level. Greece has, by the time of writing, accumulated 24 consecutive quarters of recession and is facing continuous default threats. Unemployment remains at a very high level in both countries. Other periphery countries remain in similar (perhaps somewhat milder) gridlocks. While most recent data confirms a particularly weak performance in those countries, looking forward does not alleviate the disappointing picture either. IMF’s downward growth forecasts indicate that the situation is not going to reverse any time soon. The European Commission has also raised deflation concerns. In that context, probabilities that the European periphery is facing its very own “lost decade” are indeed increasing. Such is the enduring legacy of the crisis. The fact that Europe has confronted its debt crisis mainly through austerity programs and is now suffering from sluggish growth is worrisome, not only from business or political economy perspectives. As we see some countries of European periphery continuously suffering from sluggish growth, debt overhang and deflationary pressures - 85 years after the US (and the world) suffered from Great Depression and three decades after Latin American debt crisis - also illustrates how lessons from major past events were either progressively forgotten or that there is a high degree of resistance towards incorporating them into the current decision-making processes. Adopting the same viewpoint stated above, we have recently reviewed the Chilean experience 2. Chile was, among Latin American nations, an outstanding case because, although it suffered the deepest crisis among this group of countries, it was also the first one to resume growth –due to the combination of stronger. 2. Damill, M., Frenkel, R., Kampel, D. & Rapetti, M. (2014), Debt overhang: A review of the Latin American experiences of the eighties. The case of Chile. http://www.itf.org.ar/pdf/documentos/93_2014.pdf.. 4.
(5) support from multilateral financial agencies, a faster upturn in their main export commodity price than in other regional cases and a successful (but limited)debtfor-equity swap program. The case of Brazil is also very interesting because it offers some important contrasts when compared to the benchmark established by the Chilean case. Among others, initial features differed widely: Brazil had previously registered exceptional growth rates and export diversification record among the Latin American countries, while other economies showed more modest achievements. In the seventies, Chile (and Argentina and Uruguay) fully engaged themselves into a financial liberalization process, while Brazil maintained all throughout that period a repressed domestic financial system, as such types of regime were described by McKinnon (1973). In that sense, Bacha (1986) correctly discerned fully embraced financial integration (such as it did occurred in Argentina, Chile and Uruguay) from the cases of financial complementarity (Brazil and Colombia), where access to foreign funding occurred in the late seventies and early eighties followed a rather controlled process. As it will become clear from this series of studies (which covers the cases of the largest Latin American economies), Brazil followed a “middle-of-the-road” path between the alternative macro approaches attempted by the different countries in the region. Such avenue allowed Brazil to achieve some initial success (by the mid-eighties Brazil reached external adjustment) but the fiscal gap due to the burden of the debt remained open. Indeed, how can an economy with a low degree of monetization and a small financial system finance its deficit if it’s completely rationed from foreign sources? Brazil faced at that time the following options: 1. It could operate on income and expenditure variables as to balance the budget; 2. It could place debt in its domestic market; or 3. It could monetize the deficit. Options 2 and 3 deserved a special warning. The magnitude of the imbalance requiring funding was very significant in relation to the size of the domestic financial and monetary markets. If any of those two options were adopted, it would place those markets under severe stress.. 5.
(6) Due to the above mentioned stock-flow inconsistency, option 2 could be taken at the expense of high interest rates. However, higher interest rates would have placed the domestic debt on an explosive path, turning the fiscal adjustment into self-destructive. Option 3 –under the then prevailing circumstances- raises the rate of inflation, and option 1 has recessionary effects. Brazil appealed to all of them (or rather a mix of all available options). In the review of that experience a “double transference” problem clearly arises leading to deep macroeconomic instability. The heavy weight of external payments that Latin America faced during the eighties and their effect on the economy were associated with the "external transference" problem. However, unlike the Chilean case, in Brazil (as well as in Argentina) the trade surplus is generated by private activities but it was the public sector which carried the burden of the foreign debt. Hence, in order to make external payments, the public sector must find an appropriate mechanism for the seizure of private-owned foreign currency (this is usually referred as the “domestic transfer” problem 3). In other words, the government must extract the foreign resources it needs from the private sector. If the government is unable to generate the required fiscal surplus in order to acquire the foreign exchange from the private sector in the needed magnitude, it does so either by money creation or by increasing the domestic debt. As it draws on its seigniorage capacity, it finds itself in an uneven dynamics. Those dynamics feedback inflation, as it becomes a major source of money creation. Both problems acting simultaneously gave rise to the issue of the "double transfer", as a source of instability. We begin our analysis by describing the macroeconomic conditions prevailing at the beginning of the eighties. We then divide Brazil’s post-shocks economic evolution into three stages. Initially, Brazil underwent a short external adjustment phase that ended around 1984. The next stage was relatively more extended. There was a gradual re-opening of the fiscal gap amidst increasing difficulties for macroeconomic management. Towards the end of the decade, this path turned to 3. On the domestic (or internal) transfer concept see Fanelli et al. (1987). 6.
(7) be explosive for nominal variables and for the domestic public debt. We use that periodization to examine both the external adjustment process and the evolution of the fiscal gap. We basically focus our analysis to the handling of those gaps, without incurring into further additional policy areas or details, as we want to emphasize debt hangover effects, that is, constraints that a high real burden of debt imposes on macro management. In the case of Brazil, such effects meant that, despite the remarkable closure of the external gap that Brazil was able to achieve in the mid-eighties, it failed in attaining a lasting fiscal balance and resume a sustainable growth path. Actually, GDP per capita decreased over the 80s. The lack of external finance (without recurring into debt restructuring) was crucial for such result.. II. Macroeconomic conditions at the beginning of the eighties 4. The external sector The Brazilian economy grew significantly in the postwar period. It expanded rapidly, particularly after adopting a state-led ISI strategy since the late 60s. Such strategy proved to be successful in promoting growth and export diversification. The expansion rate remained positive but lower after the economy was hit by the first oil shock in 1973 (Brazil was then an oil-dependent economy). The growth process resulted in a relatively closed economy: Exports and imports averaged only 7.4% and 9.5% of GDP, respectively, by the mid-seventies. The structure of exports, however, became more diversified. There was a substantial increase of the share of manufactured and semi-manufactured products in exports, favored by continuous policy incentives, while the contribution of coffee beans and other primary products shrank significantly. As can be seen in the following graph, by 1981 almost 40% of all foreign sales were manufactures, a substantial increase from less than 25% in the first half of the seventies 5. Gains in the participation of 4 5. This section draws on Damill et al. (1992). Graph based on Funcex data.. 7.
(8) manufactured exports on total exports continued along the decade and by the mid80s the share surpassed 50%. Metal and mechanical products, industrialized agricultural products, footwear and textiles, and chemical products were among the most important items of Brazilian manufactured foreign sales.. Graph 4. Evolution of Brazilian exports and imports (% of GDP).. Source: World Bank.. Graph 5. Brazilian industrial exports as a percentage of total exports.. Source: Funcex.. 8.
(9) On the opposite, imports remained dominated by energy inputs, especially oil and oil-derivatives. This particular feature exposed the Brazilian economy to severe consequences arising from the second oil shock, in 1979. The resulting deterioration of terms of trade caused an increase in the trade deficit. (It represented more than 2% of GDP.) Since net foreign factor payments were negative and of similar proportion of the trade deficit, foreign savings equivalent of about 5% of GDP were required annually. Chronic deficits in the current account of the balance of payments were not then a binding constrain for growth, due to the significant availability of external financing throughout the seventies. Brazil´s development strategy had led to a rapid growth of foreign debt, in a debt-prone environment characterized by high liquidity and low real interest rates. Total nominal external debt grew at an average annual rate of 23% between 1973 and 1980. Despite such hike, indebtedness ratios to national output in 1979 were similar to other countries in the region like Argentina and Chile: Total (public plus private) gross External Debt/GDP was 28.0%; Total (domestic plus external) gross central government debt was 30.8% 6. Outstanding debt to exports, on the other hand, was higher at 196.6% 7.Prospects started to change in October 1979, after the increase in the international interest rate that followed Paul Volcker’s tight monetary policy move. As we said earlier, the indebtedness process continued fluently, although at a higher cost. Brazil´s net payments to foreign factors climbed to 3% of GDP and the current account imbalance approached 5.5% of GDP.. 6. Source: Reinhart and Rogoff (2010).It must be highlighted that debt ratios to GDP are subject to volatility due to exchange rate variations. 7 Source: World Bank Debt Table (1984).. 9.
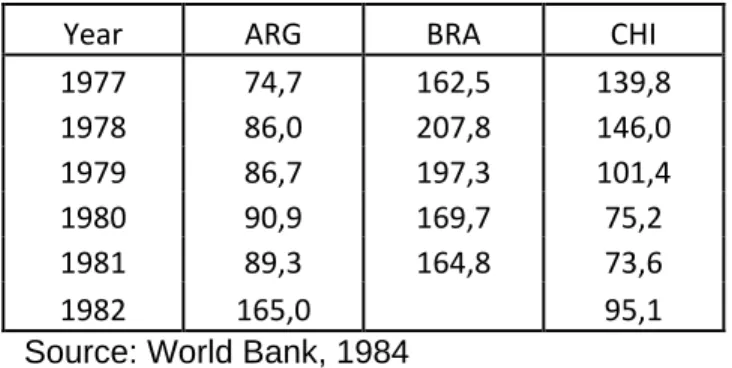
(10) Table 1.Outstanding Debt to Exports of goods and services (%) Year ARG BRA 1977 74,7 162,5 1978 86,0 207,8 1979 86,7 197,3 1980 90,9 169,7 1981 89,3 164,8 1982 165,0 Source: World Bank, 1984. CHI 139,8 146,0 101,4 75,2 73,6 95,1. Initial fiscal conditions Before describing the prevailing fiscal outlook, we must cautiously introduce a concept clarification that makes the analysis of Brazil’s data different from other Latin. American. cases.. Throughout. the. eighties. there. were. recurring. methodological disagreements between the IMF and the Brazilian government on fiscal deficit calculations. Brazil emphatically insisted that the benchmark used by multilateral agencies should be modified in order to reflect more appropriately the current fiscal stance. Based on the presumption that traditional analysis was not the appropriate to assess the fiscal position of countries with high inflation and a high ratio of domestic debt over GDP, Brazilians insisted on the use of the concept of the operational fiscal balance, which differed widely from the conventional fiscal estimations. Borrowing requirements of the public sector moved dramatically with inflation. As Cardoso pointed out:. “Interest payments rise with the increase in inflation component of the nominal interest rate on the domestic debt. But these increased payments represent compensation for the erosion of the real value of the debt principal. Payment of the inflation component of the nominal interest rate is thus equivalent to a financing item used to amortize the public debt. It. 10.
(11) follows that a more meaningful measure of the deficit should exclude the payment of the inflation component of the nominal interest.” Cardoso (op.cit.,Appendix 1, page 635).. The operational balance was thus defined as the primary balance less the “real” component of interest payments 8.As it will be seen below, the gap between both measures became progressively larger over time. As stated above, the state played a central role in the growth strategy implemented in the 60s and 70s. The public sector acted as a direct investor as well as sponsor of private investment in diverse promoted activities. In the early 80s, after the international interest rate peaked, such endeavors were suddenly restrained. There were high financial needs of an already expanded public sector and state-owned enterprises which were difficult to match with available resources. As early as 1980, although a primary surplus of less than 1% of GDP was generated, the operational deficit of the consolidated public sector had already soared to 7% of GDP. Gross fiscal pressure approached 25% of GDP while current government consumption (excluding interest payments) accounted for 21%. Public sector investment had been very important. It had approached 7% of GDP (5% corresponding to state-owned companies) representing about 30% of total investment by 1980. SOEs had important financial needs, originated in intense investment programs aimed at import substitution activities. In 1981-82 the external indebtedness of state enterprises also partly reflected the purpose to generate funding in order to cover the expanding external imbalance. While the effect of the increased interest burden on public savings has been often noticed, there are at least two additional (and more and less simultaneous) processes worth noting. First, the deterioration in tax collection, that dropped from an average of 26.4% of GDP in the second half of the 70s to 24.7% in 1980 (and 8. In the Fund-supported adjustment program followed during 1988/89 both the conventional and operational deficits were targeted (Chu and Hemming (1991)).. 11.
(12) would drop even further throughout the entire decade to 23.7%). Second, the substantial increase in subsidies and transfers to the private sector, which surged from 1.5% of GDP over the 70s to about 4% in 1980 (Bodin de Moraes, 1990). These two factors also contributed significantly to weaken public sector savings. In a rather large proportion, the fiscal deficit was financed through the use of external sources. By 1980, 70% of Brazil’s gross external debt had been accumulated by the public sector. The domestic public debt was then comparatively small (about 4% of GDP, if we only consider securities) but tended to grow rapidly.. The adjustment begins: the period between 1981 and 1984 In the early eighties Brazil had a rapid success in adjusting its external sector. The country, however, was less successful at correcting its fiscal imbalance. The process during this period underwent through two distinct stages. Policy during the first phase (1980-82) combined trade instruments with monetary tightening. The relative success of earlier substitution policies resulted in a sharp decline in imports, but the increased outflow of payment services implied the persistence of the external imbalance. Firms were induced to finance themselves abroad and cover the current account deficit through the capital account. Tight monetary policy had negative fiscal effects due to both its recessionary impact and the resulting higher interest burden of the domestic public debt. Hence, we can state that until 1982 imbalances were not reduced, but financed. Such a move was consistent with the then prevailing belief that the unfavorable turn of the international financial scenario was going to be reversed (or, at least, attenuated) in the short run 9. After the Mexican crisis of 1982, however, it was not possible to further finance neither the external nor the fiscal imbalances. In early 1983, Brazil signed a Letter of Intent with the IMF that allowed the country to intensify its external adjustment and progress towards more balanced public accounts. The latter was mainly 9. Ocampo, ibid.. 12.
(13) achieved by a sharp contraction of both current and capital expenditures of the public sector. During this stage, as was usual in IMF-oriented programs, the exchange rate and fiscal policies played the central role in economic policy. The adjustment was far from successful: fiscal accounts were initially strengthened but there was a significant rise in inflation, fueled by currency devaluation and higher public utilities’rates.. The fiscal gap. Brazil 1985-89 In 1985, the military dictatorship gave way to a democratically elected government. There were high expectations in the population regarding that the recovered democracy would be able to tackle simultaneously different economic objectives, such as lowering inflation rate, recover growth and improve income distribution. The Cruzado Plan, implemented in 1986 -soon after the new authorities took officeis embedded within that perspective. Initial results were encouraging, as the economy expanded rapidly and the fiscal situation improved, mainly due to the increase in the tax revenues. The debacle of the plan, a few months later, also meant a reverse for the anti-inflationary struggle and the fiscal imbalance widened to 6 percentage points of GDP. The political transition was concurrent with the gradual reopening of the fiscal gap. This is rather an oscillating process, as it reflects different adjustment and stabilization attempts (and their respective failures). Public sector’s consumption tended to rise systematically, and increasingly absorbed a larger proportion of the tax revenues. In fact, it grew from 8.3% of GDP in 1984 to 14.3% in 1989 and beyond that level during the following year. In a context characterized by inflation acceleration, absence of voluntary external financing and falling demand for domestic monetary assets, financing the fiscal deficit faced insurmountable difficulties. Instability became a key feature of the Brazilian economy from the debacle of the Cruzado Plan until the end of the decade. Successive stabilization attempts failed. Short-term domestic debt, high 13.
(14) liquidity and interest rates volatility threatened to converge into an explosive trend, as it was finally observed in the last months of 1989, towards the end of the government of José Sarney.. III.. A close-up examination of the external gap. Between 1981 and 1984 As a consequence of the deterioration of the terms of trade, further accentuated by the 1979 oil shock, the trade deficit increased sharply. After a large currency devaluation in 1979 there were no further major exchange rate adjustments until early 1983. A passive crawling peg regime predominated for most of the period. This system allowed maintaining the real exchange rate during 1981-82 close to the 1976-78 average, but still 20% below the 1980 peak registered after the mentioned devaluation. In fact, that record-high level was not observed again throughout the remaining of the decade, not even after a strong adjustment in 1983. Brazil achieved a significant reduction in the trade imbalance before the 1983 exchange rate correction. Many projects pursued through an intensive use of mechanisms embedded in the ISI strategy (in such areas as paper, pulp, fertilizers, non-ferrous metals, steel and others)had already matured by the early eighties. That strategy encompassed distinct elements such as very high tariffs and quantitative restrictions to foreign trade, fiscal incentives as tax exemptions for selected industries; long-run credit at low real (or negative) interest rates by stateowned BNDES Bank; direct state intervention through state-owned enterprises in key sectors, and other fiscal incentives and credit subsidies in order to promote exports. The leading role of the state within this strategy must be emphasized. Exports value grew almost 80% while imports value shrank 20% between 1980 and 1984. The latter was largely due to the contraction of purchases of intermediate inputs, which reduced their participation in total imports from 33% to less than 23% between 1979 and 1983. 14.
(15) Foreign borrowing by firms was somehow stimulated. State owned firms collaborated in the build up of the debt. Easy access to international markets and the availability of collateral by these firms made it possible to obtain funding in order to finance investment projects. Government officials claimed that debtfinanced projects would allow repayment once those ventures reach a mature stage and Brazilian monetary and credit policies induced local banks and firms to procure foreign financial sources. Indeed, Ferreira and Bonomo (2006) signaled that throughout the seventies and early eighties, state owned enterprises held most of public debt. According to their figures, in 1981-3 state-owned enterprises were responsible for 60% of total debt, the rest being evenly divided by the central government,. on. the. one. side,. and. states. and. municipalities. on. the. other 10.However, it must be highlighted the fact that in contrast to the Argentine and Chilean cases (together with Uruguay, the so-called Southern Cone experiments) the capital account was not liberalized and a regime of financial repression was maintained throughout the period. In this context, capital inflows amounted to nearly 27 billion dollars between 1980 and 1982, about the same magnitude of net foreign interest payments. If we also consider overseas profit remittances, then outflows exceeded inflows by more than three billion dollars during that period. The imbalance is mainly concentrated in 1982, and is largely due to the sharp drop in loans from international commercial banks. Indeed, after 1982, funding the external imbalance with foreign credit became very difficult and currency devaluation became inevitable. The average real exchange rate in 1983 was 20% above the average of the previous year. Currency devaluation was an item in the agreement then reached with the IMF. There were later frequent small corrections in order to maintain the real exchange rate level. The deterioration of the terms of trade between 1980 and 1984 was very significant, close to 30%. Hence, despite the improvement of exports and the fall in foreign purchases, the trade balance remained negative until 1983. 10. Cardoso and Fishlow (1990) point to a similar participation of state-owned enterprises in external debt.. 15.
(16) In 1982, the trade imbalance combined with the sharp increase in interests payments resulted in a record current account deficit, which then exceeded 16 billion dollars. Interests on the external debt alone were 12.5 billons, 5 billion higher than just two years earlier. In 1984, the terms of trade also improved and exports reacted accordingly. The growth of exports and a reduction of imports led to a significant trade surplus that allowed a closure of the external gap. Driven by exports, the economy recovered from recession and output grew more than 5%. Reversal of the trade balance was remarkable, increasing by 6% of GDP (at current prices) between 1982 and 1984.. The period 1985-89 Brazil was able to preserve its external balance during the following years. Export dynamics, improved (and fairly stable) terms of trade and, after 1985, a reduction in the flow of interests due to the decline in international rates, allowed such result without appealing to further devaluations. Indeed, exports grew greatly (its value rose 53.5% between 1986 and 1989) imports moved irregularly. Large positive trade balances were generated until 1989, when it deteriorated markedly along a sharp decline in the real exchange rate. It is important to note how Brazil´s trade adjusted throughout the decade to a situation characterized by higher interest burden of the debt and the lack of voluntary external financing. As mentioned, exports expanded both in value (125%) as in volume (8.5%), mainly as a consequence of the change in export composition. There was a continuity of previous trends, with falling share of commodity and a rising portion of industrial and semi-manufactured products in total exports. On the other hand, the level of imports at current values in 1989 was close to the level registered in 1979, although it halved in terms of GDP participation. This was done despite a 30% increase in imports’ unit value and offset by a drop of 22% in the imported volume. There was a declining weight of fuels and lubricants due to the fall of international oil prices registered since the 16.
(17) mid-decade and the continuous import substitution policies that helped to decrease foreign purchases of intermediate goods. On the contrary, the share of consumerand capital-goods increased significantly. In particular, the participation of the latter in total imports almost doubled from 1983 to 1990.As mentioned above, the large trade surpluses achieved during this period allowed Brazil to maintain its balance of payments relatively stable. In 1986 the current account deficit grew up again, exceeding 5billion US dollars. The lack of foreign funding created such a compelling external constraint that even a relatively low current account deficit brought to the failure of the Cruzado Plan. The current account deficit accumulated during the five-year period 1985-89 was less than 700 million dollars. The balance of the capital account was positive, and fell short to $ 2.8 billion. But that was insufficient to turn the external sector into a minor source of problems. We can illustrate this statement with the end of the short-lived Cruzado Plan. The economic expansion that followed the Plan announcement rapidly generated a deterioration of the balance of payments and a currency crisis, followed by an acceleration of inflation. That crisis clearly shows how the external constraint operated in the eighties and the narrowness of the space available for economic policy. In fact, the current account imbalance of that particular year was relatively modest compared to those registered in the 70s. However, the total absence of any voluntary external financing could lead to an explosive situation. Second, despite the balance of payments adjustment, Brazil failed to normalize relations with external creditors and international financial institutions. After balancing its current account, there was an idea to depart from the IMF guidance and deal directly with the creditor commercial banks. Unfortunately, such an idea did not yield the expected results. There was, in fact, an agreement with the creditor banks in 1986 without IMF participation. But such agreement could not be completely fulfilled and interest payments to commercial banks were suspended twice, in 1987 and 1989. Financial relations were unstable and became a permanent source of uncertainty that negatively affected Brazil’s macroeconomic performance, particularly its investment rates.. 17.
(18) IV.. Further assessment of the fiscal gap. In the early eighties, the fiscal imbalance was estimated at 7% of GDP. It declined in the mid-decade, but returned to about the original level in 1989. However, its composition differed greatly: in the late-eighties there was a more positive primary outcome and a greater weight of debt interests. Initially, there were not significant changes in the aggregate public accounts. Between 1980 and 1982 the consolidated public sector deficit remained high and increased slightly, from 7% to 7.3% of GDP. However, the tendency to reduce the primary deficit offset by the rise in the interest burden on public debt (both domestic and external) had already begun. A tightening monetary policy implemented after 1980 affected the domestic interest rate while the hike in international rate acted in the same direction. Interest payments rose by 2% of GDP during those years. At the same time, current expenditure registered a rise in wages, a reduction in subsidies to the private sector and an increase in transfers to the social security system. There was also a change in the composition of the tax revenues, with a lower share of indirect taxes and a greater share of direct taxes, due to the combination of recession and rising inflation. Fiscal aggregates improved significantly after a stand-by agreement with a rather orthodox orientation was reached with the IMF in 1983/4. In 1984, the operational deficit was reduced to less than 3%. Indeed, that was the lowest deficit registered throughout the decade. Highly elevated interest payments (equivalent to almost 7% of GDP) were matched by a decidedly large high primary surplus (4% of GDP). Such fiscal adjustment was remarkable, but also fragile. Tax collection had been suffering from inflation and the Olivera-Tanzi effect. There was also a change in the composition of spending ("expenditure-switching"), aimed at improving the balance of payments, which also had negative tax effects. Export incentives for various tradable activities were in fact tax exemptions. Rezende (1989) has characterized them as a “chaotic system of incentives”. Hence, 1983/4 adjustment was essentially obtained by a contraction of public spending. In fact, current expenditure of the Federal government, disregarding interests, fell in 1984, 18.
(19) reaching the lowest level in a decade. Such reduction affected public wages as well as purchases of goods and services by the public sector, subsidies to the private sector and social security transfers. However, it was in government- and SOEs capital spending where retrenchment was most acute. The precariousness of the fiscal position soon became evident. There were high expectations for the incoming civilian administration that replaced the military rule in 1985 and population needs that would pressure on such unstable fiscal situation. Fiscal adjustment was not the top political priority. Since the new government took office in 1985, public consumption grew steadily until the end of the decade. Public wages and other current spending items share a similar upward trend. In 1986, tax collection improved associated both with the fall of the inflation rate (as result of the Cruzado Plan) and increased economic activity. The rate of gross tax revenue to GDP exceeded 25%, a record which will be not registered again until 1990. Such improvement allowed keeping the operative fiscal balance below 4% of GDP, despite the aforementioned increase in public sector spending.. Table 2.Fiscal results (as% of GDP).. Year 1983 1984 1985 1986 1987 1988 1989 1990 1991 1992 1993 1994. Primary Balance 1,7 4,2 2,6 1,6 -1,0 0,9 -1,0 4,6 0,8 2,3 2,6 5,1. Real Interest Operational Payments Balance 4,7 -3,0 6,9 -2,7 7,0 -4,4 5,2 -3,6 4,5 -5,5 5,7 -4,8 5,9 -6,9 3,3 1,3 2,8 -2,0 4,5 -2,2 2,4 0,2 3,8 1,3. Source:Fund. Getulio Vargas, 1997. 19.
(20) The fiscal situation deteriorated after the Cruzado Plan and later stabilization efforts lost their effectiveness. The tax collection to GDP ratio fell in 1988-89 to a similar level of 1984. Two significant factors prevented the imbalance of public accounts from worsening. First, debt interests became less important (see Table). Second, SOEs improved their profitability. In 1990, a newly incoming government led by President Collor de Mello launched a comprehensive attempt aiming to achieve fiscal adjustment and stabilization. Additionally to income policy components, which had also been present in previous heterodox plans, this program included a monetary reform and the immobilization of a high proportion of financial assets. There was a substantial improvement in the fiscal situation and the imbalance reversed its previous negative sign. In fact, the government reached a primary surplus of nearly 5% of GDP. However, many measures of the Collor Plan were just temporary or had only a "once-and-for-all" effect. The improved fiscal situation was unsustainable and its positive results gradually tended to fade away, as inflation speeded. Irresolution of the debt led to inflationary spiral The full adaptation of the Brazilian economy to the high-inflation regime 11 helps to explain the destabilizing effects of negative external shocks in the late 70s and the following adjustment process that followed them. In many ways, 1979 became a milestone year that divided the phase of “debt-led ISI growth process” from the turbulence and stagnation that characterized the next decade. We have already made reference to the impact of the second oil shock and to the rise of the international interest rate. We also mentioned how the large devaluation in late 1979 ended a prolonged period of small scale currency adjustments. Additionally, at the same time a new labor law shortened the wage adjustment period, making them semi-annual instead of annual. More frequent wage adjustments combined with rising oil prices caused a significant rise in inflation. In 1980, the consumer price index exceeded 100% annual rate for the first time. Subsequent devaluations. 11. On the concept of “high-inflation regime” see Frenkel (1989).. 20.
(21) in 1982-3 led to a further inflation acceleration, taking the CPI variations one further step. Monthly inflation rates in 1984-5 averaged 10%. In 1986, the Cruzado Plan, based on fighting inflation inertia achieved significant reductions in the inflation rate-although temporarily. The plan included a clause that triggered a salary adjustment after a cumulative variation of 20% in consumer prices. This provision contributed to the success of the program while inflation remained at very low levels, but it would bring back automatic indexation if inflation would accelerate. That was precisely the case after the currency crisis of the following year. Wage adjustments became monthly, and inflation accelerated and became very volatile. The rise in inflation also tended to generate a progressive demonetization of the economy. The M1 aggregate, for example, fell every year between 1980 and 1985, from 9.3% to 3.5% of GDP. The demonetization process continued every time the inflation accelerated, despite the improvement of fiscal position in 1983-84. After a temporary recovery during the Cruzado Plan, monetary aggregates fell again and M1 would decline to 2% of GDP in 1989. The demonetization process did not amend the low degree of dollarization of private portfolios. In contrast, there was a growing share of highly liquid government securities indexed to inflation, daily negotiated in overnight markets. The domestic debt grew rapidly throughout the decade. Its upward trajectory became especially pronounced after 1984. In 1990, domestic debt reached almost 20 times the size of the money base 12 and their weight in households’ financial assets was highly significant. While the current account remained relatively balanced, the fiscal gap tended to widen during the following years. Domestic debt increased accordingly, as the lack of external funding sources continued throughout the remaining of the decade. But the lack of external funding turned the situation unmanageable. The fast increase of domestic public debt was its first but not only consequence. Domestic debt was mainly short-term, increasing the economy’s propensity to instability. In the last months of 1989, amidst political changes, there was a noticeable rise in interest 12. Reinhart and Rogoff (2011). 21.
(22) rates and domestic debt size grew explosively. Uncertainty on fiscal sustainability increased even further, contributing to generate a hyperinflationary event, which developed before a new president-elect took office. A monetary reform aiming to contain hyperinflation was among the initial measures adopted by the new administration in its inflation-stabilization attempt. A large proportion of financial assets, including domestic debt, were immobilized for 18 months. Frozen assets were initially equivalent to 8% of GDP, but the reforms gradually lost its strength, after a large number of exceptions to the immobilization were later adopted. High domestic indebtedness remained as an unresolved situation.. V.. Final remarks. We add a final note on the comparison of the financial balances of the different aggregated sectors (private, public, external) between the decade-ends that clearly illustrates the various changes observed throughout the eighties in the Brazilian economy. In 1989, ten years after the second oil shock, the financial needs of the public sector were similar to the level observed in 1980-82, close to 7 percent of GDP. However, foreign savings exceeded 5% of GDP in the early eighties and only represented 0.2% on average between 1985 and 1989. In fact, towards the end of the decade the imbalance of public sector was almost entirely offset by the surplus of the private sector (See Table). From a macroeconomic perspective, there was an important mismatch between the external balance and the fiscal situation. The public sector could not purchase foreign currency generated from large trade surpluses without generating a primary surplus. It could not access the voluntary external financial markets either, as it was the case in the early eighties. Instead, the government had to heavily resort to the monetary market, fully using its seigniorage capacity, and placing securities in the domestic financial market. After the failure of the Cruzado Plan, the economy operated under increasing difficulties. The use of external sources was an unavailable option. Financing the fiscal. 22.
(23) imbalance almost exclusively through domestic sources amidst high uncertainty pushed up interest rates and lead to explosive tendencies for domestic debt and inflation, leaving a fragile financial system.. Graph 6. Aggregate balances by sector (% of GDP).. Source: Damill et al. (1992) A debt problem requires a debt solution: lasting solution for a debt crisis requires some sort of debt restructuring that reduces the debt burden in real terms. Otherwise, if the debt mostly belongs to the public sector (or it has been transferred to the public sector) the required external adjustment must be accompanied by a fiscal adjustment and GDP growth will undoubtedly be hurt. Moreover, GDP growth will remain sluggish until the debt issue is finally dealt with. For a developing country, “the debt problem is a development problem” (Cardoso & Fishlow (1989)). In 1989, after a seven year long delay, the Brady Plan finally accepted the need of a debt reduction in order to settle Brazil’s foreign financial relationship. The decrease in the international interest rate allowed Brazil and the rest of Latin America regain access to the international capital markets.. 23.
(24) References Bacha, E. L. (1986). El milagro y la crisis: economía brasileña y latinoamericana: ensayos de Edmar L. Bacha (Vol. 57). Fondo de Cultura Economica,Mexico. Bodin de Moraes, P. (1990). La tasa de ahorro nacional del Brasil en los años ochenta. Ahorro y Formación de Capital, Buenos Aires: Editorial GEL. Cardoso, E. (1998). Virtual deficits and the Patinkin effect. Staff PapersInternational Monetary Fund, 619-646. Chu, K. Y., & Hemming, R. (Eds.). (1991). Public expenditure handbook: a guide to public policy issues in developing countries. International Monetary Fund. Damill, M., Fanelli, J. M., & Frenkel, R. (1992).SHOCK EXTERNO Y DESEQUILIBRIO FISCAL. La macroeconomía de América Latina en los ochenta. Argentina.CEPAL… Fanelli, J. M., Frenkel, R., & Winograd, C. (1987). Stabilization and Adjustment Policies and Programmes. Country study, 12. Federal Deposit Insurance Corporation. (1997). History of the Eighties: Lessons for the Future. Federal Deposit Insurance Corporation. Ferreira, P. C., &Bonomo, M. (2006). The Political Economy of Public Debt in Brazil. Frenkel, R. (1989). El régimen de alta inflación y el nivel de actividad. Centro de Estudios de Estado y Sociedad. FundaçãoGetúlio Vargas (1997)ConjunturaEconômica, May McKinnon, R. I. (1973). Money and capital in economic development.Brookings Institution Press. Ocampo, J. A. (2004). La América Latina y la economía mundial en el largo siglo XX. El trimestre económico, 725-786.. 24.
(25) Ocampo, J. A., Stallings, B., Bustillo, I., Velloso, H., & Frenkel, R. (2014). La crisis latinoamericana de la deuda desde la perspectiva histórica. Pastor, M. (1989). Latin America, the debt crisis, and the International Monetary Fund.Latin American Perspectives, 79-110. Rezende, F. (2001). Financas Públicas. Reinhart, C. M., &Rogoff, K. S. (2010).From financial crash to debt crisis (No. w15795).National Bureau of Economic Research. Reinhart, C. M., & Rogoff, K. S. (2011). The Forgotten History of Domestic Debt*. The Economic Journal, 121(552), 319-350. Roubini, N., &Wachtel, P. (1999).Current-Account Sustainability in Transition Economies (pp. 19-93). Springer US. Sachs, Jeffrey D (1989) "Developing Country Debt and Economic Performance. Volume 2: Country Studies--Argentina, Bolivia, Brazil, Mexico.University of Chicago Press.. 25.
(26)
Figure

Documento similar