An investigation into the cost of universal health coverage in Mexico
29
0
0
Texto completo
(2)
(3) WELL-BEING AND SOCIAL POLICY VOL 4, NUM. 2, pp. 99-125. AN INVESTIGATION INTO THE COST OF UNIVERSAL HEALTH COVERAGE IN MEXICO Tapen Sinha* Instituto Tecnológico Autónomo de México (ITAM) [email protected]. Sandra Orcí Instituto Tecnológico Autónomo de México (ITAM) [email protected]. Abstract he Mexican social security system, after operating for over six decades, has managed to provide healthcare for slightly over half the resident population. There are wide geographical and socioeconomic variations in coverage. To provide wider coverage, the Federal Government created the Sistema de Protección Social en Salud (SPSS) for covering low income family. It becomes the third instrument for the government to cover healthcare in addition to the two important ones: the Instituto Mexicano del Seguro Social (IMSS) and the Instituto de Seguridad y Servicios Sociales para los Trabajadores del Estado (ISSSTE). In the context of SPSS, the Federal Government started the initiative called the Seguro Popular de Salud (SPS). SPS offers medical attention, clinical studies and medicine without cost at the point of service. There are three principal sources of funding the SPS: Federal Government, State Governments and a premium charged on the beneficiaries on a sliding scale, proportional to income – the higher income families pay higher premiums with lowest income paying nothing according to a schedule published in the Diario Oficial de la Federación at the start of every year. The idea of the SPS is to cover the population not covered by the other healthcare institutions with the emphasis on catastrophic illnesses. The goal is a gradual rise in coverage until the universal coverage is achieved in the entire territory of Mexico over a period of a decade. In this paper, we discuss how the development of the SPS took place, starting with the National Development Plan 2001-2006. We trace the history of the SPS. We address the following principal questions in this paper: (1) Does the incorporation of the uncovered, largely poor population, change the average cost structure of SPS? (2) Does it depend on the types of. T. *. Tapen Sinha would like to acknowledge financial assistance from the Instituto Tecnológico Autónomo de México and the Asociación Mexicana de Cultura A.C. for their generous support of this research. We thank Cristina Guitierrez for valuable comments along with the comments from Gabriel Martinez. We also thank all the participants of the CISS/Ibero Conference for their input. The views expressed here are our personal opinions. They should not be construed as reflecting our employers. We alone are responsible for all errors and omissions.. 99.
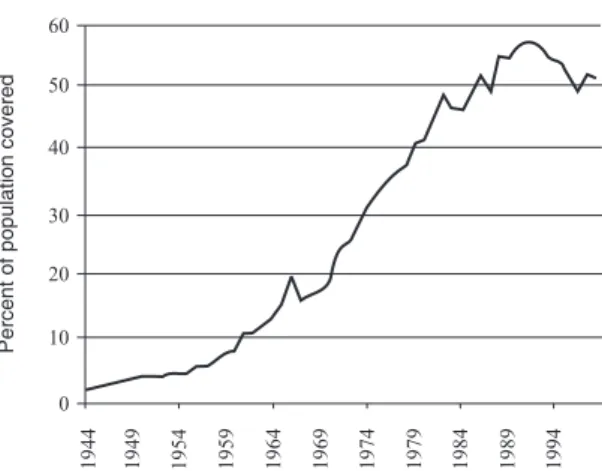
(4) AN INVESTIGATION INTO THE COST OF UNIVERSAL HEALTH COVERAGE IN MEXICO. diseases and medical conditions covered? (3) Will gradual rollout affect the viability of the system adversely? It turns out that some of the important diseases and medical conditions are strongly related to income levels while others are not. Using the database of Núcleo de Acopio y Análisis de Información en Salud (NAAIS 2005), we exploit the information about the differences in diseases rates of covered and uncovered population in each federal entity. Our finding is that the relationship is not in the direction that we expect: Covered population has higher incidence of most of the diseases for which we have data.. Key words: healthcare, Mexico, Seguro Popular. JEL Classification: I11, I18.. Introduction: Healthcare in Mexico. B. efore 1940, no national institution existed in Mexico to cover people for medical problems. Of course, there were hospitals and other clinics. But, there was no systematic coverage. With the founding of IMSS in 1943, the situation began to change. Figure 1 charts the coverage of Mexicans over the next six decades. The coverage increased at an increasing rate through 1982. Even through several crises during the 1980s, the coverage increased–although at a slower pace. During the financial crisis of mid 1990s, Mexico registered a decrease in medical coverage for the first time in half a century. Figure 1 Coverage of Social Security in Mexico, 1944-1997. Percent of population covered. 60 50 40 30 20 10. Source: IMSS, own calculations.. 100. 1994. 1989. 1984. 1979. 1974. 1969. 1964. 1959. 1954. 1949. 1944. 0.
(5) WELL-BEING AND SOCIAL POLICY VOL 4, NUM. 2, pp. 99-125. Coverage of people is not an easy thing to determine in Mexico. The figures have discrepancies among different agencies. For example, according to the Bulletin of the Health Secretariat (Secretaría de Salud 2004), the number of insured by IMSS was reported to be 41,242,697 in 2004. For the same year, the statistical office (INEGI) reported 42,993,343 persons covered by IMSS. Such numbers are so very different that it is hard to reconcile them or ignore them. The difference between the two, after all, is not a matter of thousands but nearly two million! In what follows, we will analyze data based on what is reported by Social Security. Given that they are in the coalface, their numbers should be more reliable. Even there, when we analyzed data at the state level, we found many contradictory figures. Regardless of lack of progress in coverage of national healthcare since 1990, certain types of health indicators have shown remarkable progress. One widely tracked indicator worldwide is child mortality. Figure 2 demonstrates mortality of children under 5 years of age, under one year of age, and neonatal mortality during 1980-2005. This figure shows that with the exception of 1989, every figure for all three types of mortality rates shows a fall for all the years. Thus, the lack of rise of coverage in the 1990s has not adversely affected all the health indicators. This is an important observation because many people argue that a rise in coverage would, in the future, show further improvements of such health indicators. Given Figure 2, such assertions need to be interpreted cautiously as it appears that with or without increase in healthcare coverage, the outcome variables (in this case, mortality of children) are improving.. Figure 2 Mortality of Children, 1980-2005 70 60. Per 1,000. 50 40 30 20 10 0 1979. 1984. 1989. 1994. 1999. 2004. Year Under 5. Under 1. Source: Sepulveda et al (2006).. 101. Neonatal.
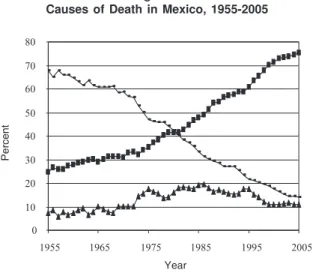
(6) AN INVESTIGATION INTO THE COST OF UNIVERSAL HEALTH COVERAGE IN MEXICO. Figure 3 gives us a glimpse of profound changes in the causes of death Mexico has gone through over a period of half a century. Back in 1955, close to 70 percent of all deaths were caused by communicable diseases such as cholera, typhoid, measles and tuberculosis. Over the next five decades, the proportion fell steadily. By 2005, communicable diseases account for less than 15 percent of all deaths. In 1955, non-communicable diseases accounted for less than 25 percent of all deaths. This proportion increased steadily over time. By 2005, more than 75 percent of all deaths occurred due to non-communicable diseases. The top two leading causes of death today are heart diseases and diabetes mellitus. Accidents had accounted for less than 8 percent of all deaths in 1955. It rose slowly to 18 percent of all deaths in 1975. For the next two decades, accidental deaths accounted for more than 14 percent of all deaths every single year. Finally, by 1995, the deaths from accidental causes began its steady decline. Today, accidents account for less than 10 percent of all deaths. Figure 4 summarizes the coverage of insurance on the national scale for the year 2004. The data was from Social Security. According to them, around 47 percent of the population had no coverage at all in 2004. That meant, 53 percent had at least some coverage. The coverage varied across regions. In some areas, for some people, the coverage was total. On the other hand, in some rural marginal regions, the coverage meant a health clinic with very little facilities and perhaps with a nurse but no qualified medical practitioners.. Figure 3 Causes of Death in Mexico, 1955-2005 80 70 60. Percent. 50 40 30 20 10 0 1955. 1965. 1975. 1985. 1995. 2005. Year Communicable. Non- communicable. Source: González-Pier, et al. (2006).. 102. Inujuries.
(7) WELL-BEING AND SOCIAL POLICY VOL 4, NUM. 2, pp. 99-125. Figure 4 Coverage of the Insured Versus the Uninsured in Mexico, 2004. Uninsured 47% Insured 53%. Source: Secretaría de Salud (2006).. Figure 5 gives a breakdown of coverage by types of institutions. The biggest coverage of 37 percent comes from the IMSS–the national social security scheme that started operating in 1943. The second biggest coverage of 9 percent comes from ISSSTE–the institution covering the employees of the Federal and State Governments along with some municipal government (as well as some government owned school, colleges and universities).. Figure 5 Health Insurance Coverage by Institution, 2004. IMSS Oportunidades (To be covered) 9%. IMSS 37%. To be covered 37%. Seguro Popular 5%. Others 3%. Source: Secretaría de Salud (2006).. 103. ISSSTE 9%.
(8) AN INVESTIGATION INTO THE COST OF UNIVERSAL HEALTH COVERAGE IN MEXICO. 1. Patterns of Expenditure: Private Public Split of Expenditure One curious pattern is observed in Mexico. On one hand, private health insurance coverage is minimal. Even in 2004, less than three percent of the population has private health insurance. This pattern is quite typical in developing countries. On the other hand, the proportion of expenditure on health out-of-pocket is relatively high (see Figure 6). These two facts seem contradictory. They can be reconciled by observing the following. Even when affiliates of public system go to hospitals for treatment, they have to buy their own medicine in many cases. In some cases, they have to provide their own bed sheets, towels, soap, toilet paper and other consumables they would use in the hospitals. A longitudinal analysis is needed to understand the nature of out-of-pocket expenditure with changes in coverage. How much do Mexicans spend on healthcare? Table 1 gives us a clear idea for the current century. Between 2000 and 2006, both public and private expenditures have increased in absolute terms. However, the growth of private expenditure has outpaced the growth of public expenditure resulting in higher expenditure as a percent of GDP. This situation stands in sharp contrast with what has been the case in the past. For example, Fleury (2001) has shown that up to 1980s, the rate of public expenditure on healthcare far exceeded that of private expenditure. Mexico’s public sector spends 2.6% of GDP on healthcare. In contrast, public healthcare expenditure in Brazil is 3.4% in Argentina 4.7%, in Chile 4.4% and in Uruguay 6.4% of GDP (PAHO 2006). Mexico spent 6.4% of its GDP on healthcare in 2005 (both public and private sectors combined). This level of expenditure is somewhat unusual for middle-income countries. Figure 6 Public Versus Private Expenditure on Healthcare in Mexico, 2000-2005 100. Percent. 80. 60. 40. 20. 0 2000. 2001. 2002. 2003 Year. Private. Source: Secretaría de Salud (2006).. 104. Public. 2004. 2005.
(9) WELL-BEING AND SOCIAL POLICY VOL 4, NUM. 2, pp. 99-125. We have discussed the pattern of healthcare expenditure over time. As we know, average expenditure disguises the differences in healthcare expenditure in the cross-section of the population. Table 2 gives us some idea about the disparity that exists among different institutions in terms of healthcare expenditure. For the workers of the state-owned oil company PEMEX, the expenditure per capita is 11,208 pesos. This figure towers over all other groups. Affiliates of IMSS (mostly formal private sector workers) spend 3,619 pesos. Affiliates of ISSSTE (mainly Federal Government workers) spend 3,071 pesos per capita. Affiliates of Seguro Popular spend 2,155 pesos per capita. This number is surprisingly large, especially when we compare the other group of low income affiliates of the program: IMSS Oportunidades.. Table 1 Public and Private Expenditure on Healthcare in Mexico, 2000-2005. Year. Public expenditure. Private expenditure. Total cost. GDP. Cost as a percent of GDP. 5.6. (billion pesos). 2000. 177.3. 203.5. 380.8. 6,849.10. 2001. 185.9. 228.2. 414.1. 6,940.30. 6. 2002. 191.4. 244.8. 436.3. 7,078.50. 6.2. 2003. 209.7. 265.5. 475.2. 7,491.10. 6.3. 2004. 238.7. 274.8. 513.5. 7,965.80. 6.4. 2005. 243.8. 282.7. 526.5. 8,219.80. 6.4. Source: Secretaría de Salud (2006).. Table 2 Who Spends What (per capita, in pesos of 2005) PEMEX. 11,028. IMSS. 3,619. ISSSTE. 3,071. Seguro Popular. 2,155. SESA (states). 1,266. Oportunidades IMSS. 795. Source: Secretaría de Salud (2006).. 105.
(10) AN INVESTIGATION INTO THE COST OF UNIVERSAL HEALTH COVERAGE IN MEXICO. 2. Mexico’s Healthcare Expenditure in the International Context To discuss Mexican healthcare expenditure in the international context, we need a framework for such a discussion. How does one compare healthcare expenditure in one country compared with another? One simple stylized fact was discovered by Preston (1975) over three decades ago. He used scatter-diagrams of the cross-sectional relation between national income per capita and life expectancy for three decades during the twentieth century. The relations established appear to shift systematically during the century. In general, in order to attain a certain life expectancy between 40 and 60, a nation requires an income level almost three times greater in the 1930s than in the 1960s. This shift is corroborated by a changing structure of mortality by cause of death for populations at equivalent mortality levels. The magnitude of the shifts, combined with regional income data, suggests that some 75-90 per cent of the growth in life expectancy for the world as a whole over these three decades is attributable to factors exogenous to a nation’s contemporary level of income. Preston’s paper has stood up well to subsequent research and continues to provide guidance, as shown by the draft of the World Bank’s World Development Report 2004, which interprets Preston’s work as explaining advances in health at the same income level as attributable to “advances in technologies and leaps in knowledge about health and hygiene”. In a slightly altered form, the publication reproduces his iconic figure to illustrate that factors exogenous to economic development continued to reduce child mortality during the 1990s. Clearly per capita income serves as a proxy for a number of factors that influence healthcare outcomes. Since Preston did not have data for healthcare expenditure in different countries during the twentieth century, he used per capita income. One step further would be to examine per capita healthcare expenditure. Instead of using the data for all countries in the world, we use the data for the OECD countries. Since OECD includes only middle and upper income countries, it is easier to examine what is going on at the upper end of the Preston Curve. In Figure 7, we examine the relationship between healthcare expenditure per capita adjusted for purchasing power parity against a commonly used healthcare indicator: Life expectancy at birth. There is a clear, nonlinear relationship between life expectancy at birth and healthcare expenditure per capita among OECD countries. Specifically, higher income countries have higher life expectancies. However, the relationship does not have a constant slope. As income rises, the gain from income in the form of life expectancy gets smaller. Some countries seem to get a lower “bang for the buck.” Specifically, countries like Turkey, Hungary and the United States lie well below the regression line whereas Japan and Spain lie above – so does Mexico. Other factors are not taken into account in this story. For example, we have ignored the age structure of the population. We know that older population has higher need for spending on health. Overall, Mexicans spend less on healthcare than most countries with similar or higher level of income. In Figure 8, we compare Mexico with a range of countries in the region. The United States spends by far the largest proportion of its GDP on healthcare. However, the comparison with the US is not very illuminating. A better yardstick is to compare it with other countries in the region. There are three relevant things that might affect the expenditure: (1) a regional yardstick, (2) income per capita and (3) aging of the population. If we take Brazil, a country of comparable per. 106.
(11) WELL-BEING AND SOCIAL POLICY VOL 4, NUM. 2, pp. 99-125 Figure 7 Life Expectancy at Birth and Health Care Spending per capita, OECD, 2003 85 2. JPN AUS ESP NLZ ITA FRA AUT GRC. Years. 80. 75. MEX. KOR POL. R = 0.57 CHE NOR LUX. USA. HUN. SVK. 70. CZE. FIN IRL DNK PRT GBR. SWE ISL CAN NLD BEL DEU. TUR. 65 0. 1500. 3000. 4500. 6000. PPP adjusted US dollars. Source: OECD health database on life expectancy, World Bank database on per capita income.. capita income and size, we note that Brazil spends much more than Mexico. Brazil also has similar youthful population–generally, younger countries spend less as older population incurs more expenses on the account of healthcare. In that count, Uruguay, a relatively older country, is expected to spend more (as does Costa Rica). However, even a much younger country like Bolivia spends more on healthcare than Mexico. Figure 8 Percent of GDP Spent on Healthcare, 2004 14% 12% 10% 8% 6% 4% 2%. 107. o M. ex. ic. ia liv Bo. il az. ay. Source: PAHO (2006).. Br. gu ru U. Co. sta. U. Ri. SA. ca. 0%.
(12) AN INVESTIGATION INTO THE COST OF UNIVERSAL HEALTH COVERAGE IN MEXICO. 3. Towards Universal Coverage: Seguro Popular Table 3 illustrates the huge variability of coverage of social security (which includes healthcare) that exist across the states of Mexico. In Chiapas (one of the poorest states) 80 percent of families lack social security, while in the northern industrialized state of Nuevo Leon only 29 percent of families are without social security coverage. Thus, there is a huge regional disparity in the healthcare coverage across Mexico at a given point in time. Of course, this difference is explained mainly by the differences in the level of per capita income and the share of informality of the working population. The higher the proportion of formal population, the higher the penetration of social security and other ancillary services like healthcare. What is even more socially unjust, as Arredondo (2005) show, the poorer population in Mexico actually pay more out of pocket than their richer counterparts.. 4. Main Reason for Introducing Seguro Popular The main justification for the introduction of Seguro Popular was the catastrophic risk reduction function of such a plan. A survey about household expenditure is conducted in Mexico once every two years. One of the questions in that survey is about healthcare expenditure. The results of that survey between 1992 and 2004 are shown in Figure 9. It measures the “Share of Households with Catastrophic Health Expenditures”. First, the survey used the following definition of “Catastrophic Health Expenditure”: if a household spends more than 30% of its disposable income on healthcare, then it is considered catastrophic. Figure 9 shows that between 3 and 4.5% of the households spend that kind of money to combat health problems. To put that figure differently between two and four million households suffer from catastrophic and impoverishing payments for healthcare by having to spend 30% or more of their disposable income (total income less spending on food) on health (Knaul et al 2003). In addition, over 84% of these households are uninsured. To make matters worse, catastrophic expenditures are extremely common among the lowest income deciles. Thus, the financial burden of health care for families is inversely proportional to the ability to pay. Catastrophic health spending for the poorest quintile is concentrated in medicines, whereas for the richest quintiles it is more concentrated in hospitalization. Knaul et al (2005) suggest that, using the ENIGH 2000 data, every trimester, 3.4% of households suffer catastrophic health expenditures, 3.8% suffer impoverishing health expenditures, and in total 6.3% (1.5 million families) suffer at least one of either category. Further, the incidence of catastrophic and impoverishing expenditure is more than four times higher among the uninsured. The distribution of catastrophic and impoverishing health expenditures by quintile shows that there are no households in the highest quintile, and very few in the forth quintile, with impoverishing health expenditures. Catastrophic expenditures are also more concentrated among the poorest families but there are a fair number of families in the upper quintiles that also spend 30% or more of disposable income in any given trimester on health (Secretaria de Salud 2004).. 108.
(13) WELL-BEING AND SOCIAL POLICY VOL 4, NUM. 2, pp. 99-125. Table 3 Coverage of Social Security by State, 2000 Without social security. Percent without social security. 1,074,419. 430,000. 40. 3,107,509 528,405. 1,184,982 196,386. 800,761. 454,109. Federal entities. Total. Aguascalientes Baja California Baja California Sur Campeche Coahuila. 2,604,950. 669,524. 26. Colima. 605,676. 284,056. 47. Chiapas. 4,532,581. 3,632,291. 80. Chihuahua. 3,548,204. 1,290,109. 36. Durango. 1,564,631. 714,219. 46. Federal District Guanajuato. 8,815,694 5,135,773. 3,741,285 3,159,659. 42 62. Guerrero. 3,277,478. 2,471,050. 75. Hidalgo. 2,426,361. 1,635,683. 67. Jalisco. 6,920,659. 3,456,476. 50. Mexico. 15,111,713. 7,942,070. 53. Michoacan. 4,249,678. 2,997,567. 71. Morelos. 1,754,015. 1,069,008. 61. Nayarit. 1,009,999. 584,560. 58. Nuevo Leon. 4,368,708. 1,251,463. 29. Oaxaca. 3,759,653. 2,827,006. 75. Puebla. 5,644,594. 3,993,325. 71. Queretaro. 1,656,852. 813,088. 49. Quintana Roo. 1,168,375. 556,807. 48. San Luis Potosi. 2,427,887. 1,414,564. 58. Sinaloa. 2,816,245. 1,218,975. 43. Sonora. 2,561,882. 943,890. 37. Tabasco. 2,116,356. 1,397,889. 66. Tamaulipas. 3,276,594. 1,394,342. 43. Tlaxcala. 1,105,181. 712,575. 64. Veracruz. 7,332,834. 4,782,365. 65. Yucatan. 1,854,095. 916,559. 49. Zacatecas. 1,418,649. 917,140. 65. Note: Own calculation based on INEGI (2000). Source: CONAPO (2007), DGIS (2007).. 109. 38 37 57.
(14) AN INVESTIGATION INTO THE COST OF UNIVERSAL HEALTH COVERAGE IN MEXICO. Figure 9 Share of Households with Catastrophic Healthcare Expenditures, 1992-2004 4.5% 4.0% 3.5% 3.0% 2.5% 2.0% 1.5% 1.0% 0.5% 0.0% 1992. 1994. 1996. 1998. 2000. 2002. 2004. Source: Secretaria de Salud (2006).. 5. History of Seguro Popular… So Far The root of Seguro Popular (formally called Seguro Popular de Salud or SPS) can be traced to the plan presented in the 2001-2006 National Health Program (Programa Nacional de Salud, 20012006, PNS). The plan stressed equity concerns both with respect to financing and access to health care. The key reform of this ambitious health-sector reform program is the System of Social Protection in Health. This initiative aims at three objectives: (1) improving financial protection for those without social security coverage, (2) injecting new resources into the system, and (3) rebalancing the financial transfers from the Federal Government to the States. The focus is on “evidence based” approach championed by the then Health Secretary, Julio Frenk. The new system aims to provide progressively the population outside the social security system with a voluntary health insurance option (Seguro Popular, Popular Health Insurance). An important element is the voluntary nature of the new system. Thus, the system aims to be different from national health care systems that exist in Canada, UK or Australia. Seguro Popular scheme covers affiliated families with a package of essential interventions and selected catastrophic treatments. Such treatments and interventions cover over 90% of the demand for healthcare services. Financing is being covered through a combination of existing and new financial resources. For each affiliated family, the Federal and State governments each pay per family contributions, which are topped up by a small income-tested premium paid by the insured. The Federal and part of the State contributions represent new money added to the system, which is directed to those States currently receiving fewer resources from federal transfers. Specifically, there are two. 110.
(15) WELL-BEING AND SOCIAL POLICY VOL 4, NUM. 2, pp. 99-125. components of Federal Government contributions. First, there is a “social quota” (cuota social). This amount is fixed at 15 percent of the minimum salary per affiliated family. Second, there is a solidarity component (Aportación Solidaria Federal). The solidarity component is set at least 1.5 times the social quota. By introducing a mechanism that would allocate more resources to poorer states (also those with the largest shares of the population not covered by social security), the current inequitable federal health allocations to the States are intended to be offset gradually. However, it appears that some states have received more than others even though they are not necessarily the poorest states in Mexico. According to the 2007 first semester report of the National Commission for Social Protection in Health (CNPSS 2007), the average Federal Government transfer per family for the year 2007, was 2,922 pesos. This amount varies according to other Federal programs on health for each state. Thus, the amount of money allocated per state varied from 1,865 pesos per family to 4,407 pesos per family. The state of Puebla has received the maximum among all states even though it is not the poorest state. A separate fund was also established to finance public health and community health services, in order to ensure that public health services are not sacrificed during periods of budgetary restraint. Enrolment into the Seguro Popular scheme remains voluntary. The states have an incentive to affiliate as many people as possible as the allocation of new federal resources is contingent on the number of affiliated families. As providers’ payments will go where patients are actually treated, any provider operating in the Mexican National Health System can potentially provide the services. The principle of “money follows the patients” is intended to be a first step towards breaking the silos-style link between insurers and providers, although, at least in its initial phase, only State health facilities are likely to operate as providers of services in most states. With money eventually following the patient, it is also hoped that providers will have encouragement to improve quality and efficiency of provision (see Appendices 1 and 2). Table 4 gives us the rollout of Seguro Popular between 2002 and 2006. The first year of implementation of the new system, 295,511 families (around a million people) were covered in 21 states of Mexico. By 2006, it has been ramped up to 12 million people in all the states of the Mexican Table 4 Evolution of Seguro Popular, 2002-2006. Year. No. of families. No. of states. Spent in millions of pesos. 2002. 295,511. 21. 162.4. 2003. 622,819. 24. 618.4. 2004. 1,563,572. 31. 4,432.0. 2005. 3,555,977. 32. 8,316.4. 2006. 4,636,362. 32. 16,837.0. Source: White Pages of “Programa de Salud para Todos”, Secretaría de Salud (2006), Presidencia (2006).. 111.
(16) AN INVESTIGATION INTO THE COST OF UNIVERSAL HEALTH COVERAGE IN MEXICO. Republic. Even though it has been instituted in all the states, coverage has been uneven. In fact, there has been accusation that the rollout has been used for political purposes (see below for further discussion on this point). The original rollout plan for the system is set out in Figure 10 (see Appendices 1 and 2). The striking feature of the rollout plan is how linear the plan is! According to the plan, 14.3% of the eligible families (of the initial number of families targeted and not 14.3% recalculated over the new base) would be incorporated every year. Thus, over a period of eight years, all the uncovered population will be incorporated. This plan of incorporating over 50 million people in a voluntary health plan over a period of eight years is the most ambitious project ever undertaken by any country in the world. The idea of the constant rollout is that the new legislation is supposed to force the Ministry of Finance to include the corresponding resources in the budget process. However, any budget item has to be vetted by Congress every year. Thus, this item is subject to the normal negotiation between parties. Given that several years have elapsed, we can also check whether the coverage is on track or not. This actual coverage is also depicted in Figure 10. We have separately calculated how the coverage is evolving by calculating them for families as well as for individuals. Up until 2006, the coverage appears on target. We also calculated the actual rollout of the program for 2007. Since the final data we have is for June 2007, we have projected the rollout of January-June 2007 to December 2007. It shows that the rollout for 2007 would fall short of the target. What did actually happen? On Figure 10 Seguro Popular Coverage: Planned versus Actual, 2004-2010 100.0%. 100. Percent of Target Population. 85.7%. 80. 71.4% 57.1%. 60. 48.4%. 42.9% 42.9%. 40 28.6%. 20. 29.9%. 30.0% 27.2%. 14.3% 13.1%. 19.8% 9.2%. 0 2003. 2004. 2005. 2006. Origianl rollout. 2007. 2008. 2009. 2010. Actual evolution (persons). Actual evolution (families). Source: Own calculations based on data on Seguro Popular.. 112.
(17) WELL-BEING AND SOCIAL POLICY VOL 4, NUM. 2, pp. 99-125. February 4, 2007, Seguro Popular declared that instead of a target of affiliation of 6.8 million families, it has managed to achieve affiliation of 7.3 million families. This actually achieved 58% of coverage – better than 57.1% target (Seguro Popular 2007). Unlike other national health care schemes in other countries, the premium charged by Seguro Popular has a structure elaborated in Table 5. For the two lowest income deciles, the premium is set at zero per family. For the third decile, the premium is set at 661.31 pesos in 2007. For the next four deciles (that is, up to decile seven), the premiums go up roughly linearly. Thereafter, the premium goes up with an increasing rate. The formula used for setting these rates (except for the zero premiums) is to set them at the rate of 6 percent of income. The logic of setting the premiums at these rates is to make the scheme viable. As we know that Mexicans on the average spends (private and public expenditure) 6 percent of GDP, by setting a rate of 6 percent should be sufficient. However, there are two caveats. The first two income deciles have zero premiums. It is expected that most of the affiliates would come from this income brackets (they account for approximately 40 percent of the population). Second, it is unlikely that many of the highest income brackets would affiliate at all. They probably already have better coverage either through their employers or through IMSS. Hence, the government will not generate much revenue from the highest income individuals.. 6. Differences between Covered and Uncovered Population In Mexico today, we have two groups of people: one group with healthcare coverage, and another without one. Are there fundamental differences between the two groups in terms of their behavior Table 5 Premium per Family, Seguro Popular, 2007 Income decil. Family premium. I. -. II. -. III. 661.31. IV. 1,296.79. V. 1,921.24. VI. 2,624.58. VII. 3,378.89. VIII. 5,233.66. IX. 6,964.44. X. 10,539.66. Source: Seguro Popular website.. 113.
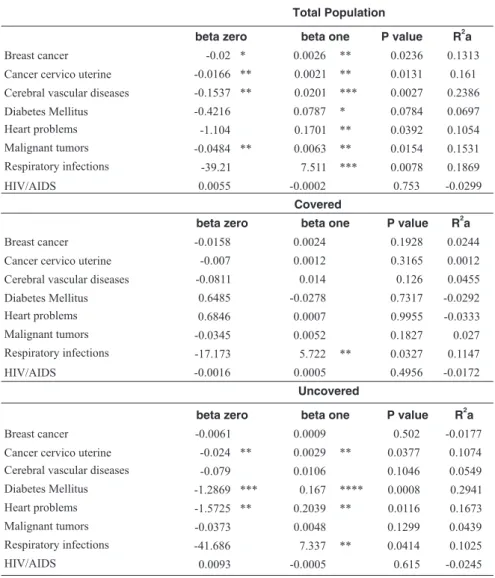
(18) AN INVESTIGATION INTO THE COST OF UNIVERSAL HEALTH COVERAGE IN MEXICO. with respect to healthcare? The answer is affirmative. The evidence comes from the Mexican Health and Aging Study (MHAS). That survey is undertaken for some 15,000 Mexicans over the age of 50. Using the data from their 2003 wave of questionnaires, Gonzales (2005) noted the following differences. The number of nights spent in hospitals in double for the insured population. The out of pocket amount spent on hospital care is less than half. The out of pocket amount spent for medical visits is less than half. The number of medical visits is almost double. Thus, there are substantial differences between the covered and uncovered populations, as shown in Table 6. The research question we ask in this area is the following: Do different diseases affect these two groups differently? For a series of diseases, we can answer this question. Data are available for (1) Breast cancer, (2) Cervical and uterine cancers, (3) Cerebral-vascular diseases, (4) Diabetes mellitus, (5) Heart problems, (6) Malignant tumors, (7) Respiratory infections, (8) HIV/AIDS for two groups by each state. Thus, we can calculate what proportion of people of each group is affected by these eight diseases to examine if there are differences. In particular, our prior hypothesis is that covered groups mostly work in the formal sector; therefore, they are better paid and have better nutrition. As a consequence, we would expect them to have lower incidence of most of these diseases with probable exception of cancers. In Table 7, we report the details of our statistical t-tests for equality of mean values of the diseases rates of covered and uncovered populations. The results show that for breast cancer, the difference between the two groups is significant. Surprisingly, the incidence among the covered population is three times as high as the uncovered population. For cervical and uterine cancers, the difference is not statistically significant. For cerebral and vascular diseases, there is a significant difference. The rates for covered population are more than double that of the uncovered population. For diabetes, once again, there is large difference. The rates for the covered population are twice as high as the uncovered population. For heart problems, there is a marginal difference. Once again, the covered population has a higher rate of heart disease. For malignant tumors and for. Table 6 Differences in Covered Versus Uncovered Populations, 2003 Insured. Not insured. Number of nights in hospital. 0.843. 0.482. Amount paid out -ofpocket for hospital care (pesos). 3062. 7871. 5. 2.72. 481. 1217. Folk healer. 0.105. 0.232. Sample size. 9,250. 5,899. Number of medical visits Amount paid out-ofpocket for medical visits (pesos). Source: Data from MHAS website.. 114.
(19) WELL-BEING AND SOCIAL POLICY VOL 4, NUM. 2, pp. 99-125. respiratory infections too, there is a large difference between the covered and uncovered populations. The rates are higher for the covered population. Only for HIV/AIDS, the uncovered population has a higher rate than the corresponding covered population. Most of these results are contrary to what we expected. What are the policy implications of these observations? Suppose we know the cost of treatment for each of these diseases for the covered population. Under the Seguro Popular, we are incorporating an additional group of people who were not covered before. We would like to know if the cost of treating this new group would raise the average burden or not. Given the results of Table 6, we conclude that per capita cost will not rise but will actually decrease after the inclusion of this uncovered group. Note that here we are not addressing the issue recently raised by the President of Mexican Central Bank, Guillermo Ortiz. He claimed that Seguro Popular is actually encouraging people to stay in the informal sector and even encouraging people to move from the formal to the informal sector. Ministry of Health has hotly contested the assertion (Shankland 2007). Next, we take a step forward from the international version of the Preston Curve. Suppose we want to know what goes on behind the Preston Curve. Specifically, suppose we believe the Preston Curve results about income and longevity in the form of life expectation. The results Table 7 Differences in Diseases Rates among Covered and Uncovered Populations. Diseases. Covered population (mean). Uncovered population (mean). t-value. Difference. Non-contagious Breast cancer. 0.0064. 0.0028. 3.4466. Large difference. Cervicouterine cancer. 0.0042. 0.0032. 1.3204. Cerebral vascular diseases. 0.0515. 0.0210. 7.5442. No difference Large difference. Diabetes mellitus Heart problems. 0.6915. 0.3546. 5.606. Large difference. 0.3856. 0.2917. 2.2533. Marginal difference. Malignant tumors. 0.0143. 0.0079. 3.0174. Large difference. 36.9128 0.0030. 27.6743 0.0043. 6.334 -2.792. Large difference Large difference. Contagious Respiratory infections HIV/AIDS. Note: We calculate the mean rates of incidence of covered and uncovered populations using data of federal entities in the entire nation. They are reported in the second and the third columns. In the fourth column, we calculate the t-value of the difference. If the value is significantly different at 1% level or lower, we call it a “large difference” (final column). If the difference is significant only at 5% level, we call it “marginal difference”. If the results are not different even at 5% level, we declare that there is “no difference”. Source: Own calculations.. 115.
(20) AN INVESTIGATION INTO THE COST OF UNIVERSAL HEALTH COVERAGE IN MEXICO. should show up at the sub-national level and it should extend not just to overall life expectancy but of all the components that go into the construction of life expectancy. Specifically, we should expect a relationship between various life threatening diseases and per capita income. In fact, if Preston Curve type relationships hold at the level of diseases, we should expect a negative relation between the incidence of diseases and the level of income. We have examined the direct link between per capita income and life expectancy at the subnational level for Mexico. We take each state as an entity. There are 32 such entities. We have data for per capita income across states for the year 2004 and corresponding life expectancy for each state. In the figure below, we plot them the same way as Preston did in his original study and in subsequent replications by other researchers. Thus, given the discussion above, the Preston curve suggests that we should expect a negative relationship between the disease burden and per capita income. We fitted a regression equation for each disease as follows: Disease x = beta zero + beta one x log(per capita income) We ran three sets of regressions: (1) for the whole population, (2) for the covered population and (3) for the uncovered population. The results of this experiment are shown in Table 8. The important parameter here is the beta one in each category. The most striking feature of all of these regressions is the following: For almost all diseases, for almost all populations, the disease rate is Figure 11 Preston Curve for Mexico, 2004 75.5. Life expectancy at birth. 75 74.5 74 73.5 73 72.5 72 5,000. 10,000. 15,000 20,000 25,000 30,000 35,000. GDP Per Capita in Pesos, 2004. Source: Own calculations.. 116.
(21) WELL-BEING AND SOCIAL POLICY VOL 4, NUM. 2, pp. 99-125. positively related to the per capita income. If higher rates of life threatening diseases mean lower life expectancy, then these results run against the intuition of what Preston Curves show at the international level. Table 8 Regression Results Total Population beta zero Breast cancer. beta one. P value. 2. Ra. -0.02 *. 0.0026. **. 0.0236. Cancer cervico uterine. -0.0166 **. 0.0021. **. 0.0131. 0.161. Cerebral vascular diseases. -0.1537 **. 0.0201. ***. 0.0027. 0.2386. Diabetes Mellitus Heart problems. -0.4216. 0.0787. *. 0.0784. 0.0697. -1.104. 0.1701. **. 0.0392. 0.1054. Malignant tumors. -0.0484 **. 0.0063. **. 0.0154. 0.1531. ***. 0.0078. 0.1869. 0.753. -0.0299. P value. Ra. Respiratory infections. -39.21. 7.511. HIV/AIDS. 0.0055. -0.0002. 0.1313. Covered beta zero Breast cancer. beta one. 2. -0.0158. 0.0024. 0.1928. 0.0244. -0.007. 0.0012. 0.3165. 0.0012. Cerebral vascular diseases. -0.0811. 0.014. 0.126. 0.0455. Diabetes Mellitus Heart problems. 0.6485. -0.0278. 0.7317. -0.0292. 0.6846. 0.0007. 0.9955. -0.0333. Malignant tumors. -0.0345. 0.0052. 0.1827. 0.027. Respiratory infections. -17.173. 5.722. 0.0327. 0.1147. HIV/AIDS. -0.0016. 0.0005. 0.4956. -0.0172. P value. Ra. Cancer cervico uterine. **. Uncovered beta zero Breast cancer Cancer cervico uterine Cerebral vascular diseases. -0.0061. beta one 0.0009. -0.024 **. 0.0029. -0.079. 0.0106. Diabetes Mellitus. -1.2869 ***. 0.167. Heart problems. -1.5725 **. 0.2039. Malignant tumors. -0.0373. 0.0048. Respiratory infections. -41.686. 7.337. 0.0093. -0.0005. HIV/AIDS. **. 2. 0.502. -0.0177. 0.0377. 0.1074. 0.1046. 0.0549. ****. 0.0008. 0.2941. **. 0.0116. 0.1673. 0.1299. 0.0439. **. 0.0414. 0.1025. 0.615. -0.0245. Notes: * Means significant at 10% level. ** Means significant at 5% level. *** Means significant at 1% level. **** Means significant at 0.1% level. R2a= R2 adjusted. Source: Own calculations.. 117.
(22) AN INVESTIGATION INTO THE COST OF UNIVERSAL HEALTH COVERAGE IN MEXICO. 7. Estimating Costs of Seguro Popular Seguro Popular is a subsidized program—especially for uncovered people in the low end of the income scale (see Table 5). It covers most diseases for the affiliates. Therefore, to estimate the cost, we need to have a good understanding of how much it costs today and how much costs will rise in the future. Unfortunately, such costs have not been calculated very well in the past. Arredondo et al (2005) only recently have constructed the cost structure of two chronic diseases: diabetes and hypertension. They find that costs ranged from US$613 to US$887 for diabetes, and from US$485 to US$622 for hypertension for 2005 (this figure is approximately the same as the one in Table 9 that we report below). To really calculate the total cost of all diseases covered, we need to have such estimates for each of the 95 diseases. Using different sources, we estimated the annual cost of each of the diseases and conditions we have discussed in the previous section. The Auditor General’s Office (Auditoría Superior de la Federación, 2006) has recently provided an evaluation of some elements of Seguro Popular. In the following table, we describe the accumulated balance to 2025 in the funds as projected by Seguro Popular. However, the Auditor General’s office shows that such calculations omitted six important elements: heart attacks, premature births, prostate cancer, severe burns, cornea and liver transplant and dialysis. Once we incorporate these six diseases, instead of generating a 257,433 million pesos surplus, it will produce a deficit of 430,458.3 million pesos.. Table 9 Annual Cost of Treatment for Various Diseases Diseases. Cost in Pesos (2005). Not contagious Breast cancer. $168,554. Cancer cervico uterine Cerebro vascular diseases. $113,229. Diabetes mellitus. $116,816 $7,670. Heart problems. $113,237. Malignant tumors. Not available. Contagious Respiratory infections. Not available. HIV/AIDS. $107,577.00. Source: Various.. 118.
(23) WELL-BEING AND SOCIAL POLICY VOL 4, NUM. 2, pp. 99-125. Table 10 Projected Cost of Seguro Popular for Catastrophic Illnesses (billion pesos). Year. Initial balance. Income. Medical cost. Administration Interest cost. Final balance. 2005. 717. 3,408. 1,357. 1. 160. 2006. 2,926. 5,793. 1,779. 1. 434. 2,927 7,373. 2007. 7,372. 5,597. 2,695. 2. 781. 11,053. 2008. 11,053. 7,452. 3,983. 2. 1,132. 15,652. 2009. 15,653. 9,474. 5,343. 2. 1,569. 21,351. 2010. 21,352. 11,671. 6,811. 2. 2,107. 28,317. 2015. 63,791. 14,806. 9,573. 2. 5,892. 74,914. 2020. 130,390. 18,644. 13,327. 2. 11,810. 147,515. 2025. 231,724. 23,382. 18,461. 3. 20,791. 257,433. Source: CNPSS (2005).. 8. Conclusions and Future Direction of Seguro Popular Recently, interesting results have come out of studies about Seguro Popular. For example, studying the preference of pregnant women in the program, Sosa Rubi et al (2007) concluded “Women in households that participated in the Seguro Popular program had a much stronger preference for having a baby in a Seguro Popular-sponsored unit rather than paying out of pocket for a private delivery. At the same time, participation was associated with a stronger preference for delivering in the private sector rather than at a state-run SSA clinic. On balance, the Seguro Popular program reduced pregnant women’s attendance at an SSA clinic much more than it reduced the probability of delivering a baby in the private sector.” In a recent evaluation in Lancet, Gakidou et al (2006) describe the Seguro Popular as a success story. They argue that “Data from ENSANUT show that a significantly lower fraction of Seguro Popular affiliates pay for medication (41.3%) compared to the uninsured (73.8%), but a higher fraction compared to individuals receiving social security benefits (30.7%).” They further contend that “Logistic regression results suggest that there is a significant protective effect of Seguro Popular against catastrophic payments at the population level.” There are several questions about their method. First, the sample size is not large enough to pick up the effects of such a program very clearly. Second, their regression method for evaluation is rather crude (Laurell 2007). Over time, as the system gets widespread, these problems can be mitigated.. 119.
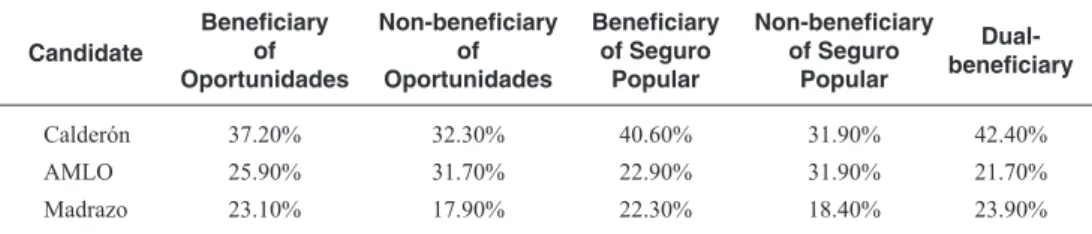
(24) AN INVESTIGATION INTO THE COST OF UNIVERSAL HEALTH COVERAGE IN MEXICO. There are also political questions hanging over the head of the program. For example, DiazCayeros et al (2006) argue that Seguro Popular is being used for political purposes. To buttress their argument, they point to the following table. It shows that the incoming president in 2006 got disproportionately large number of votes from the beneficiaries of Seguro Popular. It does not “prove” that Seguro Popular was used to this end as the cause and effect cannot be established from the table. New initiatives have been announced since the election of the new president in Mexico. For example, all newborns in 2007 were automatically covered by Seguro Popular by a Presidential Decree (provided the mother enrolls in the program). The government has also announced that Mexican migrants in the United States will also be covered. Unfortunately, there are many unanswered questions in these initiatives. How will they be funded? Nobody has come forth with an estimate of costs. Coverage of Mexican migrants will only be valid in Mexico. Thus, no mechanism has been set out to bring an injured or sick Mexican migrant who is physically in the US. Why is the government introducing new groups in the program? One possible interpretation is that it will attract people to the system, who are uninsured and who will bring additional families to the system. A voluntary system requires incentives to attract new people. In addition, there are deeper problems. Table 12 illustrates one of such problems: duplication. Specifically, there are individuals who are covered by more than one program. Despite many attempts to eliminate such problems, there are 132,962 (sum of the two numbers in read in Table 11) individuals in 2004 who belong to Seguro Popular and at the same time belong to IMSS and/or ISSSTE. Table 11 Who Voted for Whom. Candidate. Beneficiary of Oportunidades. Non-beneficiary of Oportunidades. Beneficiary of Seguro Popular. Calderón. 37.20%. 32.30%. 40.60%. 31.90%. 42.40%. AMLO. 25.90%. 31.70%. 22.90%. 31.90%. 21.70%. Madrazo. 23.10%. 17.90%. 22.30%. 18.40%. 23.90%. Source: Diaz-Cayeros, et al (2006).. 120. Non-beneficiary Dualof Seguro beneficiary Popular.
(25) WELL-BEING AND SOCIAL POLICY VOL 4, NUM. 2, pp. 99-125 Table 12 Comparison of the Covered Population by the Health Sector, 2004 Program. Total SIIPP-G. IMSS Oportunidades. 4’878,119. IMSS Oportunidades. Seguro Popular. IMSS ordinary regime. ISSSTE. 117,092. 113,266. 48,779. 120,379. 12,583. Seguro Popular IMSS ordinary regime ISSSTE. 2’434,699. 117,092. 12’432,988. 113,266. 4’059, 193. 48,779. 12,583. 261,426. Total. 23’804,999. 279,137. 250,054. 495,071. 120,379. 261,426. Note: 1/Sistema Integral de Información de Padrones de Programas Gubernamentales. Source: Own calculations from the dataset of the Secretaría de la Función Pública, 2006.. 121. 322,778.
(26) AN INVESTIGATION INTO THE COST OF UNIVERSAL HEALTH COVERAGE IN MEXICO. Annex. Figure 1 Affiliation and Budget by State, Seguro Popular, 2005. #. #. #. #. # # #. # #. N. # # #. #. #. Affiliated families to Seguro Popular, 2005 (%) Affiliated Not Affiliated. #. #. #. #. # #. #. #. #. #. #. #. #. # # #. Assigned budget. # #. $17,986,164 - $50,000,000 $50,000,001 - $100,000,000 $100,000,001 - $500,000,000 $500,000,001 - $975,000,000. 0. 20000000 40000000 Kilometers. Source: Comisión Nacional de Protección Social en Salud (2005).. 122.
(27) WELL-BEING AND SOCIAL POLICY VOL 4, NUM. 2, pp. 99-125. Figure 2 Affiliation to the National Health Scheme and Marginalization by State. N. Not insured (%) 2000 2005 Degree of marginalization Very high High Medium Low Very low. 0. 20000000 40000000 Kilometers. Source: INEGI. Censo de Población y Vivienda (2000); INEGI. Conteo de Población y Vivienda (2005); CONAPO. Índices de marginación (2000).. 123.
(28) AN INVESTIGATION INTO THE COST OF UNIVERSAL HEALTH COVERAGE IN MEXICO. References. Gonzales, Kristy. “Mexican Health Care System.” Presented at the University of North Carolina School of Public Health, Carolina Population Center, February 23, 2005.. Arredondo, A., A. Zúñiga, and I. Parada. “Health care costs and financial consequences of epidemiological changes in chronic diseases in Latin America: evidence from Mexico.” Public Health 119, no. 8 (2005): 711–720.. González-Pier, Eduardo, Cristina GutiérrezDelgado, Gretchen Stevens, Mariana Barraza-Lloréns, Raúl Porras-Condey, Natalie Carvalho, Kristie Loncich, Rodrigo Dias, Sandeep Kulkarni, Anna Casey, Yuki Murakami, Majid Ezzati, and Joshua A. Salomon. “Priority-setting for health interventions in Mexico’s System of Social Protection in Health”. Working paper prepared for the International Conference on Evidence for Health System Reform. October, 2006.. Auditoría Superior de la Federación. Informe del Resultado de la Revisión y Fiscalización Superior de la Cuenta Pública 2005. Mexico: Auditoría Superior de la Federación, 2006. Comisión Nacional de Protección Social en Salud (CNPSS). Informe de Resultados, Primer Semestre de 2007. Mexico, 2007. Comisión Nacional de Protección Social en Salud. Informe de Resultados. Primer semestre de 2005. Mexico, 2005.. Instituto Nacional de Estadística Geografía e Informática (INEGI). XII Censo General de Población y Vivienda 2000. México: INEGI, 2000.. Comisión Nacional de Protección Social en Salud. Valuación del Fondo de Protección contra Gastos Catastróficos del Seguro Popular de Salud. Cálculo de la Siniestralidad esperada, julio-octubre de 2005. Mexico, 2005.. Knaul, F., H. Arreola, O. Méndez, et al. “Fair Finance and Catastrophic Health Expenditures: The Potential Impact of the Extension of Popular Health Insurance in Mexico.” In Salud Pública de México 47, suppl 1 (2005):54-65.. Consejo Nacional de Población (CONAPO). Proyecciones de población 2000-2030. Mexico: CONAPO, 2007.. Knaul, F., H. Arreola, C. Borja, et al. “El Sistema de Protección Social en México: Efectos potenciales sobre la justicia financiera y los gastos catastróficos de los hogares.” In Caleidoscopio de la Salud edited by F. Knaul and G. Nigenda. Mexico: FUNSALUD, 2003.. Diaz-Cayeros Alberto, Federico Estévez and Beatriz Magaloni. “Buying-off the Poor: Effects of Targeted Benefits in the 2006 Presidential Race.” Paper presented at the Conference on the Mexico 2006 Panel Study. Boston: Harvard University, 2006. Dirección General de Información en Salud (DGIS). http://dgis.salud.gob.mx/ (consulted in 2007).. Laurell, Asa Cristina. “Health System Reform in Mexico: A Critical Review”. International Journal of Health Services, Vol. 37, No. 3 (2007): 515– 535.. Fleury, Sonia. Reshaping Health Care in Latin America: A Comparative Analysis of Health Care Reform in Argentina, Brazil, and Mexico. Ottawa, Canada: International Development Research Centre (IDRC), 2001.. Pan American Health Organization (PAHO). “Health Situation in the Americas. Basic Indicators, 2006.” Washington, D. C.: PAHO, 2006. Presidencia. Sexto Informe de Gobierno. México, 2006. Available online at: http:// sexto.informe.presidencia.gob.mx/. Gakidou, E. et al. “Assessing the effect of the 2001–06 Mexican health reform: an interim report card.” Lancet 368, no.9550 (2006): 1920–35.. 124.
(29) WELL-BEING AND SOCIAL POLICY VOL 4, NUM. 2, pp. 99-125 Preston S. “The changing relation between mortality and level of economic development.” In Population Studies 29, (1975): 231–48.. World Bank / International Bank for Reconstruction and Development. World Development Report 2004: Making Services Work for Poor People. New York: World Bank, Oxford University Press, 2003.. Secretaría de la Función Pública (SFP). Sistema Integral de Información de Padrones de Programas Gubernamentales (SIIPP-G). Mexico: SFP, 2006. Secretaría de Salud. Las Cuentas en Salud en Mexico 2001-2005. México: Secretaría de Salud, Subsecretaría de Innovación y Calidad, Dirección General de Información en Salud, 2006. Secretaría de Salud. Salud: México 2004. Información para la rendición de cuentas. Mexico, D.F.: Secretaría de Salud, 2005. Secretaría de Salud. Boletín de Información Estadística, 2004. Mexico: Secretaría de Salud, 2004. Secretaría de Salud. Hogares con gastos catastróficos por motivos de salud. México 2000. Mexico City: Secretaría de Salud, 2001. Secretaría de Salud. NAAIS. Panorama Epidemiológico 1998 – 2002. Sistema Único de Información para la Vigilancia Epidemiológica (SUIVE 1999-2002). Seguro Popular. Available online at: http:// w w w. s e g u r o p o p u l a r. s a l u d . g o b . m x / d e s c a rgas/ trasparencia/informederesultados2007.pdf (con sulted in 2007). Sepúlveda, Jaime, Flavia Bustreo, Roberto Tapia, Juan Rivera, Rafael Lozano, Gustavo Oláiz, Virgilio Partida, Lourdes García-García, and José Luis Valdespino. “Improvement of child survival in Mexico: the diagonal approach.” Lancet 2006; 368: 2017–27. Shankland, Ben. “Government Denies Seguro Popular is Fostering Informal Work Habits in Mexico.” In Global Insight, August 23, 2007. Sosa-Rubi, Sandra G., Omar Galarraga and Jeffrey E. Harris. “Impact of Seguro Popular on Obstetric Utilization.” National Bureau of Economic Research Working Paper No. 13498, 2007.. 125.
(30)
Figure

+2
Documento similar