Analysis of the use of financial services by companies in Mexico: What does the 2009 Economic Census tell us?
45
0
0
Texto completo
(2)
(3) WELL-BEING AND SOCIAL POLICY VOL. 8, NUMBER 2, pp. 3-45. ANALISYS OF THE USE OF FINANCIAL SERVICES BY COMPANIES IN MEXICO: WHAT DOES THE 2009 ECONOMIC CENSUS TELL US?* Sara G. Castellanos BBVAResearch [email protected]. E Javier Morales BBVA Research [email protected]. Mariana A. Torán BBVAResearch [email protected]. Abstract. W. e presenta descriptive analysis of the results of Mexico's 2009 Economic Census regarding the use of bank credit and accounts by productive entities (companies). INEGI was requested to prepare a set of statistics regarding various company characteristics that are relevant to the decisions made by institutions offering banking services. Information was grouped according to company size and to different business segments we defined based on their access to credit and/or use of banking services. This enabled to establish the size of the markets for bank credit and bank accounts, as well as to identify the phenomena of "voluntary rationing" and "involuntary rationing" (Stiglitz and Weiss 1981). Potential markets for 2008 are 1.5 million companies for bank credit and of 1.1 million companies for bank accounts. Involuntary rationing mostly impacts smaller companies and is more pronounced in the context of the use of bank accounts than in that of credit. Key words: Mexico; bank credit to firms; use of bank accounts among firme; micro small and medium enterprises; voluntary and involuntary rationing in financial markets. JEL Classification: G21, 016, 017.. We would like to thank the personnel at INEGI for their indispensable collaboration, especially José Luis Mercado Hernández and Susana Patricia Pérez Cadena, in the processing of the Census data and their valuable clarifications and suggestions. Adolfo Albo (BBVA Research) and the participante in the "MSME Support Policies" Conference (organized by the Inter-American Conference on Social Security, the Universidad Iberoamericana and the Economic Commission for Latin America and the Caribbean) also provided useful comments and suggestions for the drafting of this paper. The anonymous referees provided useful guidance to give this article its final form. Any errors in the creation of this article are the responsibility of the authors. The opinions expressed in this document do not necessarily coincide with those of the BBVA Group.. 3.
(4) ANALISYS OF THE USE OF FINANCIAL SERVICES BY COMPANIES IN MEXICO: WHAT DOES THE 2009 ECONOMIC CENSUS TELL US?. Introduction he principal channel through which credit influences economic growth is funding for private. T investment projects. For that reason, Mexican authorities, banks and business groups in. recent years have sought to fuel its expansion through the implementation of various measures and the proposal of multiple initiatives, particularly focused on granting credit to Micro, Small, and Medium Enterprises (MSMEs). Recent measures include the relaxing of requirements, such as eliminating the presentation of the Fiscal Identification Number in the credit application and the easing of documentation required based on the amount of the credit requested. Regarding the latter, the use of Bank Account Statements, instead of projected cash flows, is permitted for loans under 2 million UDIS and Audited Financial Statements can be presented for loans under 4 million UDIS.1 Another support measure consisted in the increase of public funds allocated to grant initial loss guarantees.2 The products designed by private banks to increase the credit supply to MSMEs include, for example, the BBVABancomer Tarjeta MicroNegocios (Micro-business card), with the support of the Nacional Financiera Guarantee Program, and the Banamex Club Emprendedor (Entrepreneur Club), which were both launched in August 2011. Against this background, the 2009 Economic Census (Census) included, for the first time, several questions to help understand the decisions made by Mexican companies regarding obtention of credit and use of bank accounts. The analysis of this Census information complements the information gathered through other official sources regarding bank credit to companies. These sources include the Credit Market Evaluation Survey (ECMC) conducted on a quarterly basis by the Bank of Mexico (Banxico) since 1998 and the National Survey on Micro-Businesses (ENAMIN) conducted by INEGI (the National Statistics and Geography Institute) over several years (the most recent being in 2008). On the other hand, some issues that are clearly appreciated when using Census data may not coincide with some of the ones that may come from the analysis of the two aforementioned surveys, due to aspects such as coverage and design. For example, ENAMIN. considers persons while Census data considers economic establishments; in mm, ECMC's sample is based on the Census of 2004 so as time has passed and sampled firms grow or become more experienced the ECMC may lose representativeness. As regards the use of bank accounts by companies, to the best of our knowledge, there are no other official sources of information in Mexico. Thus, the Census data offers an initial introduction to this topic. This data on use of bank accounts illustrates features of the economic units that employ deposit instruments, which in turra potentially facilitate access to other banking services, and thus constitute an initial link between the company and the banking system. In this regard, fostering electronic payments made by companies can be registered within the modernization schemes in the use of payment mean, in addition to being a tool that could help increase the degree of banking penetration in Mexico. In this article we show a descriptive analysis of the 2009 Economic Census data about use of bank credit and bank accounts among Mexican firms that operated in 2008. Since INEGI has still. 2. May 2, 2012 UDI and MXP/USD exchange rates: 1 UDI was 4.755 MXP; 12.99 MXP per USD. For more details, see Werner (2010).. 4.
(5) WELL-BEING AND SOCIAL POLICY VOL. 8, NUMBER 2, pp. 3-45. not made a microdata base for the Census data available to researchers and academics, in order to perform this analysis we asked the Institute to prepare a set of specific tables regarding various company characteristics that are relevant to the decisions regarding the supply of banking services (ownership type, years in operation, revenues, value of fixed assets, employment, payment of taxes, etc.). This information was provided grouped according to different business segments we defined based on whether or not they obtained credit and/or managed a bank account. This was done in order to establish the size of the market for credit and for attracting new customers, and to measure the differences between the companies' characteristics in each group. Also upon request, the information was provided in segments by stratum of employed personnel to establish four company sizes: Micro (O to 10 employees), Small (11 to 50 employees), Medium (51 to 250 employees) and Large (251 or more employees).3 The rest of this paper is divided into three sections. Section 1 focuses on the analysis of the information regarding the use of credit among companies. Section 2 focuses on the analysis of the companies' information regarding the use of bank accounts. Finally, conclusions and policy recommendations are presented in Section 3.. 1. Use of Bank Credit 1.1 Descriptive statistics According to the Census, in 2008, a total of 4,724,892 economic units (companies) were in operation in Mexico. Of them, 3,437,645 (73%) belonged to the Private and State-Owned Sectors.4 In that year, little more than 959 thousand productive entities obtained funding from banks or other non-banking sources (Table 1). In the group of companies that did obtain funding, the principal source of funds was internal, which is made up by funds contributions from owners, partners, relatives and friends. The second most important providers in company funding were banks, followed by popular savings banks (or cajas) and private lenders, vendors, government and other sources. Notwithstanding the aboye, the analysis of the sources of funding by company size, defined as the number of employees, suggests some differences in the relative importance of each one of the sources of funds worth mentioning. The pattern in which the primary source of funding is the owners and partners appears in companies with fewer than 10 employees (micro-businesses) and in those that employ from 11 to 50 people (small enterprises). These entities account for approximately 99% of the companies in the private and state-owned sector in Mexico.. 3 This classification of size by stratum of employed personnel is practical because it is in line with the classification used by INEGI in several basic tables. However, banks may give greater importance to the value of anual sales or to the complexity of the services demanded by the clients than to the number of employees. For the definition of economic unit see INEGI: www.inegi.org.mx.. 5.
(6) a 1 m cn -< cn 5n) o _, > = --I ,,, o= o ,, 111 m o m = rTI 'TI. Table 1 Economic Units in the Private and State-owned Sector in Operation During 2008 that Obtained Credit, Loans or Funding. Stratum of employed personnel. Economic units that obtalned credlt, loans or financing. Distributlon by source of funds (%) Owners, partners, relatives and friends. Banks. Popular savings banks and. Government. Suppliers. prívate. Other sources. lenders. IV Z. Units % Total. 959,628. 739,681 77. Units %. Units %. Units %. Units %. 167,359 17 110,837 12. 80,321 8. 24,183 3. 19,289. 2 2. Units %. 893,651. 699,818 78. 136,103 15. 11 a 50 employees. 51,834. 32,998 64. 23,165 45. 2,918. 51 a 250 employees. 11,407. 5,702 50. 6,588 58. 696. 1,225 45. 1,479 54. 22,520. 3. 6. 8,153 16. 1,306. 3. 1,907. 4. 6. 3,310 29. 287. 3. 1,102. 10. 874 32. 69. 3. 107,149 12. O a 10 employees. 251 and more employees 2,736. 8. 15,728. 81. 3. 68,007. 498 18. Note: Each economic unit reports all sources from which funding was obtalned; therefore, the sum of the distribution by source is over 100%. One example of tisis is the case of companies with between 11 and 50 employees. Source: 2009 Economic Census data.. 11. c o o oc m o zo m o C c3 o rn 0 cr> ITI = co cn -< 0 cn cp. -1 n m m„ D,„. r- , Ffi cn Ñ ..) cn 1" 1 1 >< c-, P..
(7) WELL-BEING AND SOCIAL POLICY VOL. 8, NUMBER 2, pp. 3-45. For companies with more than 51 and up to 250 employees (medium), and with 251 or more employees (large), banks are the primary source of funding. However, as can also be observed in Table 1, the most numerous group of companies that received bank credit in 2008 was that of entities of up to 10 employees, as 81.3% of the companies that received bank credit that year pertain to that segment (that is, 136,103 of the 167,359 economic units that reported banks as a source of funding).. 1.2 More than haif of the companies did not apply for credit because they did not need it With respect to the causes for which companies did not obtain credit, loans or funding in 2008, more than haif of them responded that they did not need it (Table 2). In order of importance, the following reasons were presented: i) bank interest rates are high; ü) belief that they did not meet the requirements; iii) distrust of banks; iv) not knowing the procedure for requesting it; y) distant location of the institutions; vi) they applied for it but it was not granted; and vü) other reasons. The percentage of companies that indicated that they thought interest rates were high was significantly higher in companies with 10 or fewer employees than in all other companies. Furthermore, data indicates that the percentage of entities that reported not having obtained credit because it was not granted to them was very low in all company size segments. To evaluate the responses presented in Table 2, it is important to consider the economic events occurring during 2008, the year the Census was taken. According to the Financial System Report of Bank of Mexico, for example, in the second part of 2008 there was an important contraction of economic activity: GDP and formal employment started to slow down since the 2Q-2008 and in 4Q the growth rates became negative. These factors adversely impacted supply and, due to the role of expectations on future activity, could have also significantly influenced the demand for credit.. 1.3 Potential market for bank credit for companies To analyze the size of the potential market for bank credit for companies, we have grouped the companies together based on having obtained credit into one of the four groups indicated below and illustrated in Table 3: • Group A. Those that obtained bank credit; • Group B. Those that obtained non-bank funding: owners, partners, relatives or friends, popular savings banks (cajas), and private lenders, vendors, government, debt issuance and other sources;. 7.
(8) Total O a 10 employees 11. 3,270,287. 54. 41. 13. 3. 3. 2. 1. 2. en. 3,150,920. 53. 41. 13. 3. 3. 2. 1. 2. 13 (-). 101,001. 67. 27. 6. 2. 1. 1. 3. 5. z cc. 14,860. 67. 20. 5. 1. 1. 0. 4. 7. 0. 0. 2. 11. a 50 employees. 51 a 250 employees 251 and more employees. 3,506. 69. 9. 3. 1. m r" yz..
(9) WELL-BEING AND SOCIAL POLICY VOL. 8, NUMBER 2, pp. 3-45. • Group C. Those that did not obtain funding because: the interest rates are high; did not believe they met the requirements; were unaware of the procedure for requesting it; the banks were located far from them; they applied for it but it was not granted; and other reasons (Involuntary rationing); and • Group D. Those that did not obtain funding because they presented a lack of interest in doing so or distrusted banks (Voluntary rationing). Groups C and D, which refer to companies that did not obtain credit, distinguish the entities that did not obtain credit for reasons related to characteristics of the products or of the suppliers that lead to, first, "involuntary rationing" (Group C) from those that, second, were related to a "voluntary rationing" on the demand side (Group D) (Stiglitz and Weiss 1981). The segmentation aboye enables the evaluation of companies that obtained funding from sources other than banks (Group B) and those that did not obtain it because the supply conditions were unattractive or inconvenient (Group C) as potential demanders of bank credit. Therefore, for 2008, the overall number of companies that could have used bank credit was slightly over 1.5 million; that is, 792 thousand companies from Group B plus 763 thousand from Group C (Table 3). Of the companies that were potential credit demanders, the percentage of entities that experienced "involuntary rationing" (Group C) in the category of those with 11 or more employees is under 10% (null among the largest companies). However, among micro companies it is at 23%; that is, nearly 1 in 4. In contrast, of the 1 7 million companies that did not demand credit dueto lack of interest or distrust of banks (Group D), the differences in the percentages by segment suggest a greater lack of interest or trust among smaller companies, but the differences are less unbalanced over the different segments.. 1.4. How do the companies differ based on obtaining credit or funding?. To better understand the characteristics of the companies that used credit and have clearer parameters regarding how much credit to companies could grow, below are a series of tables and figures about certain characteristics relevant to the decisions for supplying financial services. These characteristics are: i) Ownership type; ii) Years in operation; iii) Revenues and fixed assets; iv) Employment, compensation and productivity; v) Indicators of formal activity.. 9.
(10) Table 3 Economic Units in the Private and State-owned Sector Based on Having Obtained Credit or Funding D. Those that B. Those that C. Those that did not obtain A. Those who obtained did not obtain Stratum of funding because obtained bank non-bank funding because Total employed lack of interest or credit funding of other reasons personnel distrust in banks. o st.. 91. o en o en. 1T1 Cll. -n 171 "TI. Units Total. E,̀. O a 10 employees. %. Units %. Units %. Units %. Units. %. 3,437,645 100. 167,358. 5. 792,270 23. 762,966 22. 1,715,051 50. 3,287,048 100. 136,128. 4. 757,523 23. 755,391 23. 1,638,006 50. 11 a 50 employees. 124,165 100. 23,164 19. 28,670 23. 7,248 6. 65,083 52. 51 a 250 employees. 21,447 100. 6,587 31. 4,820 22. 427 2. 9,613 45. 5,085 100. 1,479 29. 1,257 25. 0. 2,349 46. 251 and more employees Source: 2009 Economic Census data. 0. Es m m co en 0 m en u,.
(11) WELL-BEING AND SOCIAL POLICY VOL 8, NUMBER 2, pp. 3-45. It is very important to bear in mind while reviewing the following analysis that the nature of the relationship between firm characteristics and different firm groups that we portray is not a statistical causality or correlation test, but simple stylized facts that emerge from average values of relevant population variables. 1.4.1 Ownership: Trading corporations tend to resort to bank credit more than to non - bank credit. Companies constituted as trading corporations are more likely to request external funding, particularly of the banking type, regardless of the stratum of employed personnel. The total companies that obtained bank credit or non-bank funding generally represent a greater proportion among trading corporations than among natural persons. The only exception is observed in the large companies segment, where this percentage is practically the same in both types of ownership and reaches nearly 50% (Figures 1 and 2). In terms of voluntary and involuntary rationing, there does not appear to be a significant difference associated to the type of ownership. 1.4.2 Years in operation: Companies with more time in operation in the market tend to obtain more bank credit. In general, of all the companies of Group A, those with 11 or more employees had more years in operation in the market than those with 10 or fewer employees. Moreover, for all company sizes, there is a greater percentage of companies with more than 5 years in operation among those of Group A than among the rest of the firms (Figure 3). Likewise, there is a slightly lower percentage of companies that started operations prior to 2004 in Group B than in Groups C and D, which also have a very similar percentage between them, independently of unit size. One explanation for this pattern consists in that the probability that a company continuing operating over several years may qualify to receive a bank loan tends to increase because it becomes an accredited productive entity, with a certain degree of operative efficiency that has allowed it to subsist, in addition to these companies understanding their market better than other similar companies that did not last. For these reasons, it could be easier for companies with more years in service to access bank credit. This finding coincides with Fenton and Padilla (2012) who document that most commercial banks require that a firm has been at least two years in operation for it to be a credit subject.. 11.
(12) ANALISYS OF THE USE OF FINANCIAL SERVICES BY COMPANIES IN MEXICO: WHAT DOES THE 2009 ECONOMIC CENSUS TELL US?. Figure 1 Natural Persons Based on Having Obtained Funding and Segment of Employed Personnel 60,000 50,000 40,000 30,000 20,000 47% 14%. 10,000. 33% 16% 11% 40%. pf 16%. 23% a 50 employees. 51 a 250 employees. 251 and more employees. ■ Companies that obtained bank credit ■ Companies that obtained non-bank funding • Without funding because of other reasons Without funding because lack of interest or distrust in banks Note: The group of companies with 10 or fewer employees is excluded due to scale problems. The corresponding. percentages are 3% for companies that obtained bank credit, 20% for companies that obtained non-bank funding, 33% for companies that did not obtain funding for other reasons and 43% for companies that did not obtain funding due to lack of interest or trust. Source: 2009 Economic Census data.. Figure 2 Trading corporations based on having obtained funding and segment of employed personnel 200,000 180,000 160,000. 54%. 140,000 120,000 100,000 80,000 60,000 40,000. 20%. 45% 6%. 20%. 20,000 7%. 21% 18%. O a 10 11 a50 employees employees. 40% 42% 8% 23% 20% 7% 28%. ,s / 12%. 251 and 51 a250 employees more employees. z Companies that obtained bank credit z Companies that obtained non-bank funding o Without funding because of other reasons Without funding because lack of interest or distrust in banks Source: 2009 Economic Census data.. 12.
(13) WELL-BEING AND SOCIAL POLICY VOL. 5, NUMBER 2, pp. 3-45. Figure 3 Percentage of Companies that Started Operations Prior to 2004 94%. O a 10 11 a50 51 a250 251 and employees employees employees more employees ■A. Companies that obtained bank credit ■ B. Companies that obtained non-bank funding ■ C. Without funding because of other reasons ■D. Without funding because lack of interest or distrust m banks Source: 2009 Economic Census data.. 1.4.3 Revenues, profit margin and the value of fixed assets tend to be greater among the companies that obtained bank credit. As expected, companies of Group Aliad greater revenues as compared to those of Group B (Figure 4.a). Nevertheless, Group A companies also had greater revenues with respect to those that did not obtain funding, especially with respect to Group C that we identified as being subject to involuntary rationing. The magnitude of the revenue difference between Group A companies with respect to the rest of entities is substantial, particularly between micro and small entegirises. For example, in the case of Group A micro companies, the annual revenues from the supply of goods and services by economic unit reached nearly 1.2 million pesos on average. The difference in revenues is 215% with respect to those of Group B (0.8 million pesos less, Figure 4.a); 174% with respect to those of Group D (0.7 million pesos less); and 345% with respect to those of Group C (0 9 million pesos less). Meanwhile, among the small companies, the differences in revenues between Group A companies (whose annual revenues per economic unit were 18.7 million pesos on average) and the other groups, respectively, were 90%, 104% and 220% (8.8, 9.5 and 12 8 million pesos less, respectively).. 13.
(14) ANALISYS OF THE USE OF FINANCIAL SERVICES BY COMPANIES IN MEXICO: WHAT DOES THE 2009 ECONOMIC CENSUS TELL US? Figure 4 Revenues, Profit Margins and Value of Fixed Assets per Economic Unit of Companies Differences Between Companies that Obtained Credit with Respect to the Other Groups of Companies in Percentage b) Difference in profit margins. a) Difference in revenues 300. 400 350. 345%. 300 250. 247%. 250 200 150. 220%. g, 200. 100. 5 150. 50. 100. O. 50. -50 -100. - 50 -100. -150. 251 and 51 a250 O al° 11 a50 employees employees employees more employees. -92%. O a 10 employees. 251 and 51 a250 11 a50 employees employees more employees. ■Companies that obtained bank credit vs those that obtained non-bank funding ■Companies that obtained bank credit vs those without funding because lack of interest or distrust in banks ■Companies that obtained bank credit vs those without funding because of other reasons. ■Companies that obtained bank credit vs those that obtained non-bank funding ■Companies that obtained bank credit vs Mose without funding because lack of interest or distrust in banks olCompanies that obtained bank credit vs those without funding because of other reasons. c) Difference in the value of fixed assets 250 215%. 200 150 5100. E 50. o -50 -65% -71% -100. 51 a250 251 and O a 10 11 a50 employees employees employees more employees. ■Companies that obtained bank credit vs those that obtained non-bank funding ■Companies that obtained bank credit vs those without funding because lack of interest or distrust in banks Companies that obtained bank credit vs those without funding because of other reasons Source: 2009 Economic Census data.. 14.
(15) WELL-BEING AND SOCIAL POLICY VOL. 8, NUMBER 2, pp. 3-45. The two patterns described aboye for revenues are broadly repeated in the case of the profit margin (calculated as the sum of revenues and taxes charged minus the total expenses and taxes paid, Figure 4.b) and of the fixed assets (Figure 4.c), since the latter yields the possibility of being used as collateral for some credit, which could occur particularly in the case of smaller companies.' These differences in profit margins and asset value of the Group A companies with respect to the others are again greater among micro companies. The data aboye indicates that, regardless of the size of the company, the greater the revenues or profit margins they generate, the more likely it is that they could access bank credit. Essentially, this situation would be reflecting that these companies have payment capacity. This situation also occurs in a similar way with greater assets of the companies, which would be reflecting that the entities in this case have a guarantee. This situation could also reflect that economic units with bank credit have a more professional management; unfortunately, the Census does not collect adequate data to verify this possibility.. 1.4.4 Companies that obtained bank credit also employed more workers, paid higher compensation and were more productive. The information from the companies that obtained bank credit, observed from the perspective of the compensation they pay and the number of employees indicates that of the micro companies, the percentage of employees remunerated with fixed salaries and wages is under 50%, while for larger firms this percentage exceeds 80%. Moreover, in this case, there is a gap of various percentage points between firms that obtained bank credit and the rest of the firms. Of the economic units with 11 or more employees, the percentage of entities that reported employing workers with fixed salaries or wages is over 80%, and there are only slight differences between the four groups of interest. In contrast, among companies with fewer than 250 employees, the group with the fewest employees with fixed salaries and wages is Group C. Another difference among the groups of companies analyzed is given by the value of the salaries paid and profits distributed to the personnel per economic unit. For total average values, these were 2.6 times greater among economic units of Group A than among companies of Group B (Table 4). This comparison of salaries and profits distributed to the personnel per economic unit among companies of Group A is still marked with respect to the two groups of companies that did not obtain funding; they are nearly 3 times with respect to the companies from Group C and 4.7 times with respect to those from Group D. A greater percentage of companies with less than 50 employees of Group A also reported having more employees working with a fixed salary, and these entities tend to employ more people and pay them slightly higher salaries than the productive units of Group B.. Of the micro companies that obtained bank credit in 2008, the profit margin per economic unit reached 226 thousand pesos on average, and the value of fixed assets per economic unit reached 396 thousand pesos on average.. 5. 15.
(16) r. Table 4 Salaries Paid and Profits Distributed in 2008 Pesos per Economic Unit (Average/Pesos) Stratum of employed personnel Total. A. Companies that obtained bank credit. B. Companies that obtained non-bank funding. C. Companies that did not obtain funding because of other reasons. rn O. D. Companies that did not obtain funding because lack of interest or dIstrust In banks. 1,465,421. 554,068. 314,378. 483,294. 139,279. 84,248. 75,893. 94,244. II a 50 employees. 1,117,779. 859,667. 800,500. 921,096. 51 a 250 employees. 6,526,080. 6,624,651. 5,713,783. 7,367,762. 0 a 10 employees. 251 and more employees Source: 2009 Economic Census data.. 55,698,465. 76,690,167. 125,072,215. 68,560,331. )=• m c m cn m mm. N). cz. c-J mr 5 Z crg. O Dj. C/). 07. co. CA. rn. > z. o O.
(17) WELL-BEING AND SOCIAL POLICY VOL. 8, NUMBER 2, pp. 3-45. The ratios of fixed assets and income per person for the companies of Group A versus the rest of the entities suggest that the salary differences between the categories of companies are associated with a greater productivity of the employment base. This is particularly true in the cases of Group A micro and small companies (Figures 5 and 6). Figure 5 Total Value of Fixed Assets per Worker Paid with Fixed Salaries and Wages (thousand pesos) 1,200 1,095 1,000 800 600 400 254 233 205. la. 200. 0 a 10 employees. 207193. 11 a50 employees. 51 a 250 251 and employees more employees. ■ A. Companies that obtained bank credit ■ B. Companies that obtained non-bank funding ■ C. Without funding because of other reasons mi D. Without funding because lack of interest or distrust in banks. Figure 6 Revenues per Worker Paid with Fixed Salaries and Wages (thousand pesos) 3,000 2,500 2,000 1,500 1,000 500 -. 11 a50 O a 10 employees employees. 51 a250 251 and employees more employees. ■ A. Companies that obtained bank eredit ■ B. Companies that obtained non-bank fimding ■ C. Without funding because of other reasons ■ D. Without funding because lack of interest or distrust banks Source: 2009 Economic Census data.. 17.
(18) ANALISYS OF THE USE OF FINANCIAL SERVICES BY COMPANIES IN MEXICO: WHAT DOES THE 2009 ECONOMIC CENSUS Tal. US?. 1.4.5 The companies that obtained bank credit exhibit more features that suggest formality: They employ fewer unpaid workers or commission-only paid workers and pay more taxes. To infer the formality of the companies, we examine data on employment of unpaid individuals and on the payment of taxes and contributions.6 The employment of unpaid personnel, an aspect that can be strongly linked to a state of informality, is greater among micro economic units. However, this also occurs in larger units. This phenomenon is slightly greater among Group B and Group C companies than in the rest of the groups (Figures 7 and 8). In terms of payment of taxes and contributions to social security, data also indicates that Group A companies paid more contributions to social security and other social benefits than companies from the other groups. Thus, in 2008, for the case of companies of Group A, the average expenditure per company for social security and other social benefits reached 396,930 pesos. This figure was greater than the 256,244 pesos paid for this same item among companies of Group B. The companies of Group D had social security expenditures of 210,390 pesos on average. Finally, the companies of Group C had expenditures of 138,585 pesos on average in social security. Figure 7 Percentage of Economic Units with Unpaid Employees. o a 10 11 a 50 employees employees. 51 a 250 251 and employees more employees. ■ A. Companies that obtained bank credit ■ B. Companies that obtained non-bank fimding ■ C. Without Binding because of other reasons e D. Without fi.mding because lack of interest or distrust in banks Source: 2009 Economic Census data.. In the Working Paper (available as BBVA Research Working Document 07/2012 at www.bbvaresearch.com) we also present the analysis of commission-based workers, which is another labor arrangement that has been argued to be associated with informality because it does not carry social security contributions.. 18.
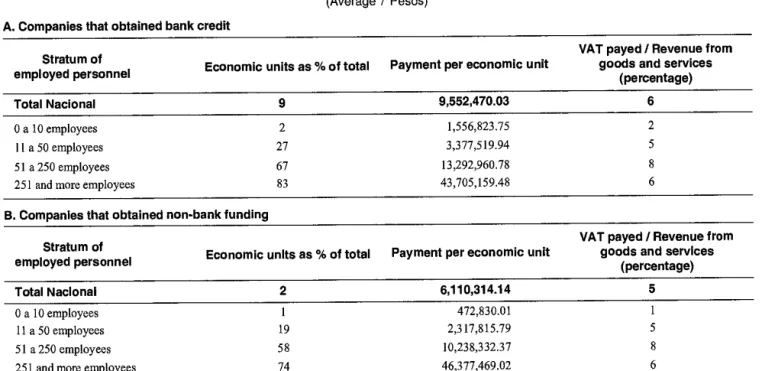
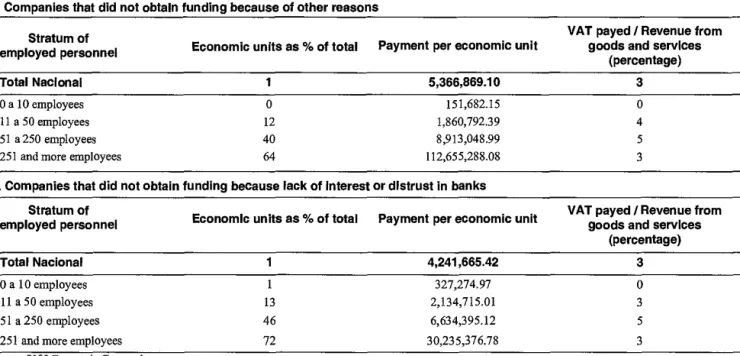
(19) WELL-BEING AND SOCIAL POLICY VOL. 8, NUMBER 2, pp. 3-45 Figure 8 Unpaid Employees per Economic Unit 213. O a 10 11 a50 employees employees. 51 a250 251 and employees more employees. ■ A. Companies that obtained bank credit ■ B. Companies that obtained non-bank funding ■ C. Without funding because of other reasons ■ D. Without funding because lack of interest or distrust in banks Source: 2009 Economic Census data. Other tax payment data also reveal that Group B companies tended to be more informal. For example, a greater percentage of Group A companies paid VAT. Moreover, the VAT payment per economic unit among Group A companies, on average, is greater than that of Group B companies, and this expenditure represents a greater percentage of the total sales income. This pattern is more accentuated among micro-businesses than among other ones (Table 5).. 1.5 What is the least expensive source of funding and how is it used? A small proportion of companies of Groups A and B reported having made interest payments. This information can reflect certain limitations of the Census, since, in general, only 8% of Group A entities, 1% of Group B entities, and practically none of the entities of Groups C and D reported this type of expenditure (though the latter may report interest payments from loans taken out previously). Notwithstanding the aboye, when comparing the first two groups, the amount of interest payments per economic unit are observed to be lower among Group A companies, except among the micro and small enterprises, with respect to companies of Group B. Though the information does not allow us to know if this is due to the fact that behind this expenditure is a greater loan amount or a greater interest rafe, the study by Hernández, Pagán and Paxton (2005) provides some evidence that, in effect, at least among micro-businesses, the average size of the bank lonas is. 19.
(20) Table 5 VAT Payment (Average / Pesos) c7) -‹. A. Companies that obtained bank credit Stratum of employed personnel. Economic units as % of total 9. Total Nacional. N 0. Payment per economic unit. VAT payed / Revenue from goods and services (percentage). 9,552,470.03. 6. O a 10 employees. 2. 1,556,823.75. 11 a 50 employees. 27. 3,377,519.94. 2 5. 51 a 250 employees 251 and more employees. 67 83. 13,292,960.78 43,705,159.48. 8 6. B. Companies that obtained non-bank funding VAT payed / Revenue from goods and services (percentage). rn en m 2cnCu -< =n. Total Nacional. 2. 6,110,314.14. 5. O0 g 'O p= n c Fi. O a 10 employees 11 a 50 employees. 1 19. 472,830.01 2,317,815.79. 1 5. n rál. 51 a 250 employees. 58 74. 10,238,332.37 46,377,469.02. 8. o. 6. Stratum of employed personnel. 251 and more employees. Economic units as % of total Payment per economic una. Cn IP . ..0 '''. E.
(21) Table 5 (continued) C. Companies that did not obtain funding because of other reasons Stratum of employed personnel. Economic units as % of total. Payment per economic unit. VAT payed / Revenue from goods and services (percentage). Total Nacional. 1. 5,366,869.10. 3. O a 10 employees 11 a 50 employees 51 a250 employees 251 and more employees. 0 12 40 64. 151,682.15 1,860,792.39 8,913,048.99 112,655,288.08. 0 4 5 3. D. Companies that did not obtain funding because lack of interest or distrust in banks Stratum of employed personnel. Economic units as % of total. Payment per economic unit. VAT payed / Revenue from goods and services (percentage). Total Nacional. 1. 4,241,665.42. 3. O a 10 employees 11 a 50 employees. 1 13. 327,274.97 2,134,715.01. 0 3. 51 a 250 employees. 46. 6,634,395.12. 5. 251 and more employees Source: 2009 Economic Census data.. 72. 30,235,376.78. 3. m r-. ceu. eu rm co z z>..
(22) ANALISYS OF THE USE OF FINANCIAL SERVICES BY COMPANIES IN MEXICO: WHAT DOES THE 2009 ECONOMIC CENSUS TELL US?. almost 17 times the size of the average contribution from personal loans and loans from friends and relatives. Moreover, Cotler (2008) presents the relatively large loan totals as a possible limiting factor to access to bank credit for micro-businesses. Regarding the use of the funding obtained, we observe that the percentage of companies that report allocating the funding to categories relating to "investment" (creation or opening of the business, equipment or extension of the business, purchase of a storefront or vehicle), is lower than the percentage who report allocating it to categories of working capital and other current expense headings (payment of debts, acquisition of supplies, payment of salaries and other uses, Table 6). However, the percentage of companies that reported allocating the funding to investment, with respect to the total, is greater among companies that obtained bank credit than among those that obtained non-bank funding. The analysis of the uses of the funding also suggests that the average amount of the loans of Group A companies tends to be greater than that received by Group B companies. Regardless of the size, the Group A units reported a greater number of uses for the credit obtained, such that the sum of them exceeds the number of uses given by the Group B category. Notice that although the Census does not collect information about managers, these trends would suggest that firms that have better management may access to credit more easily and pursue longer terco investments.. 1.6 Other relevant aspects of the credit to companies The Census shows that micro-businesses, due to their preponderance in the Mexican economy, constitute the majority of banks' customers. However, within this numerous group of companies, there is a large percentage of entities that experience involuntary rationing of bank credit associated with varying conditions of the credit supply that are not attractive to them, just as they believe the interest rates are high or that they do not meet the requirements. Even though the Census provides a more comprehensive view than the other official sources that reported the evolution of bank credit to companies, which are based on data sampler, it does not accurately measure the number of companies with funding, bank or non-bank, in 2008. The reason is that in the questionnaire, an affirmative or negative response is requested to the question if the economic unit obtained credit or funding in 2008. And to the question regarding the reasons for not having obtained credit, several companies answered that the reason was that they already had some type of loan that had been granted previously.' From this perspective, the information could be indicating the minimum number of companies with funding from sources outside the company in that year. The true quantity could be higher.. Among the large companies, other reasons for not having obtained credit in 2008 include being in a loss or suspension of payments situation, being foreign capital companies and/or having credit from the parent company abroad, being assembly plants, having funds from the United States and/or being public agencies. Source: INEGI.. 22.
(23) Table 6 Use of Loans and Credit Received A. Companies that obtained bank credit. Ocuppied personnel stratum Total O a 10 employees 11 a 50 employees 51 a 250 employees 251 and more employees. Total. Investment (creation or opening of the business, equipment or extensión of the business, purchase of a store front or vehicule). Working capital (payments of debts, acquisition of supplies, payment of salaries and other uses). Investment / Total (percentage). 167,358. 96,037. 111,472. 57. 136,128 23,164. 79,999 11,395. 78,770 22,195. 59 49. 6,587 1,479. 3,708 935. 8,420 2,087. 56 63. B. Companies that obtained non-bank fundIng Ocuppied personnel stratum Total O a 10 employees 11 a 50 employees. Total. 792,270 757,523 28,670. Investment (creation or opening of the business, equipment or extensión of the business, purchase of a store front or vehicule). Working capital (payments of debts, acquisition of supplies, payment of salaries and other uses). Investment / Total (percentage). 169,985 163,879 4,856. 180,346 168,024 8,750. 22 17. 51 a 250 employees 4,820 967 2,593 251 and more employees 1,257 283 979 Note: Each economic unit reports all of the uses it made of the funding; therefore, the sum of the uses differs from the total economic units. Source: 2009 Economic Census data.. 21. 20 23.
(24) ANALISYS OF THE USE OF FINANCIAL SERVICES BY COMPANIES IN MEXICO: WHAT DOES THE 2009 ECONOMIC CENSUS TELL US?. Although the study of the causal relationship between credit and informality does not fall under the objectives of this analysis, the marked relationship appreciated in the data between access to credit, on the one hand, and certain paneras in the hiring of employees with no fixed salaries and with low leveis of payment of various tax contributions, on the other, deserves attention. The lack of funding is a possible cause for why companies do not grow and/or are not formalized; but there are also many other institutional reasons that could be contributing to this phenomenon, like the excessive regulation or ease of tax evasion. Hence, besides to the design of appropriate credit products for micro and small enterprises, deepening government efforts to simplify the opening of businesses would be positive.. 2. What Does the 2009 Economic Census Tell us About the Management of Bank Accounts Among Companies? 2.1 Descriptive statistics regarding companies' use of bank accounts Of the 3,437,645 economic units reponed by the Census, only 668,574 (19.4% of the total) managed a bank account for checks, savings or investment (Table 7). Thus, the percentage of companies that held bank accounts in 2008 is 4 times greater than the percentage of companies with bank credit in that year. The use of this instrument varíes considerably in accordance with the size of the companies, measured by their employees. Of the smallest companies, only 16.7% of the total (550,296 economic units) had a bank account. As company size increases, the percentage of units with a bank account also increases; the figure reaches over 90% for companies with more than 50 employees. It should also be noted that micro companies are the largest group within the total, as well as within the total managing a bank account, as they represent 82% of all companies with a bank account. Of the 668,574 economic units that held a bank account, 14% of them had bank credit, 25% had non-bank funding and the rest (61%) did not report credit or funding. In line with the idea that if a company has a bank account, it is more likely to have other bank products, 39% of all companies with a bank account obtained some type of funding (14% bank and 25% non-bank), which is over the 25% (3% bank and 22% non-bank) of companies that obtained some type of funding despite not holding a bank account. In contrast, of the economic units that obtained bank credit (167,358 in 2008), 55% held a bank account. This percentage is higher than that of companies that had non-bank funding (21%) or that did not obtain funding (16%). This again indicates the positive relationship between having a bank account and having bank credit In addition, the number of units without a bank account (2,769,071) is 12% higher than the number of economic units that do not have credit or funding (2,478,017).. 24.
(25) Table 7 Economic Units in Operation in 2008 that Used a Bank Account (Number of Units and %) Economic units in the private and state-owned sector/ Stratum of employed personnel Total. Total O to 10 employees. 11 to 50 employees 51 to 250 pemployees 251 and more employees. 3,437,645 3,287,048. Percentage per occupied personnel estratum. Companies that Companies that used a did not use a bank account bank account 668,574 550,296. Companies that Companies that used a did not use a bank account bank account (percentage) (percentage). As T. of those hat used a bank account (percentage). 2,769,071. 19.4. 80.6. 100.0. 2,736,752. 16.7. 83.3. 82.3. 24.3. 14.1. 124,165. 94,037. 30,128. 75.7. 21,447. 19,488. 1,959. 90.9. 9.1. 2.9. 95.3. 4.7. 0.7. 232 4,985 4,753 Note: 1/ Applies to information provided by matrix and unirme establishments, not including branches. Source: 2009 Economic Census data..
(26) ANALISYS OF THE USE OF FINANCIAL SERVICES BY COMPANIES IN MEXICO: WHAT DOES THE 2009 ECONOMIC CENSUS TELL US?. 2.2 What are the reasons for not managing a bank account? With respect to the reasons for which bank accounts are not held, of the 2,769,071 economic units that do not manage a bank account, 60.3% (1,669,429) stated it was because they did not need one. This is the most common response even among companies with a greater number of employees (Table 8). The second most common reason for not holding a bank account is that the fees or minimums are high, followed by lack of understanding of how to open one and other reasons. The level of fees and minimums and the lack of understanding of the procedure for opening a bank account are indicated with greater frequency by micro-businesses than among the other companies.. 2.3 Voluntary versus involuntary rationing The reported reasons for not having a bank account are useful for classifying the economic units since firms may not use a product or service because of: i) the users' preferences, which the supplying party is less likely to modify, or the characteristics of the product or service, which the supplier can modify to make it more attractive or to incentivize its use. For the subsequent analysis, the companies are classified into the following groups: • Group E: Economic units with a bank account. • Group F: Economic units without a bank account due to lack of interest, as this group stated they did not need one. This case is considered voluntary rationing of deposit services. • Group G: Economic units without a bank account for other reasons, which is considered involuntary rationing of deposit services. This situation corresponds to the units that recorded as their reason for not having an account that the fees were high, not knowing the procedure for opening one and other reasons. Thus, when compared against the case of obtaining credit or funding reviewed in the previous section, "involuntary rationing" (Group G) is a much more significant phenomenon for the use of bank accounts: while 32% of the economic units stated that they lack a bank account for reasons other than lack of interest8, only 22% of the total reported not having credit or funding for reasons other than the lack of interest9 (Table 9). Moreover, as reported regarding credit in Section 2, involuntary rationing impacts smaller companies to a greater extent. On the other hand, voluntary rationing for credit is mentioned with a more uniform frequency among companies with different stratum of employed personnel (between 44.8% and 52.4%). In the case of voluntary rationing of bank accounts, the frequency is much higher in smaller companies For the management of a bank account, these reasons include: high fees and commissions, lack of understanding of the procedure for requesting it and others. For obtaining credit or funding, these reasons include: high interest rates, lack of understanding of the procedure for requesting them, the institutions were located far from them, they applied but were not granted credit and others.. 8. 26.
(27) Table 8 Reasons for Not Having a Bank Account (Number of Units and %) Total without a bank account. N -.I. Lack of interest. High fees or comissions are high. Not knowing the procedure for requesting it. Other reasons Stratum of employed % of total % of total % of total % of total % of total personnel Number Number Number Number Number without a without a without a without a without of economic of economic of economic of economic of economic bank bank bank bank a bank units units units units units account account account account account Total. 2,769,071. 100.0. 1,669,459. 60.3. 935,360. 33.8. 330,333. 11.9. 71,532. 2.6. O to 10 employees. 2,736,752. 100.0. 1,647,279. 60.2. 927,503. 33.9. 327,952. 12.0. 69,831. 2.6. 11 to 50 employees. 30,128. 100.0. 20,735. 68.8. 7,399. 24.6. 2,221. 7.4. 1,491. 4.9. 51 to 250 employees. 1,959. 100.0. 1,290. 65.8. 422. 21.5. 145. 7.4. 175. 8.9. 251 and more 232 100.0 155 66.8 36 15.5 15 6.5 35 15.1 employees Source: 2009 Economic Census data. In the case of reasons for not holding a bank account, the sum of percentages per stratum of employed personnel may be higher than 100% since the economic unit could indicate one or more of the reasons presented.. m. m reco rm. Z CC wel Ta ln s3 I o C, o..
(28) Table 9 Obtaining Credit or Funding Using a Bank Account by Willingness and Reasons (% of Total by Stratum of Employed Personnel) Use of a bank account. Access to credit or funding Stratum of employed personnel. F. Those G. Those D. Those that C. Those that did E. Those without a without a did not obtain not obtain that use funding because a bank bank account bank account unding because of because of lack lack of interest because of account other reasons of interest other reasons or distrust in banks. A. Those that obtained bank credit. B. Those that obained non-bank funding. Total Nacional. 4.9%. 23.0%. 22.2%. 19.4%. 32.0%. 0 a 10 employees. 4.1%. 23.0%. 23.0%. 16.7%. 33.1%. 11 a 50 employees. 18.7%. 23.1%. 5.8%. 75.7%. 7.6%. 51 a 250 employees. 30.7%. 22.5%. 2.0%. 90.9%. 3.1%. 251 and more employees 29.1%. 24.7%. 0.0%. 95.3%. 1.5%. 4. Source: 2009 Economic Census data.. Voluntary Rationing Involuntary Rationing.
(29) WELL-BEING AND SOCIAL POLICY VOL. 8, NUMBER 2, pp. 3-45. (50.1% compared to 16.7%, 6.0% and 3.1% in the rest of the strata of employed personnel). This suggests that this type of companies is further from formality since all of their transactions are made in cash. This has major implications in terms of the declarations of taxable income for the payment of VAT, as will be seen later on in this paper.. 2.4 The economic units with a bank account are more commonly constituted as trading corporations and record a greater number of years in operation The majority of economic units are made up by the self-employed (Figure 9); however, a considerably higher percentage of Group E companies are constituted as trading corporations (28%), as compared to companies of Groups F and G (3% and 2%, Figure 10), regardless of the stratum of employed personnel. The more pronounced differences regarding the type of ownership are observed in the smaller units. For example, in 2008, 18% of Group E companies that had up to 10 employees stated they were constituted as trading corporations. This is compared to the 3% of Group F companies constituted as trading corporations and 1% of Group G companies (Figure 10). In terms of years in operation, a greater percentage of the Group E units reported being in operation prior to 2004, for all company sizes (Figure 11). Among the younger companies, or those Figure 9 Ownership Type of Economic Units According to their Use of a Bank Account (Thousands of Economic Units, % of Total) 52 3%. 21 2%. 184 28%. E. With a bank F. Without a bank G.Without a bank account account because account because of lack of interest of other reasons ■Natural Persons ■ Trading Corporations Note: The sum of the percentages is less than 100% in Group E since the chart does not include the economic units performing government business or any international organizations. Source: 2009 Economic Census data.. 29.
(30) ANALISYS OF THE USE OF FINANCIAL SERVICES BY COMPANIES IN MEXICO: WHAT DOES THE 2009 ECONOMIC CENSUS TELL US?. Figure 10 Economic Units by Use of a Bank Account Constituted as Trading Corporations (% per Stratum of Employed Personnel) 98% 93%. 95%. 18%. 251 and 51 a 250 employees more employees. O a 10 11 a 50 employees employees. ■ E. With a bank account ■ F. Without a bank account because of lack of interest ■ G.Without a bank account because of other reasons Source: 2009 Economic Census data.. Figure 11 Economic Units that Started Operations Prior to 2004 (% per Stratum of Employed Personnel) 89% 88%. 251 and 51 a250 employees more employees. O a 10 11 a50 employees employees. ■ E. With a bank account ■ F. Without a bank account because of lack of interest ■ G.Without a bank account because of other reasons Source: 2009 Economic Census data.. 30.
(31) WELL-BEING AND SOCIAL POLICY VOL. 8, NUMBER 2, pp. 3-45. starting business in 2008, having a bank account is less common (Figure 12). However, in stark contrast to this pattern, the use of this instrument is more common in the smaller economic units than in the larger ones. This pattern could be due to the fact that the smaller companies are constituted as natural persons; therefore, they would be using the owner's bank account and not managing a separate account for business transactions. This could be a limiting factor of the Census information to the extent that no distinction is made of the applicable case: use of a personal account or use of a company account. Figure 12 Economic Units that Started Operations in 2008 (% per Stratum of Employed Personnel) 23%. 24%. 15%. 10% 10%. 251 and 51 a 250 employees more employees. O a 10 11 a 50 employees employees. ■ E. With a bank account ■ F. Without a bank account because of lack of interest ■ G. Without a bank account because of other reasons Source: 2009 Economic Census data.. 2.5 Cash fiows tend to be greater among companies that manage a bank account As the fiows of income and expenses generated through a company's business activity increase, the availability of a bank account becomes more attractive due to its advantages as an important instrument of administrative control and as a payment channel, since the bank account increases convenience, opportunities and security of the transactions and reduces their cost and uncertainty. In addition, the generation of a record of income, expenses and, as a result, the construction of information on fiows and the confirmation of profit margins could facilitate the process of obtaining credit. Group E economic units obtain greater income than those of Groups F and G, regardless of the size of the company (Figure 13). As a percentage of the income obtained, Group E units obtain higher income than those that experience involuntary rationing of this financial service (Group G, Figure14).. 31.
(32) ANALISYS OF THE USE OF FINANCIAL SERVICES BY COMPANIES IN MEXICO: WHAT DOES THE 2009 ECONOMIC CENSUS TELL US?. Figure 13 Difference in Revenues for the Supply of Goods and Services" (Average Million Pesos per Economic Unit) 600.0 527.0 500.0. 400.0 300.0. 200.0. 100.0. 56.1 63.8 1.0 1.0. 0.0. 8.8 9.8. O a 10 11 a50 employees employees. 30.. 51 a250 251 and employees more employees. ■E. With a bank account vs F. Without a bank account because of lack of interest ■ E. With a bank account vs G.Without a bank account because of other reasons. Figure 14 Difference in Revenues for the Supply of Goods and Services" (percentage) 600 500 400 o so a. 328%. 5 300. 275%. o. 0.. 200 143%. 100 4%. CalO 11 a50 employees employees. 251 and employees more employees 51 a250. ■ E. With a bank account vs E Without a bank account because of lack of interest ■E. With a bank account vs G.Without a bank account because of other reasons Note: 1/This refers to the difference calculated of the average revenues of the units with a bank account (Group E) minus the average revenues of the units without a bank account (Group F or Cr, as applicable). The percent difference is calculated as: (Revenues per economic unit with a bank account - Revenues per economic unit without a bank account) / Revenues per economic unit without a bank account. Source: 2009 Economic Census data.. 32.
(33) WELL-BEING AND SOCIAL POLICY VOL. 8, NUMBER 2, pp. 3-45. Economic units of Group E record higher expenses for the purchase of goods and services (Figures 15 and 16). This patena could be explained as a result of tax obligations; since in order to Figure 15 Difference in Expenses for the Purchase of Goods and Services" (Average Union Pesos per Economic Unit) 350 288.2. 300 250 200 150 100 43.7 47.3. 50 0.7 0.8. 7.4 8.0. -50 -100 -150 -200. -145.6 O a 10 11 a50 51 a250 251 and employees employees employees more employees. ■E. With a bank account vs F. Without a bank account because of lack of interest ■E. With a bank account vs G.Without a bank account because of other reasons. Figure 16 Difference in Expenses for the Purchase of Goods and Services". (percentage) 600 529%. 500 434%. 400 314%. 5 300 200. 131%. J. 100 O. -22%. -100. O a 10 11 a 50 employees employees. 51 a 250 251 and employees more employees. ■ E. With a bank account vs F. Without a bank account because of lack of interest io E. With a bank account vs G.Without a bank account because of other reasons Note: 1/This refers to the difference calculated of the average expenses of the units with a bank account (Group E) minus the average expenses of the units without a bank account (Group F or as applicable). The percent difference is calculated as: (Expenses per economic unit with a bank account - Expenses per economic unit without a bank account) / Expense per economic unit without a bank account. Source: 2009 Economic Census data.. 33.
(34) ANALISYS OF THE USE OF FINANCIAL SERVICES BY COMPANIES IN MEXICO: WHAT DOES THE 2009 ECONOMIC CENSUS TELL OS?. make payments of over 2,000 MXP deductible, they must be made by check, credit, debit or service card, or through authorized electronic payment channels. This thus requires the taxpayer to have a bank account. Indirectly, this result could be an indicator of formality, since, in order to comply with certain tax and social security obligations, a bank account is required to either make the respective payments or to exercise rights under fiscal regulations. With regard to the profit margin, Group E economic units recorded greater profits, both in absolute and relative tercos, as compared to companies without a bank account of Groups F and G. 2.6 The economic units with banking services recorded, in general: more salaried workers, higher compensation pay and better productivity indicators Group E units have a greater percentage of workers with wages and salaries for al' strata of employed personnel. The more pronounced differences in this indicator are recorded in companies with fewer than 51 employees (Figure 17). In the case of micro units, those of Group E report that 65% of their personnel is salaried, such that for companies of the same size with no bank account, this percentage is significantly lower: 27% in those of Group F and 21% in those of Group G In addition, for medium size firms, the average number of salaried workers is greater among Group E companies (Figure 18). In the case of large firms of Group G, they only reponed having 77% of their personnel salaried; however, the average salaried employees (715) was greater than for companies with a bank account (691) or those that did not have an account due to lack of interest (568). Figure 17 Percentage of Economic Units with Workers Paid with Fixed Salaries and Wages (%) 93% 88% 82% 76%. 83% 83% 77%. 71% 65%. 27% 21%. O a10 11 a 50 employees employees. 51 a250 251 and employees more employees. ■E With a bank account ■ E Without a bank account because of lack of interest ■ G. Without a bank account because of other reasons Source: 2009 Economic Census data. 34.
(35) WELL-BEING AND SOCIAL POLICY VOL. 8, NUMBER 2, pp. 3-45. Figure 18 Workers Paid with Fixed Salaries and Wages (Average per Economic Unit) 691. 3 2 2. 715. 18. O al° 11 a50 employees employees. 51 a 250 251 and employees more employees. ■E. With a bank account ■F. Without a bank account because of lack of interest ■G. Without a bank account because of other reasons Source: 2009 Economic Census data. The aboye characteristics illustrate the potential that economic units that already participate in the financial sector could have to incorporate other users into the banking system. Companies with a bank account can use them as a vehicle to pay their vendors or payrolls through a bank deposit to the worker's account. In tuna, the workers can have the funds available through debit card. The payroll account also works as confirmation of the workers' income, which can be useful if they would apply for credit. The benefit for companies is to be able to make various payments and expenditures in an efficient, transparent way. The aboye patterns could be associated with differences with average productivity of labor and total assets held, which, in general are more pronounced as company size increases. For example, the total value of the assets per salaried worker is greater in Group E units, and this difference is more pronounced for medium and large companies (Figure 19). In the case of micro companies it is interesting to note that the difference in assets per worker is not significant between Group E companies and those of Group F, and that those of Group G recorded a greater value of assets per worker. The reason could be that companies without bank accounts have assets as the rest of the firms, but they have a smaller number of salaried workers, which gives this ratio an upward bias.. 35.
(36) ANALISYS OF THE USE OF FINANCIAL SERVICES BY COMPANIES IN MEXICO: WHAT DOES THE 2009 ECONOMIC CENSUS TELL US?. Figure 19 Total Value of Fixed Assets per Worker Paid with Fixed Salaries and Wages (Average Thousand Pesos per Economic Unit) 800. 600 •. 400 310. 200 •. 213 209 221. 173 1 92. 182. ion "3 11 a50 O a 10 employees employees. 251 and 51 a 250 employees more employees. ■E. With a bank account is F. Without a bank account because of lack of interest • G. Without a bank account because of other reasons Source: 2009 Economic Census data.. 2.7 The economic units with a bank account record greater traits of formality, including compliance with tax and social security obligations The type of labor relations between the economic unit and the personnel it employs, together with the reported patterns of compliance with tax and social security obligations, may be indicators of the formality of the activities of each economic unit. In particular, besides facilitating the management and control of revenues and payments to employees and vendors, the presence of a bank account is useful for complying with payments associated to the fiscal burden and social security obligations of the company. In this regard, it is to be expected that the economic units that manage a bank account report greater traits of formality. In the case of the type of relationship with employees, a smaller percentage of Group E economic units report having unpaid personnel (owners, family members, etcetera). For example, in the micro units, 79% of those that hold a bank account reported unpaid personnel versus 95% recorded in the units of Group G. Moreover, there are fewer unpaid employees, on average, in Group E units. The difference in this average rises with the increased size of the economic unit. A trait that could suggest greater formality is that associated with the payment of social security contributions. In this case, a greater percentage of Group E companies make social security contributions, regardless of the stratum of the employed personnel. The difference with respect to companies of Groups F and Gis extremely large for micro, small and medium enterprises (Figure 20). In this case the size of the difference may imply a clear sign of formality for Group E firms.. 36.
(37) WELL-BEING AND SOCIAL POLICY VOL. 8, NUMBER 2, pp. 3-45. In terms of the payment of taxes other than VAT, a larger percentage of Group E units reported having paid taxes (Figure 21). This percentage increases with size and is over 1% in those under 11 employees and reached up to 59% in those over 250 employees. As regards compliance Figure 20 Percent of Economic Units with Employers' Contributions to Social Security Regimes (% by Stratum of Employed Personnel) 79.2% 69.7%. 80.5% 70.3% 59.7%. 11 a50 51 a 250 251 and O a 10 employees employees employees more employees ■E. With a bank account ■F. Without a bank account because of lack of interest ■ G. Without a bank account because of other reasons Source: 2009 Economic Census data.. Figure 21 Percentage of Economic Units that Paid Taxes, Excluding VAT (% by Stratum of Employed Personnel) 59%. 49%. 14%. 1%. 0% 0% 11 a50 O a 10 employees employees. 51 a 250 251 and employees more employees. ■E. With a bank account ■ F. Without a bank account because of lack of interest ■ G. Without a bank account because of other reasons Source: 2009 Economic Census data. 37.
(38) ANALISYS OF THE USE OF FINANCIAL SERVICES BY COMPANIES IN MEXICO: WHAT DOES THE 2009 ECONOMIC CENSUS TELL US?. with the payment and charging of VAT, a larger percentage of Group E units made these payments, regardless of size (Figures 22 and 23). This difference is more pronounced when compared against Group G units. Figure 22 Percentage of Economic Units with VAT Paid (Y. by Stratum of Employed Personnel) 77%. 58% 48%. 2%. 0%0%. 11 a50 O a 10 employees employees. 251 and 51 a 250 employees more employees. ■E. With a bank account ■E Without a bank account because of lack of interest ■G. Without a bank account because of other reasons Source: 2009 Economic Census data.. Figure 23 Percentage of Economic Units with VAT Charged (% by Stratum of Employed Personnel) 63%. 49%. 2%. 0% 0%. 251 and 51 a 2 0 O a 10 11 a50 employees employees employees more employees ■E. With a bank account ■F. Without a bank account because of lack of interest ■G. Without a bank account because of other reasons Source: 2009 Economic Census data.. 38.
(39) WELL-BEING AND SOCIAL POLICY VOL. 8, NUMBER 2, pp. 3-45. 3. Conclusions about the Use of Financial Services by Companies The analysis of Census information provides an important source for understanding the use of financial services among productive units throughout the country (see summary Figures 24, 25 and 26). Data indicates that the use of the financial services provided by the banks occurs in companies of all sizes that can be categorized as the "best performers" or "best risks" in each segment since they have an important set of attributes, such as: 1) more years in operation, 2) generate more revenue, 3) have more valuable fixed assets, 4) pay more taxes, 5) employ more salaried workers, 6) higher average labor productivity, among others. In fact, these advantages or strengths as a whole are a factor associated with companies' access to bank credit. Furthermore, this information suggests that, ex ante, there is an appropriate monitoring of the risks in granting bank credit.' In this way, all of the elements that enable the quantification and limitation of the risk of granting credit to companies will be allowing the economic units to have funding in the long-term to support the expansion of their production facilities and, therefore, to the country's economic growth process." Some policy recommendations to foster credit for MSME are the following: • Credit scores: One example that illustrates how important is the use of tools like credit scores or ratings for increasing access to credit is provided by Mexico's public provident housing fund (Infonavit), as this institution requires affiliated workers to have a minimum score to be granted a credit. The credit scores could be established by company size or by sales, and the information from the different company segments that already have credit could be used to construct the index or to develop the respective statistical tool. In addition, to incorporate more companies, especially those of a smaller size, to the databases of credit information associations, data could be added regarding the government's payments for its purchases from various providers of goods and services and for subsidies or aid programs, as well as that regarding the contributions of companies to the benefit of their workers for social security and to public institutions on housing. Mexican laws mandate the government to procure some of the goods and services it needs precisely from MSME, but at present those records of participation are not linked to the bureaus or easily accessed. • Credit bureaus: They are a key element of the infrastructure for supplying credit, since they mitigate asymmetric information problems that affect fmancial market transactions. Hence, the building of a universal credit bureau by means of adding data about more persons with entrepreneurial activities and firms who demand or use credit or improving data quality can contribute to boost credit by enabling the use of tools like credit scores or ratings.. ° This result coincides with the findings of evidence of effective monitoring or risk ex ante in the granting of credit to micro-businesses in Hernández-Trillo, Pagan and Paxton (2005). 11 It is important to remember that the data examined, which is cross-sectional, is not appropriate for establishing the cense of causality between funding and characteristics of the companies; therefore, these findings may also be interpreted as indicators of the positive impact of bank credit on economic growth. 1. 39.
(40) ANALISYS OF THE USE OF FINANCIAL SERVICES BY COMPANIES IN MEXICO: WHAT DOES THE 2009 ECONOMIC CENSUS TELL US?. Besides, even though credit bureaus at least in Mexico store information about firm owners, given that it is well documented that owner data is a good predictor of a firm's payment capacity, there could be benefits from adding non traditional data such as participation of MSME in govemment programs for promoting them, including financing and managerial capacity building. Recent impact evaluation of SME programs in countries of Latin America and the Caribbean performed by the World Bank document several programs that have a positive impact on participating firms' total sales, value added, fixed assets, and employment, which in this article we have seen that associate with access to credit.12 However, previous steps, at least in Mexico, consist on building a single Census of all firms that benefit from such SME programs and evaluating SME programs to assets the improvement in SME's performance. • Simplification of requisites to start business: This measure has been recommended to combat firm informality, and it could also expand access to bank credit. A recent study (Bruhn 2012) has found encouraging, though modest, results for reducing business informality associated with the implementation of the SARE (the Rapid Business Opening System).'3 Nonetheless, since the opening of a company is only one of the many requirements for operating a business in Mexico, more efforts should be made to further develop the agenda for the simplification of processes to carry out the steps in the three levels of government. • Improvement of guarantees registries: The most recent indicators of the Doing Business Report (World Bank) indicate that time, costs and processes for registering property in Mexico are high with respect to other emerging countries, so the improvement of these institutional aspects stands out as an important factor so that more micro-businesses, which normally have shorter credit histories because of their shorter time of operation in the market, can use their fixed movable and real estate assets as collateral to request bank credit. These reforms would also reduce the current need to allocate public funds to grant credit guarantees and would also allow those funds to be allocated to companies or investment projects in infrastructure or in the agriculture sector. • Analysis of determinants of firm survival: The topic of years in operation was relevant for both access to credit and the management of a bank account. It should be mentioned that one very useful concept consists in being able to determine the reasons why new companies survive and the reasons that generate their greater failure. This analysis could enable us to discover factors that can help mitigate the credit risk of companies and, therefore, facilitate their access to credit. • Periodical and frequent surveys among firms to measure credit penetration: It would be useful to guide policy recommendations to have an official survey in place that is conducted more frequently iban the Economic Census (as the next Census will not be taken until 2014). In 2011, the CNBV, Banxico and IADB, with the support of INEGI, conducted the ENAFIN (National Survey on Financing for Companies)." Its results will be published in the near future. If the ENAFIN yields data that is comparable to that of the Economic Census, it will be possible to measure if access to bank funding in the country has improved between 2008 and 2011. In this way, there will be an 12 See López Acevedo and Tan (2010) for more details about the effectiveness of SME programs in some countries. 13 For more information about SARE, see www.cofemertramites.gob.mx " See Salazar and Ríos (2012) for more details.. 40.
(41) WELL-BEING AND SOCIAL POLICY VOL. 8, NUMBER 2, pp. 3-45. opportune instrument in place to make better decisions regarding financial inclusion for both companies and their employees. It is important to mention that during the course of this investigation we detected that different information sources use different SME definitions. Therefore, a homogeneous definition could case targeting of programs, measurement of impacts and coordination among different agencies and banks. On the other hand, in the case of the management of bank accounts, the 2009 Economic Census gives a first look at the characteristics of the economic units that use bank's deposit services. The evidence indicates that companies that have a bank account also display significant attributes associated with efficiency and formality, as it also happens in the case of bank credit. When compared with the representative indicators for obtaining bank credit, what stands out is the fact that for both credit and the use of bank accounts, there is voluntary rationing, which implies an absence of demand for these financial products, since lack of interest or need is presented. This type of rationing is greater and more widespread in the case of credit, where it exceeds 44% of all economic units. In the case of use of a bank account, voluntary rationing is more prevalent, around 50%, among smaller companies. Given the traits detected in terms of relationship with the employees and payment of tax and social security contributions, this data (greater voluntary rationing in the use of bank accounts) could be related with the intent to not generate evidence of revenues obtained in order to remain informal and make the most of it in terms of tax and social security evasion. In the case of involuntary rationing, the bank product that is most affected are bank accounts. The high fees reason points, once again, to be the important challenge for financial institutions to create more appropriate products and services, especially taking into consideration that Basic Accounts for the General Public introduced in 2008 appear to have not garnered significant acceptance among the self-employed. Further analysis of the type and frequency of MSME transactions, beyond this article's scope, would be required to design or propose more suitable accounts. The other cause mentioned was lack of understanding of the requirements or procedures for opening a bank account. To attenuate its importance, the dissemination of the benefits of the use of a bank account, how to open one and the development of products more in fine with the specific needs of companies, especially those of a smaller size, could contribute to their extended use. In this case, the benefit of financial inclusion could be multiplied, since once the economic unit holds a bank account, it will be able to make its payroll and vendor payments, as well as to receive payments from its customers through electronic channels; this could then become a channel for introducing financial services to still more parties. Finally, it is important to note that the differences found between companies with and without bank accounts are very much in fine with those that differentiate between companies that have bank credit and those that do not. Another important idea is that despite the fact that bank accounts do not require proof of payment capacity, many of the variables for inferring it (revenues, assets, etc.) are relevant for their adoption. This does not necessarily have to be the case, and there is an important challenge in informing companies of the benefits of bank accounts for the firms' own cash flows management.. 41.
Figure
Documento similar