Crime and labor market, choice under uncertainty model and an application for colombian cities
23
0
0
Texto completo
(2)
(3) WELL-BEING AND SOCIAL POLICY VOL 6, NUM. 2, pp. 3-23. CRIME AND LABOR MARKET, CHOICE UNDER UNCERTAINTY MODEL ANDAN APPLICATION FOR COLOMBIAN CITIES Jaime A. Millán Quijamit University College London j.quijano@ucl.ac.uk. Abstract. T. his work offers a model to determine the crime supply function based on the theory of choice under uncertainty. From an agent who maximizes his utility subject to the contraints of legal an illegal markets the study proposes a crime supply function in terms of wages probability distribution and the certainly equivalent of some kind of crime and agent. Through the analysis of the certainly equivalent, the model explains how variables of security, income, ability and risk aversion affect the criminal rates. Furthermore, the empirical exercise, using panel data of crime an income variables for the metropolitan areas in Colombia, suggests offender and offended income relations explain part of criminal rates behaviour. Keywords: Criminal behaviour, choice under uncertainty, Colombia. JEL classification: K42, D81.. Introduction. T he study of criminal behavior and the determinants of crime rates evolution have called on the I interest of researchers from almost all social sciences. Law, psychology, politics, and economics have all analyzed this topic from different theoretical frameworks and have used a wide range of PhD in Economics Candidate. Department of Economics, University College London. Drayton House, 30 Gordon Street, London WC1H OAX, United Kingdom. This paper is a revised version of my MSc Dissertation at the Economics Department in UCL (The original version is from September 2007). I would like to acknowledge the considerable help given by the team of the Criminological Research Centre of Central Directorate of the Judicial Police and Intelligence (C1C-DIRIV) under de command of Major Alexander Useche who provided me the criminal reports of Colombia; furthermore, not lens important was the help of the Economics School of the Javeriana University-Bogotá, who provided me with the labor market data. Special thanks to Doctor Marcos Vera-Hernández for his wonderful supervision along this study. Finally, I want to thank my UCL MSc partners Gongyu Chen, Jerome Davids, and Catalina Solano from Alberta University for their useful comments.. 3.
(4) CRIME AND LABOR MARKET, CHOICE UNDER UNCERTAINTY MODEL AND AN APPLICATION FOR COLOMBIAN CITIES. empirical methods reaching different kind of results. On the other hand, the social cost and political impact of crime placed this topic in all the public policy makers' agenda, what is more, the decisions regarding the control and reduction of criminal rates affect the whole economical environment. Becker (1968) proposed the basic economic model of crime. In this paper the supply of crime is the result of the maximization problem of the individual who compares the expected utility of the criminal activities with the earnings of using the time and resources in other legal activities. On the other hand the demand of crime is the result of the minimization of the social cost of crime which includes the cost to the victim, the cost of punishments and imprisoning, and the public and private investment in security. The market equilibrium occurs when the marginal revenues of crime (supply) is equal to the marginal cost for the community (demand), giving the optimal number of offenses. From Becker many authors have use his model as a baseline to develop new approaches, for example Fella and Gallipoli (2008) proposed a life-cycle overlapping generation model with endogenous education and crime variable, the authors analyze the effect of different policies on education enrollment, crime rates, and wealth distribution. The results show that education investment is more cost-effective than police improvement; furthermore the best outcome is reached when the education is focused towards poorer people. The empirical approaches can be divided in two main topics. Some authors discuss the relation between market and wealth variables over the decision process and crime rates. For example, Bumett, et al. (2004), Grogger (1998), Doyle, et al. (1999), Kelly (2000), Levitt (2004), Machin and Meghir (2004), and Di-Tella, et al. (2006) link the economic markets and variables with the criminal activities. Variables like inequality, unemployment, income and wages are tested as determinants of different types of crime. For example Machin and Meghir show that changes in low wages affect negatively the crime against property rates in the United Kingdom. Furthermore Grogger finds similar results, using a three stages model based in a time allocation decisions framework in the United States. Levitt (2004) analyzes the falling crime rate in the United States during the 90's, in this paper the author explains how and why the strong economical situation, demographic changes, better police strategies, gun control laws, laws allowing the carrying of concealed weapons, and the increase of capital punishment use did no affect in a significant way the crime rate. Furthermore, he found that variables such as increased police presence and imprisonment, the legalization of abortion and an epidemic crack problem did have a significant effect. The second group of authors analyzes the deterrence effects. The principal works of this type can be Levitt (1997), Duggan (2001), Di-Tella and Schargrodsky (2004), and Machin and Marie (2005). The main problem with this kind of analysis is the endogeneity of the security investment; bigger cities have more police and higher crime rates. To solve this problem these authors used different kinds of instruments or policy evaluation methods like difference in difference regressions. The results are similar in almost all of the estimations and found a negative relationship between crime rates and police or security investment; nonetheless this relationship was not as strong as the authors were expecting. Notably, the literature on crime in Colombia has a somewhat different focus. In a country with more than 60 years of internal armed conflict, the interest of both Colombian and non Colombian authors have focused on the issue of violence. Most studies analyze the causes and consequences of the war between the government against the illegal organizations over 60 years. Some other. 4.
(5) WELL-BEING AND SOCIAL POLICY VOL 6, NUM. 2, pp. 3-23. authors focus on the drug dealing influences on the political, economical and social nets, and other representations of violent groups. It should also be noted that there is an absence of analysis that focuses on property crimes. Although, Rubio (1997) describes the crime characteristics in the urban environment in Colombia. He analyzes a special criminological module in the National Household Survey of 1995 in Colombia. Rubio argues that the crime rate in Colombia is similar to the internacional average but that Colombian crime is different in that it features significantly more violence. For example 40% of property crime in Colombia involved violence while only 3% of France's property crime featured violent activity. Another important observation made in this paper is that the calculation of the Colombian crime rate is likely deflated as many property crimes are not reported to the police due to a lack of proof concerning the damages. More recently works like Levitt and Rubio (2005) show a broader view of any type of crime in Colombia. The work concludes that in terms of violent crime the Colombian rates are aboye Latin American average but the country has no differences with other in terms of property crimes. What is more, the authors remark the information problem resulting for the small rate of crime report. This work follows Becker (1968) as well and proposes a simple maximization problem complemented by an empirical exercise to contribute in the political debate of property crime in Colombian cities. The paper structure is the following. Section 1 set up the theoretical model to build up an aggregate supply of crime function. Section 2 describes the data followed by the empirical strategy in Section 3. Section 4 presents the results and Section 5 concludes.. 1. The Crime Supply Function This section contains the theoretical model where a single agent faces two markets: crime and labor. The model clearly follows the idea of Becker (1968) and many others. I use the theory of choice under uncertainty to determine the supply function of crime against property.'. 1.1 Setting up the model In the framework proposed in this work the individuals gain utility only from consumption. The utility function U(x), which represents the individual preferences, is continuous, strictly increasing and quasiconcave in the range x E [c0 ,co]. represents the minimum consumption levet of subsistente, I assume that before Co there is no utility. Moreover I assume that the agent risk aversion is measure by the coefficient a. Initially the individuals will be risk adverse with a <1.2. ' I do not model violent crime. The analysis can be done for risk neutral and risk lover individual with. 5. a=1. and CY>1 respectively..
(6) CRIME AND LABOR MARKET, CHOICE UNDER UNCERTAINTY MODEL AND AN APPLICATION FOR COLOMBIAN CITIES. The individuals face two different markets. The labor market represents the legal option, for simplicity, this model supposes that the labor supply is completely cleared by the firms' labor demand and that there is no unemployment. Furthermore, in equilibrium, the individual earns a wage -w- which is equal to his marginal labor productivity. On the other hand, this individual face the crime market. In the latest the market the individual can get a prize Z with probability (1-p) and a penalty k with probability p. In this market the prize represents a proportion of the victim income, then Z = 4y, where e (0,1) and y represents the victim income. The penalty is the income (both legal and ilegal) forgone due to imprisonment. It may be represented as the amount consumed by the prisoner while in jail, lets assume that the imprisonment systems just guaranteed the minimum level of subsistence Co. From this, it may be seen that the expected value of the crime is a function of both the "in prison" consumption level and the value of the prize: E(crime)= pC0+ (1—p) 4y In this model it is assumed that the set of available prizes to an individual depends on his or her unique criminal ability. I assume that each individual prizes available set is describe by a crime production function g(0) where 0 represents the ability of the individual The latest function is continuous, strictly increasing and strictly quasiconcave. Then each individual will be able to get any prize Z such that Z g(0) Finally, I am going to assume that the abilities in criminal markets are positively correlated with the abilities in the labor markets, then higher 0 will represent higher w. Giving the latest the crime market can be summarize by: E(crime) = pC0 + (1— p)Z where 41y= Z S g(0) What is more, the expected utility of crime is: EU(crime) = pU(Co )+ (1— p)U(Z) where rpy= Z 5 g(0) The key point of this paper is the certainty equivalent (CE). At CE the agent is indifferent between entering or not in the gamble, then: U(CE) = pU(Co ) + (1— p)U(Z) where. g(0). Solving for CE: CE =1.1-1(pU(C))+ —p)(1.(Z)) where (by =Z g(19). 6.
(7) WELL-BEING AND SOCIAL POLICY VOL 6, NUM. 2, pp. 3-23. 1.2 The individual choice problem Suppose that individual i lives in city j at period t. This individual can earn a wage wo and has the ability Oit .3 For the crime s in the city j at period t the probability of being caught is pA.„ the penalty is ks, and the prize Zs,. Furthermore, the penalty is the same in any city for any crime and it is equal to the minimun level of consumption Cor. In this model, the labor and crime markets are perfect substitutes and the individual will choose between them.4 The individual maximizes his utility in the labor market subject to his wage and the consumption prices which are normalized to 1. = arg max U(Co,) S.t. C. lit. W. lit. The individual also maximizes his expected utility in the crime market subject to the following constraints: 2i„= arg max pist U;(15,)+ (1— pi„)U,(Zm ) zn. s.t. km = Co, Zi„g(9„) At this point it is important to note that consumers gain utility solely from consumption. Additionally, the labor and crime markets are perfect substitutes. For this reason, after an individual solves the maximization problem, he will compare his earnings in the labor market with those earnings expected in the criminal market. Being accurate, the individual compares his wage with his certainty equivalent. The latter is a function of the individual ability, degree of risk aversion (implicit in the utility function), and the probability of failure. Given this problem, and normalizing the number of crimes to one, the individual choice function is:. 1 if. (pmUi (C,„‘)+ (1 - pm) U, (max g(Oit ))) (1). O otherwise. 3. a. Abilities do not differ by cities. This is not a time allocation model.. 7.
(8) CRIME AND LABOR MARKET, CHOICE UNDER UNCERTAINTi' MODEL AND AN APPLICATION FOR COLOMBIAN CITIES. Equation 1 implies that a person i calmas one crime of type s in the period t if his wage is less than the certainty equivalent applicable to that type of crime. The type of crime committed is a maximization operation, where the criminal maximizes the value of the prize subject to the ability constraint.. 1.3 Aggregate supply function Coming from equation 1 adding all the individuals in the town j at time t for crime s will be: 19ftr =. Nist. Where Of„ is the number of criminal acts of type s at period t in city j and Nis, is the number of individuals such that w„, 5 CE, (pis„ Zjj and Zi„= max g(0„). The latter equation implies that the number of criminal acts is equal to the number of people whose wage is less than the CE for the specified type of crime. Although, is important to note that the type of crime committed is that which offers the criminal the maximum retum given his/her constrained ability. Dividing by the total population in the town j. O. óst N. N.. t. Supposing that the wages in town j at period t have a probability distribution with accumulative E (w r ). The latest equation can be read as the probability that one individual's wage is function F less than some CE, given that the according prize is the maximum prize feasible for this individual given his/her ability. Then, for each type of crime s the supply function for each town at period t is: aftt= Fi , 0.47 CEi (piso Zist)1 Ziss = max g(0„,)). (2). Figure 1 summarizes with a little example how to construct the aggregate crime supply from the individual decision problem.. CA(. Zsj= 11,-'(pi„U; (CO3 )+(1— ps)U;(;).
(9) WELL-BEING AND SOCIAL POLICY VOL 6, NUM. 2, pp. 3-23. Figure 1 From the Individual Problem to an Aggregate Supply of Crime. U(w). a. The Individual Problem: Each individual faces a crime gamble and decides between participating depending on the relationship between his wage and the corresponding CE. Then, any wage below CE would be likely to try the criminal activity with prize Z w. b.Ability Constraint: The set of feasible crime goods depends on ability. Omin (Z) represents the minimum ability necessary to reach the prize Z. Individuals with ability levels higher than 0 min (Z) would be able to enter in the crime market of prize Z. e. c. Wages Probability Distribution (w): Assuming that the correlation between wage and ability is equal to 1, the shaded area shows the proportion of the population willing to enter in the crime market of prize Z If the economy has only one criminal market, this area would represent the criminal rate of Z.. 9.
(10) CRIME AND LABOR MARKET, CHOICE UNDER UNCERTAINTY MODEL AND AN APPLICATION FOR COLOMBIAN CITIES. 1.4 Initial implications Equation 2 shows how the criminal rates can be explained as a function of the wages probability distribution, the risk aversion coefficient, ability, and the probability of failure or success in crime. This fact opens a window to analyse how different crime reduction policies can affect the decision functions of individuals Despite this advantage, this simulation is nota cost-benefit analysis, and only attempts to explain how different policies affect the decision processes of individuals Suppose a unique economy with the following characteristics. • N individuals with the same consumption preferences. • Two possible goods which can be stolen. Their prizes are 5>z. • The probability of failure po is the same for both goods. • The ability restriction is a concave function of the wage. The minimum of this function is go,„,(0)-= z. • The wages probability distribution is uniform between 0 and 1. • The initial values are 0=. ( z ) < CE,(z)< z < g-01 (5) < CE0(5)<5.. Given these assumptions, the initial crime rates for z and 2 are: F(w, < CE0 (z)) = CE„ (z) = F (go 1(5) <w, < CE0 (z)) = CE,(5)— go-1(5) The first scenario presented below depicts a change in the probability of failure of a criminal activity. This change can be the result of an increase in public security investment. Literature shows that these public policies reduce crime. Increasing the number or effectiveness of police officers increases the probability of catching a thief. As a result, of this higher probability, the certainty equivalent decreases. Thus, the probability that a wage being less than the CE in both goods cases (z&5). The magnitude of the change depends of the shape of the wages probability function and the concavity of the utility function. The derivate of the crime rate with respect to the probability of failure is:. r acE(z),(z) — ap = »vi< CE (z)) , Given that U(x) is increasing and concave and is F(w,) uniform, then:. aa (5) a5 (z) ap ap. 10.
(11) WELL-BEING AND SOCIAL POLICY VOL 6, NUM. 2, pp. 3-23. For this special case, the impact of this policy is larger in more valuable prize markets than in less valuable prize markets. Another possible crime reduction policy could be the investment in education. Fella and Gallipoli (2008), showed how this policy can be more effective than increasing police enforcement. Improving an individual' s education grants them a greater probability of finding a job with higher income, thus, decreasing the attractiveness of low-value illegal activities. If it is assumed that such a policy affects everyone equally, the wages probability distribution moves to the right and the number of people with inc ornes below the certainty equivalent falls. If however, as Fella and Gallipoli (2008) proposed, low-income individuals are targeted, the effectiveness of this policy can be improved. Investment in the education of low-income individuals shifts the lowest proportion of the wages probability distribution. If it is assumed that this is an exogenous shock and the individuals' abilities do not change, this policy will affect the crime rate of z alone, because the people who are only willing to commit crimes for high value prizes 5 are excluded from this educational policy. The effect of a direct subsidy targeting low-income families is likely to produce effects similar to those produced by a low-income education policy. This is due to the fact that it shifts only the lower portion of the probability wage distribution.. 2. Data Section 1 developed a theoretical framework to describe some of the features about the relations between crime and labor markets. This empirical exercise uses data from criminal reports and household surveys in Colombia from 1995 to 2003. The panel includes annual data of 13 metropolitan areas because the sample design of the household survey is not representative for higher levels of disaggregation like municipalities or neighbourhoods.6 The criminal reports in Colombia come from the Criminological Research Center of the Central Directorate of the Judicial Police and Intelligence (CIC-DIJIN).7 The reports are made yearly for each kind of crime defined by CIC-DIJIN and for each Pollee Department.' Following the theoretical model, this exercise focuses in crimes against the property and does not analyze crimes against the human live and integrity. These crimes are aggregated in four different groups to simplify the analysis, and are specified as following.6 6 The metropolitan areas are the main urban concentration regions in Colombia. They are principally the capital city of the biggest Departments. 7 CIC-DIJIN from the name in Spanish Centro de Investigaciones Criminológicas-Dirección de Policia Judicial e Investigación. The 13 Police Departments are: Atlantico, Bolivar, Caldas, Cordoba, Meta, Nariño, Norte de Santander, Risarlada, Santander, Tolima, Metropolitana de Bogota, Metropolitana de Cali and Metropolitana del Valle del Aburra. The first 10 Police Departments operate over all the municipalities of their own Department. The Metropolitana de Bogota only operates in Bogota, Metropolitana de Cali over Cali, Yumbo, Candelaria, Jamundi, Vijes, and La Cumbre. Metropolitana del Valle de Aburra operates on Medellin, La Estrella, Itagui, Caldas, Sabaneta, Envigado, Bello, Copacabana, Girardota, and Barbosa. 9 Crime definitions from the Information System of Delinquency, Crime and Operative Statistics of Colombian National Police-SIEDCO.. 11.
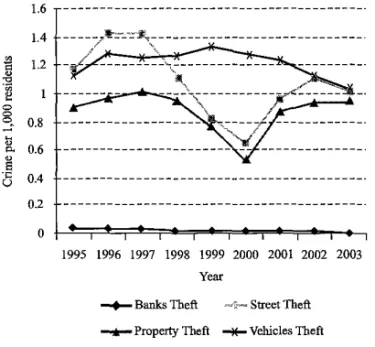
(12) CRIME AND LABOR MARKET, CHOICE UNDER UNCERTAINTY MODEL AND AN APPLICATION FOR COLOMBIAN CITIES. • Street Theft: Refers to the theft committed in the public space. •Property Theft: Household, office, shops, and every place where is developed and economical activity. •Vehicle Theft: Cars and Motorcycles Theft. • Banks Theft. Figure 2 shows the total crime rate per 1000 residents from all the metropolitan arcas from 1995 to 2003. The first important fact observable from the figure is the different magnitudes in the levels and variance of each aggregated type of crime. The street theft and property theft show similar evolution and fluctuates in the range 0.6 to 1.4 and 0.5 to 1 respectively. On the other hand, vehicle and banks theft tendency have less variance, although the banks theft levels are significantly below the other fluctuating from 0.006 to 0.03. This evidence, matches with the ability restriction assumption made in the theoretical model: easy crime markets have a higher number of occurrences and a higher variance compared to the more complicated crime markets. What is more, advance and expensive technology is required to enter in the bank theft market than the one required to street or vehicles theft market. From the demand side, this difference is related with the investment in security by the vicdms on each kind of market. The people just have the police aid in the streets but banks invest significant amounts of money to protect their capital.. Figure 2 Crimes against the Property Rates in the Metropolitan Areas in Colombia, 1995-2003 1.6. Crime per 1,000 residents. 1.4 1.2 1 0.8 0.6 0.4 0.2 0 1995 1996 1997 1998 1999 2000 2001 2002 2003 Year -4-Banks Theft. Street Theft. --r—Property Theft. Vehicles Theft. Source: CIC — DIJIN.. 12.
(13) WELL-BEING AND SOCIAL POLICY VOL 6, NUM. 2, pp. 3-23. Tables 1 to 4 contain the descriptive statistics of each type of crime and city. The city with the higher average level of street thefts is Bogota with 2.3 crimes per 1000 residents. On the other hand, the city with the lowest rate is Cali with 0.04 crimes per 1000 residents. Despite having the higher rate, Bogota shows the most important decrease from 3.3 to 0.9 compared to the increase from 0.1 to 2.0 for Ibague. The highest average of vehicle theft crime rate is given in Medellin (2.7 crimes per 1000), the minimum is Monteria with 0.19 crimes per 1000. Cucuta shows the larger decrease and Cali the larger increase in this type of crime (-0.47 and 1.26 points respectively). The maximum and minimum 8 years average or property theft are Bogota and Cali (1.6 and 0.16 respectively). The most significant increases on this crime rate is given in Ibague. The biggest decrease is given in Bogota. Banks robbery averages are close to zero, the maximum is Bogota (0.33 crimes per 1000 residents), which is the city with the more banks per capita in Colombia. On the other hand Monteria shows the minimum bank theft rate (0.001 crimes per 1000 residents).. Table 1 Street Theft per 1,000 Residents in the Metropolitan Areas in Colombia, 1995-2003 Police department. Year 1995. 1996. 1997. 1998. 1999. 2000. 2001. 2002. 1995 - 2003 average 2003. Barranquilla. 0.243. 0.200. 0.229. 0.385. 0.222. 0.188. 0.946. 1.647. 1.385. 0.605. Bogota. 3.377. 4.146. 3.995. 2.813. 1.798. 1.195. 1.574. 1.207. 0.988. 2.344. Bucaramanga. 0.240. 0.390. 0.462. 0.447. 0.808. 0.861. 2.034. 2.401. 2.537. 1.131 0.048 0.610. Cali. 0.087. 0.066. 0.012. 0.013. 0.024. 0.029. 0.071. 0.067. 0.060. Cartagena. 0.281. 0.318. 0.421. 0.577. 0.858. 0.639. 0.661. 0.952. 0.785. Cucuta. 0.457. 0.667. 0.945. 1.052. 0.902. 0.622. 0.544. 0.632. 0.786. 0.734. Ibague. 0.192. 0.350. 0.328. 0.177. 0.289. 0.950. 1.122. 2.196. 2.037. 0.849. Manizales. 0.363. 0.589. 0.383. 0.583. 0.831. 0.644. 0.943. 1.286. 1.352. 0.775. 0.396. 0.355. Monteria. 0.165. 0.106. 0.197. 0.099. 0.065. 0.924. 0.661. 0.580. Pasto. 0.207. 0.295. 0.606. 0.549. 0.351. 0.341. 0.597. 0.620. 0.560. 0.459. Pereira. 0.361. 0.535. 0.517. 0.772. 0.546. 0.789. 0.831. 0.706. 1.024. 0.676. Valle de Aburra. 0.129. 0.076. 0.207. 0.329. 0.286. 0.160. 0.429. 0.931. 0.804. 0.372. Villavicencio. 0.424. 0.242. 0.369. 0.179. 0.088. 0.093. 0.554. 1.139. 1.272. 0.484. Source: CIC - DB1N. 13.
(14) CRIME AND LABOR MARKET, CHOICE UNDER UNCERTAINTY MODEL AND AN APPLICATION FOR COLOMBIAN CITIES. Table 2 Property Theft per 1,000 Residents in the Metropolitan Areas in Colombia, 1995-2003 Police department. Year 2002. 2003. 1995 - 2003 average. 1995. 1996. 1997. 1998. 1999. 2000. 2001. Barranquilla. 0.432. 0.285. 0.484. 0.483. 0.423. 0.316. 0.883. 1.205. 0.943. 0.606. Bogota. 2.002. 2.314. 2.249. 2.040. 1.402. 0.783. 1.441. 1.238. 1.282. 1.639. Bucaramanga. 0.430. 0.333. 0.341. 0.242. 0.396. 0.524. 1.047. 1.183. 1.268. 0.640. Cali. 0.249. 0.156. 0.120. 0.094. 0.154. 0.145. 0.189. 0.165. 0.167. 0.160. 0.765. 0.640. 0.618. 0.673. Cartagena. 0.638. 0.507. 0.538. 0.612. 0.972. 0.768. Cucuta. 0.464. 0.454. 0.585. 0.725. 0.708. 0.521. 0.586. 0.566. 0.498. 0.567. Ibague. 0.331. 0.518. 0.758. 0.577. 0.726. 0.630. 1.125. 1.771. 1.655. 0.899. Manizales. 0.566. 0.666. 0.837. 0.801. 0.798. 0.716. 0.881. 1.064. 0.992. 0.813. Monteria. 0.244. 0.138. 0.106. 0.176. 0.257. 0.229. 0.208. 0.636. 0.767. 0.307. Pasto. 0.590. 0.664. 1.426. 1.003. 0.658. 0.627. 1.010. 1.593. 1.170. 0.971. Pereira. 0.548. 0.711. 0.885. 0.793. 0.577. 0.686. 0.689. 0.742. 0.745. 0.709. Valle de Aburra. 0.407. 0.430. 0.396. 0.491. 0.372. 0.267. 0.306. 0.435. 0.631. 0.415. Villavicencio. 0.424. 0.345. 0.381. 0.307. 0.319. 0.172. 0.702. 1.015. 1.457. 0.569. Source: CIC - DIJIN. Table 3 Vehicle Theft per 1,000 Residents in the Metropolitan Areas in Colombia, 1995-2003. 1995. 1996. 1997. 1998. 1999. 2000. 2001. 2002. 1995-2003 average 2003. Barranquilla. 0.815. 1.025. 0.844. 0.808. 0.666. 0.744. 0.681. 0.633. 0.416. 0.737. Bogota. 1.374. 1.471. 1.559. 1.379. 1.249. 1.187. 1.282. 1.086. 0.915. 1.278. Bucaramanga. 0.729. 0.924. 1.205. 1.320. 1.824. 1.382. 1.268. 0.925. 0.706. 1.142. 0.559. 0.880. 1.943. 0.836 0.275. Police department. Year. Cali. 0.677. 0.868. 0.607. 0.565. 0.676. 0.748. Cartagena. 0.157. 0.227. 0.213. 0.301. 0.319. 0.343. 0.333. 0.266. 0.318. Cucuta. 1.035. 1.511. 1.681. 1.985. 1.815. 1.564. 1.285. 0.928. 0.563. 1.374. Ibague. 0.646. 0.835. 0.903. 0375. 0.837. 0.756. 0.797. 0.720. 0.525. 0.755. Manizales. 0.663. 0.688. 0.758. 0.810. 0.846. 0.834. 0.680. 0.615. 0.507. 0.711. Monteria. 0.077. 0.125. 0.165. 0.221. 0.268. 0.203. 0.208. 0.224. 0.263. 0.195. Pasto. 0.618. 0.761. 0.676. 0.938. 1.230. 1.505. 1.371. 1.491. 0.971. 1.062. 1.241. 1.848. 1.765. 1.310. 1.033. 0.635. 1.238. Pereira. 0.908. 1.243. 1.159. Valle de Aburra. 2.535. 2.715. 2.443. 2.780. 2.970. 3.047. 2.930. 2.779. 2.256. 2.717. Villavicencio. 0.747. 0.809. 1.066. 0.941. 1.110. 0.855. 0.853. 1.059. 0.941. 0.931. Source: CIC - DIJIN.. 14.
(15) WELL-BEIN6 AND SOCIAL POLICY VOL 6, NUM. 2, pp. 3-23. Table 4 Bank Robery per 1,000 Residents in the Metropolitan Areas in Colombia, 1995-2003 Pollee department. Year 1995. 1996. Barranquilla. 0.012. 0.012. Bogota. 0.070. 0.062. Bucaramanga. 0.006. 0.033. Cali. 0.048. Cartagena Cucuta. 1995-2003 average. 1998. 1999. 2000. 2001. 2002. 0.011. 0.015. 0.008. 0.007. 0.015. 0.019. 0.018. 0.013. 0.067. 0.038. 0.025. 0.020. 0.008. 0.005. 0.004. 0.033. 0.008. 0.008. 0.021. 0.023. 0.015. 0.007. 0.004. 0.014. 0.033. 0.023. 0.022. 0.041. 0.027. 0.016. 0.016. 0.008. 0.026. 0.001. 0.003. 0.002. 0.007. 0.003. 0.000. 0.004. 0.004. 0.009. 0.004. 0.002. 0.007. 0.009. 0.007. 0.007. 0.009. 0.010. 0.008. 0.003. 0.007. 1997. 2003. Ibague. 0.012. 0.022. 0.010. 0.013. 0.023. 0.007. 0.006. 0.009. 0.004. 0.012. Manizales. 0.006. 0.002. 0.004. 0.010. 0.006. 0.004. 0.006. 0.003. 0.003. 0.005. Monteria. 0.002. 0.002. 0.000. 0.002. 0.000. 0.000. 0.000. 0.003. 0.000. 0.001. Pasto. 0.002. 0.011. 0.003. 0.007. 0.017. 0.004. 0.007. 0.008. 0.004. 0.007. Pereira. 0.006. 0.005. 0.017. 0.009. 0.022. 0.011. 0.010. 0.012. 0.005. 0.011. Valle de Aburra. 0.040. 0.042. 0.031. 0.041. 0.042. 0.021. 0.020. 0.016. 0.007. 0.029. Villavicencio. 0.013. 0.017. 0.017. 0.019. 0.020. 0.011. 0.009. 0.008. 0.006. 0.013. Source: CIC - DUIN.. The source for income data is the Colombian National Household Survey.'° From 2001 this data is reported monthly to the national level, quarterly for the total of the metropolitan arcas, and yearly for each metropolitan area. In this estimation I only use the yearly statistics to match with the criminal reports. Despite the fact that the theoretical model assumes that the wage is the only legal income source, the estimation uses total individual income." Even more, the analysis includes only people older than 12 years old. With this calculus the model assumes that all the income sources reported in the Household Survey are from legal markets. Furthermore, the decision between legal and illegal markets is just made by the people older than twelve. What is more, the econometric model uses as independent variables the percentile distribution of each area every year. The analysis focus in the fifth, tenth, twenty fifth, fiftieth (median), seventy fifth and ninety fifth percentile. Additionally, some exercises use the relationship between low income and high income percentiles.. 1° The survey has two different stages: before 2000 it refers to the Nacional Household Survey (ENH from the name in Spanish); alter 2003 it refers to the Continuous Household Survey (ECH from the name in Spanish). Income includes capital rentals, pensions, and other income sources.. 15.
(16) CFUME AND LABOR MAFIKET, CHOICE UNDER UNCERTAINTY MODEL AND AN APPLICATION FOR COLOMBIAN CITIES. The average evolution of the monthly income differs between percentiles of distribution (Figure 3). The fifth, fiftieth and ninety fifth percentile show similar evolution; the series is increasing before 1997 followed by a strong fall until 2000 and goes up again softly until 2003. Despite this close evolution the change magnitudes are different, the richest group index increase from 1 to 1.3. On the other hand the medium and low income groups fall, mainly the fiftieth which fall from 1 to 0.51 in comparison to the poor income which just fall from 1 to 0.75.. Figure 3 Monthly Individual Income Index by Percentile of Income, 1995-2003. 1.6 1.4 1.2 o 1. 0.8 0.6 0.4 1995 1996 1997 1998 1999 2000 2001 2002 2003. Year Percentile —.-50% Percentile —. 95% Percentile. Note: Total income per capita in constant pounds 2006 = 100; 1995 = 1. Source: National Household Survey — DANE Author index calculation.. The second key issue is the income distribution. Figure 4 shows the interquantile ratio (IQ).12 The minimum spread in1993 was in Bucaramanga (IQ of 2.48). The situation changed in 8 years, for 2003 Pasto shows the maximum spread (IQ of 4.12) and Cartagena has the minimum with 2.9 of spread. On the other hand, the largest increase during the period of analysis is in Pasto mean while Cartagena shows the lowest increase.. u. IQ = q75 ql 5. 16.
(17) WELL-BEING AND SOCIAL POLICY VOL 6, NUM. 2, pp. 3-23 Figure 4 Interquantile Income Ratio by Metropolitan Area in Colombia, 1995 and 2003 4.5 4 Interquantile ratio. 3.5 3 2.5 2 1.5 0.5. .11 a a --á 'á 70 o g U áo 11'. .9. fi. .a.. b z. A,. -21.1.1 ,. Área ■1995 III 2003. Note: Interquantile ratio (IQ) = q75Iq15. Source: National Household Survey — DANE.. 3. Empirical Strategy Section 1 developed a individual choice model to find out the individuals supply of crime as a function of the wages, the probability to be caught in a criminal activity and some unobservable variable like risk aversion level and individual ability. Although, in the last part of that section the model aggregates the individuals of one community to find out the total supply function of some kind of crime (see equation 2). Without the exact information about each individual utility function and the exact probability distribution is not possible to show the exact equation form of the aggregate crime rate. Despite this fact, this work will uses different specifications for the function aboye and will include fixed effects for areas and years to control the unobservable differences between metropolitan areas and periods. The main idea is quite simple, using different specifications, I am trying to find out which distribution quantile is more related with the income of the possible criminal and the possible victim. Initially I estimate the following linear function: 11#, = 13A 13,1 wq.,, (3,2 lvdt+ Xd+ rc,;+1-1#,. 17. (3).
(18) CRIME AND LABOR MARKET, CHOICE UNDER UNCERTAINTY MODEL AND AN APPLICATION FOR COLOMBIAN CITIES. Where 71,;t is crime s rate in period t in area j, wqtj is the percentile q of the individual income distribution at area j at period t, r;t is the same of the latest but for percentile r, X is an area fixed effect, TEsi is a year fixed effect and µ,;t is a random error term. The important features of equation 3 are wv.t which represents the income of the possible criminals and w which is linked with the reduce the income of the possible victims. The from the model I would expect that mereases in criminal retes because the amount of people below the CE for this type of crime would reduce so Psi< O. On the other hand, Rsz>0 if the prize of crime is a proportion of the victim's income. Higher prizes mean more attractive markets and more crime. What is more, I complement the analysis estimation 3 with 3 different non linear equations. Firstly I use the ratio of the victim and the criminal income - w In this case the model propone a wqo positive relation of this ratio with the criminal rate of each type of crime ((3,3 >0). Finally I use the logarithm of the dependent variables in order to check different kind of utility function which will imply different CE functions. Then, the following equations will be estimated with equation 3. Isjt = 10+ Ps3. Writ nit. = PA+ asi In(%) +11,2 111(wov)± Dsjt = Ps0+ as3 in. wdt Wq¡t. (4). +7EsJ• ±. Xsj. TCsj. Itsj + ilsjt. ilsjt. (5) (6). Before analyze the results is important to make the following note. The estimation method will be Pooled Panel Ordinary Least Squares. Given the possible heteroskedasticity and area autocorrelation, the OLS estimation will join with three different methodologies of the standard error. Standard errors robust to heteroskedasticity are shown in O. Standard errors clustered at the area level and competed analytically using a sandwich type formula as in Pepper (2002) are shown in H. These standard errors are robust to autocorrelation of the errors within regions. However, the formula used to compute these standard errors is only valid when the number of clusters is large enough Since we only have 13 regions, we show using { } the standard errors computed using block bootstrap because Bertrand, et al. (2004) show that the standard errors computed using block bootstrap behave better than analytically competed standard errors when the number of clusters is small.. 4. Results The econometric model tries to pick up the relation between victims and criminals which best fit with each kind of crime.. 18.
(19) WELL-BEING AND SOCIAL POLICY VOL 6, NUM. 2, pp. 3-23. 4.1 Vehicle theft. Table 5 show the main results on vehicle theft. Regression 1 follows the form of equation 3, regressions 2 and 3 the form of equation 4. Using logarithms regressions 4 and 5 follow equations 5 and 6 respectively.. Table 5 OLS Pooled Panel Regression for Vehicle Theft's in 13 Metropolitan Areas in Colombia, from 1995 to 2003 Independent variable. Regression number 1. Percentile 10. Percentile 25. 2. 3. -0.0826. 4. (0.038)**. (0.585)**. [0.037]**. [0.607]*. {0.037}**. {0.521}**. 0.056. 1.282. (0.022)**. (0.603)**. [0.025]*. [0.711]*. {0.028}* Percentile ratio 25/10. 5. -1.136. {0.639}** 0.663. 1.12. (0.353)*. (0.599)*. [0.357]*. [0.5971*. {0.329}**. {0.544}**. Percentile ratio 50/10. 0.273 (0.136)** [0.149]* {0.135}**. R2. 0.878. 0.881. 0.881. 0.881. 0.88. Notes: Dependent variable: vehicle thefts' per 1000 residents. (...) Robust heteroskedasticity standard error; [...] Robust heteroskedasticity standard error with area cluster; ( } Nonparametric bootstrap standard error with area cluster. Metropolitan atea and year fixed effects are include in all regressions. The percentiles refers to the monthly total per capita income distribution of people older than twelve years. The Percentile ratio (Z'2 is the division between the income percentile Z over the income percentile X. *** significant at 1%; ** significant at 5%; * significant at 10%.. 19.
(20) CRIME AND LABOR MARKET, CHOICE UNDER UNCERTAINTY MODEL AND AN APPLICATION FOR COLOMBIAN CITIES. Columns two and five show the negative relationship between the offense rate and the ratio between the twenty fifth and tenth percentiles, in the second column the independent variable is in levels and in the fifth this variable is in logarithms. Furthermore, the same relationship is shown in the third column but with the fiftieth and tenth percentiles. Columns one and four present the linear relationship between the same percentiles of the dependent variable in columns two and five. The negative coefficient of the tenth percentile and the positive value of the twenty-fifth percentile suggest that, for this case, the income level of the offender has a strong relationship within the lower tenth percentile of the income distribution. On the other hand, the victims are shown to have a relationship within lower quarter of the income distribution. The results are strong and consistent with the model proposed in Section 1. The criminal income is associated with the tenth percentile. The income of this population group might be below the certainty equivalent of vehicle theft and their abilities may be enough to achieve this kind of prize. The regression results using the fifth percentile as criminal income were not statistically significant. According to the theoretical model, this suggests that the poorest proportion of the population do not have the minimum ability and technology required to steal a car or a motorcycle. The victim's behavior is represented by the twenty- fifth and fiftieth income percentile. This relationship is stronger with the first quarter of the income distribution; using linear specification, logarithm or ratios the link with the criminal income and the crime rate is statistically significant. But why do the thieves victimize this particular group in place of those groups at higher income levels? In Colombia the vehicles are not luxury goods and are part of the capital of high, medium or low (not the lowest) income groups. Furthermore, the security in the richest areas of the cities is better than the others, high income people pay private security services to take care their cars at their houses and offices. For this reason vehicles belonging to those with higher incomes required more technology and ability to be stolen than those who are just parking in the streets or in garages such as those which belong to medium and low income individuals. One last interesting fact from the results is the robustness of the coefficients. The standard error computed with three different methodologies does not vary significantly which suggest the absence of area error autocorrelation.. 4.2 Other types of crime Street theft, property theft, and bank robbery did not show consistent and significant results as the vehicle theft did. Firstly, for the street theft I found some positive correlation with some income quantiles but the effect disappear when the model correct by area heteroskedasticity. On the other hand, both, bank, and property theft did not show any significant correlation. For the street theft I can identify two possible causes for the bad results. The first one can be a measurement error driven by the Jack of report for some events. Levitt and Rubio (2005) remark the importance of the low rate of report in the criminal analysis in Colombia. If the cost of report is larger than the lost of crime the individual would not report the event to the police and the statistics will have a positive bias. Moreover, when a person lost a car or a motorcycle the cost of. 20.
(21) WELL-BEINS AND SOCIAL POLICY VOL 6, NUM. 2, pp. 3-23. report is marginal in terms of the lost. Although, the lack of significant result for street theft might obey to the following behavior. The street crime could be the easiest representation of all crime categories, and is going to be a feasible crime set for almost all individuals, even with low abilities. On the other hand, everyone can be a victim because the levels of security depend only on the present of police force at the exact point and time. For example, the purse of a low income woman can be stolen in the public transpon system or on her way home; but at the same time, the wallet of a rich young man can be stolen in a pub or a university. Different kinds of prizes are related with different income levels and will be the target of different kind of thieves. Then, almost all income percentiles present a combination of victims and thieves that cannot be picked up with the data, which in turn will affect the results of the empirical exercise. For the latter reason, the income distribution cannot capture the effect proposed by the model. The lack of results in Property theft and Bank robbery can be the result of measurement error. The independent variable in all exercises is related with the household's income which is not a good proxy of the crime prize. The property theft includes the homes, offices, shops, restaurants, and all those places where an economical activity is developed. Despite the income of the household is correlated with the value of these kinds of possessions, a better variable could be the family's assets or the average price of property in each metropolitan area. On the other hand, bank robbery prize correlation with household income is even lower than the correlation between property values and family's income. A better approach to this kind of prize must be related with the financial sector activity such as deposits, loans, mortgages, or the number of branches per capita.. 5. Conclusions The principal purpose of this work was to develop a new and simple analytical approach for the theoretical framework of criminal behavior, focused in crimes against the property, and to apply this new approach to solve the problem with an empirical exercise using the Colombian data. The literature offers a wide range of possible theories to approach the problem of crime, following different purposes and consequentially finding different results. Starting with Becker (1968), the theories included general and pardal equilibrium models using special agent specifications and econometric methods to which can be divided in three categories. The first group associates the criminal behavior with security and police force variables, the second focus in the scaring effects, and the last one links the criminal market with the some variables of the economic theory. The model developed in this work belongs to the latter category. I found an open window for my research in the literature. The history of continuous hostilities between different groups deviates the attention of the empirical analysis to some manifestation of crime relative with war and violence, forgetting the violence problem in the cines and the crimes against the property.. 21.
(22) CRIME AND LABOR MARKET, CHOICE UNDER UNCERTAINTY MODEL AND AN APPLICATION FOR COLOMBIAN CITIES. The model uses the theory of the choice under uncertainty. Principally, this work differs from others given the fact that it proposes certainty equivalent as a break point in the decision choice function of each individual. The reviewed studies under the same theoretical framework use the expected value of the crime as a key point in the decision process. The main advantage of using the certainty equivalent instead the expected value of crime as a key point is the role that utility function and the risk aversion factors play internally in the decision of the agent. The result of the mentioned model was a crime supply function in terms of security and legal variables like the probability of success in the crime and the punishments, income variables like the offender and the offended earnings and unobservable factors like the risk aversion degree and the individual ability in criminal activities. The latter function was tested using the annual criminal and labor market reports of the 13 metropolitan areas in Colombia for a period between 1995 and 2003. The estimation technique proposed was an OLS estimation. It was complemented with three different computations of standard errors to control possible heteroskedasticity and within group error autocorrelation. The strategy used different combinations of individual income percentile distribution on different functional specifications to find out the best combination to represent the relationship between the offender and the offended. The results differ between crime types. First, the vehicle theft market was the one which fitted better with the proposed theoretical model. The estimations showed the 10th percentile of the individual income distribution affects negatively the crime ratio and the 25th percentile affects positively. Furthermore, the ratio between both has a direct relationship with the frequency of crimes. These results suggest that the following scenario is true: the offender belongs to the percentile tenth of the income distribution and the victim belongs to the percentile twenty fifth. This relationship shows how the certainty equivalent could be between the range aboye the 10th percentile and below the 25th percentile. Although, the prize of the victim's income is out of the feasible targets of the first quantile (percentile five), and high income households vehicles are over the abilities and technology of the criminal in the 10th percentile of income. Secondly, the street theft empirical exercises were not as consistent as the output of the vehicles exercise. After correcting the area error autocorrelation we did not find significant coefficients for the income variables used. The main cause of this output was the characteristics of the street crime market. As a competitive market, the facilities to access or abandon the market of this type of criminal activity create a mixture of offenders and victims in every income level and the data used in the empirical analysis cannot divide these two kinds of agents within the income percentiles. Finally, property and bank theft showed a limitation of the proposed empirical methodology. The household income was not a good proxy to the prize in this type of crime. However, this problem generates a challenge for future exercises using different kinds of wealth variables like household' s assets, property prizes, or financial market indicators to approach to the prize of this type of crimes.. 22.
(23) WELL-BEING AND SOCIAL POLICY VOL 6, NUM. 2, pp. 3-23. References. Becker, G.S. "Crime and punishment: An. Levitt, S. D. "Using electoral cycles in police hiring to estimate the effect of police on crime." The American Economic Review, vol.87, no.3 (1997): 270-290.. economic approach." The Journal of Political Economy, vo1.76, no.2 (1968): 169-217.. Bertrand, M., E. Duflo, and S. Mullainathan.. Levitt, S. D. "Understanding why crime fell in the. "How much should we trust differences-indifferences estimates?" The Quarterly Journal of Economics, vo1.119, no.1 (2004): 249-275.. 1990s: Four factors that explain the decline and six that do not." The Journal of Economic Perspectives, vol.18, no.I (2004): 163-190.. Burnett, K., R. Lagos, and R. Wright. "An on-. Machin, S. and O. Marie. "Crime and police resources: The street crime initiative." IZA Discussion Papers No.1853, Institute for the Study of Labor (IZA), 2005.. the-job search model of crime, inequality and unemployment." International Economic Review, vol.45, no.3 (2004): 681 — 706.. Di-Tella, R., S. Galiani, and E. Schargrodsky.. Machin, S. and C. Meghir. "Crime and economic. "Crime distribution & victim behavior during a crime wave." William Davidson Institute Working Papers Series No. wp849, William Davidson Institute at the University of Michigan, 2006.. incentives." The Journal of Human Resources, vol.39, no.4 (2004): 958-979.. Pepper, J. V. "Robust inferences from random. Di-Tella, R. and E. Schargrodsky. "Do police. clustered samples: An application using data from the panel study of income dynamics." Economic Letters, vol. 75, no. 3 (2002): 341-345.. reduce crime? Estimates using the allocation of police forces after a terrorist attack." The American Economic Review, vol.94, no.1 (2004): 115-133.. Rubio, M. "Criminalidad Urbana en Colombia". Documento de trabajo No 2. Documentos CEDE, 1997.. Doyle, J. M., E. Ahmed, and R. N. Horn. "The effects of labor markets and income inequality on crime: Evidence from panel data." Southern Economic Journal, vol.65, no.4 (1999): 717-738. Duggan, M. "More guns, more crime." The Journal of Political Economy, vol.109, no.5 (2001): 10861114.. Fella, G. and G. Gallipoli. "Education and crime over the life cycle." Working Paper No. 630, Queen Mary, University of London, 2008. Grogger, J. "Market wages and youth crime." Journal of Labor Economics, vol.16, no.4 (1998): 756-791.. Kelly, M. "Inequality and crime." The Review of Economics and Statistics, vol.82, no.4 (2000): 530539.. Levitt, S. and M. Rubio. "Understanding crime in Colombia and what can be done about it." In Institutional Reforms — The Case of Colombia, pp. 131- 172. Edited by Alberto Alesina. Massachusetts Institute of Technology, 2005.. 23.
(24)
Figure

Documento similar
The NaYF 4 host matrix is not only a material of choice for Ln 3+ ions doping because of the reliable and reproducible Figure 1. Energy levels diagram of Yb 3+ ions in NaYF 4
For our sample, we select heads of household between the ages of 18 and 60 years of age (inclusive) who participate in the labor market, and of whom we have information on wages.
In the previous sections we have shown how astronomical alignments and solar hierophanies – with a common interest in the solstices − were substantiated in the
For PbPb collisions, an additional sys- tematic uncertainty is assessed by taking the difference between applying and not applying the correction for different values of R AA
Finally, experiments with solar [17–34], atmospheric [35–45], reactor [46–50], and long-baseline accelerator [51–59] neutrinos indicate that neutrino flavor change through
The main goal of this thesis is to contribute to the knowledge in planetary science through the study of the upper atmosphere of giant planets undergoing hydrody- namic escape. We
Measures include the approximation of the labor force, an estimate of the physical capital stocks with aggregated and disaggregated investment data, and an index for the quality
The survey was applied to a representative sample of students of the bachelor‟s degree programmes in International Commerce and Advertising and Public Relations of
