Spin Lattice Coupling, Jahn Teler Efect and the Influence of the Measurement Rate in La0 7Ca0 3 xSrxMnO3 Manganites
12
0
0
Texto completo
(2) https://cimav.repositorioinstitucional.mx/jspui Introduction The strong spin-lattice coupling in manganites has evidenced a large influence in magnetocaloric properties and phase transition behavior arisen in them. This mixed valence manganites with general formula R1-xAxMnO3 (where R is a trivalent rareearth element: La, Pr, Nd, Sm etc. and A is a divalent or monovalent ion Sr, Ca, Ba, Na, K etc.) are promising materials for magnetic refrigeration applications near room temperature. They become ferromagnetic and metallic by doping with monovalent or divalent cations, making enough Mn3+ and Mn4+ ionic pairs (Mn3+/Mn4+≈7:3) which interact by double exchange.[1] The magnetocaloric properties observed in these manganites have high susceptibility to ionic radius, dopant valence and fabrication method; because the spin, lattice, charge and orbital degrees of freedom are related with the crystalline structure.[1, 2] The double exchange mechanism has been argued as responsible for the magnetic structure and electronic transport properties of these compounds. However a strong Jahn-Teller (JT) electron phonon coupling arising from the Mn3+O6 octahedron due to JT effect should play an important role.[3] The divalent cations distort the structure due to radius differences, leading to the Jahn-Teller effect. The deformation of the MnO6 octahedron originates from two causes: the Jahn-Teller effect with double degeneracy of eg orbitals and from the connection pattern of the MnO6 octahedron in the perovskite structure (tilting of the octahedra), which forms rhombohedral or orthorhombic lattices.4 Spin-lattice coupling is reflected in several macroscopic properties, such as in strong lattice contraction upon cooling through Curie temperature (TC), large or anomalous magnetostriction of some manganites, associated structural and magnetic phase transitions and strong dependence of TC on epitaxial. 2.
(3) https://cimav.repositorioinstitucional.mx/jspui strain films.[5] Next, this work explains the influence of magnetization and the heat flux variables measured at different temperature rates in order to adjust Curie temperature with doping and to investigate the spin-lattice coupling behavior in manganites. Experimental The compositions from La0.7Ca0.3-xSrxMnO3 system were fabricated using a solid state reaction method at high temperature. Precursor powders of La2O3, Mn2O3, CaCO3 and SrCO3 were mixed in stoichiometric proportions according to x= 0.06, 0.07, 0.08 and 0.15. Using a pulverisette 7 low energy planetary mill, the samples were ground initially for 4 h and then milled also for 4 h between heat treatments. The samples were presintered at 750 °C for 15 h and at 950 °C for 18 h in air atmosphere. Finally, the sample powders were pressed into a die of 1 cm of diameter and subsequently sintered at 1300 °C for 24 h. X ray powder diffraction patterns were measured at room temperature in a Panalytical diffractometer model X’pert Pro-MPD with Cu Kα radiation (λ=1.5406 Å). The calorimetric measurements were performed in a TA instruments model DSC Q200 calorimeter. The measurement of thermomagnetic curves were carried out in a Quantum Design Physical Properties Measurement System (PPMS). Raman measurements were made in a Raman Horiba model LabRam HR VIS 633 with He-Pe laser of 632 nm. Results and discussion Crystalline phases were identified by X-ray diffraction for x=0.15, 0.08, 0.07 and 0.06 samples in La0.7Ca0.3-xSrxMnO3 system as shown in figure 1. According to crystallographic file PDF 01-071-5287 a single phase for Sr=0.15 sample with a rhombohedral structure and a R-3c space group was identified. Moreover, for Sr= 0.08,. 3.
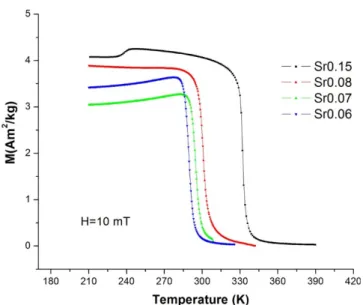
(4) https://cimav.repositorioinstitucional.mx/jspui 0.07 and 0.06 samples a single phase with orthorhombic structure and Pnma space group were identified according to crystallographic file PDF 01-071-5292 for these samples.. FIG. 1. X ray diffraction patterns for Sr= 0.15, 0.08, 0.07, 0.06 powders samples in La0.7Ca0.3-xSrxMnO3 system.. FIG. 2. M vs T curves for Sr= 0.15, 0.08, 0.07 and 0.06 samples, measured at 15 K/min under a constant magnetic field of 10 mT.. 4.
(5) https://cimav.repositorioinstitucional.mx/jspui Thermomagnetic curves (M vs T) were measured at 15 K/min, under a constant magnetic field of 10 mT, for x= 0.15, 0.08, 0.07 and 0.06 samples in order to observe the magnetic transition temperature (see Fig. 2). The entire samples pass thought a second order [6] ferromagnetic to paramagnetic phase transition, and a displacement of the Curie temperature with doping was noticed. The Curie temperatures for Sr= 0.15, 0.08, 0.07 and 0.06 samples are 332, 300, 295 and 290 K respectively. The Curie temperature was adjusted very close to room temperature as each 0.01 of Sr increase in stoichiometric formula generates a Curie temperature raise of around 5 K. The small shoulder located at 238 K in Sr= 0.15 thermomagnetic curve corresponds to an orthorhombic to rhombohedral phase transition. [7] In order to identify ferromagnetic to paramagnetic phase transition behavior when a measurement temperature rate is applied; M vs T curves were obtained for orthorhombic Sr0.07 sample at measurement rates of 0.5, 1, 2, 3, 5 and 7 K/min as shown in figure 3. The Curie temperature changes as follows: 286.80, 287.28, 288.44, 289.36, 291.48, and 293.43 K, as the measurement rate increases for 0.5, 1, 2, 3, 5 and 7 K/min respectively. In the low temperature region (196 – 257 K) another transition is observed. This transition shows a sensitive response to 0.5, 1, 2, 3, 5 and 7 K/min measurement rates, because occurs without sequence when temperature rate is increased at 234, 257, 196, 233, 245 and 238 K respectively. Therefore, the influence of the temperature rate as well as the applied magnetic field is detected in this system with strong spin-lattice coupling.. 5.
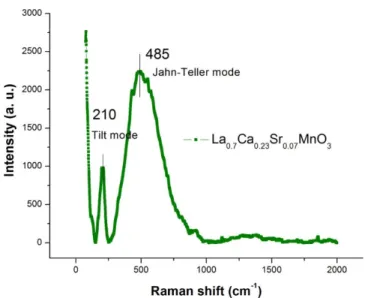
(6) https://cimav.repositorioinstitucional.mx/jspui. FIG. 3. M vs T curves for La0.7Ca0.23Sr0.07MnO3 sample measured at 10 mT for 0.5, 1, 2, 3, 5 and 7 K/min measurement rates.. Given the distorted nature of orthorhombic structure and thinking about vibrational behavior according to different responses of measurement temperature rates in figure 3, a Raman spectrum was acquired. Figure 4 shows a Raman spectrum measured for the La0.7Ca0.3-xSrxMnO3 manganite inside a spectral range of 0 to 2000 cm−1. This spectrum shows two main vibrational modes, one observed at 210 cm−1 ascribed to a tilt mode of MnO6 octaedra [8] and other observed at 480 cm−1 that corresponds to a Jahn-Teller mode. [9] This Jahn-Teller mode occurs because the MnO6 octahedron environment requires an energy balance. The higher energy eg electron in Mn3+ ion decreases electrostatic (repulsive) energy by an increase in the elastic energy, which implies the eg orbital splitting and therefore a MnO6 octahedron distortion. [9]. 6.
(7) https://cimav.repositorioinstitucional.mx/jspui. FIG. 4. Raman spectrum for La0.7Ca0.23Sr0.07MnO3 sample.. These vibrational modes identified by Raman spectroscopy justify the presence of the JT transition without measurement rate sequence, observed at low temperatures (196 – 257 K) in M vs T curves for Sr0.07 sample. The temperature rates and the applied magnetic field stimulate the vibrational modes of the orthorhombic lattice in Sr0.07 sample because when carriers have certain mobility, the distribution of Mn3+ and Mn4+ ions is random and changes with time. [4] Aiming to explain this temperature transition behavior at low temperatures (196 – 257 K) in M vs T curves and due the high spin-lattice coupling in these compounds a differential scanning calorimetry (DSC) was measured to avoid the magnetic field influence. The DSC obtained for Sr0.07 sample was measured at 2, 3, 5 and 7 K/min in cooling and heating regimes inside a temperature range of 300 to 203 K for cooling and from 203 to 320 K for heating (see Fig. 5). In DSC graph two transitions were observed for each measurement rate used, both in cooling and heating regimes. Analyzing the. 7.
(8) https://cimav.repositorioinstitucional.mx/jspui heating rate regime, the endothermic peak observed around 284 K is related with the ferromagnetic-metal (FMM) to paramagnetic-insulating (PMI) transition, occurred at metal-insulator transition temperature (TMI ∼ TC). For every doping level in La0.7Ca0.3xSr xMnO3. system two mainly states appear, FMM and PMI according to phase diagram.. [10] The double exchange interaction in this compounds is related to electron hopping between Mn3+ and Mn4+ ions through Oxygen atom which generates a ferromagneticmetal state from a paramagnetic-insulated one. The conduction band is narrow above TC in the paramagnetic- insulating state leading to electron localization.11 In this paramagnetic-insulating state charge trans- port is thermally activated for hopping around TMI transition temperature, which means that eg electrons of Mn3+ ions are mainly localized before the transition and they should overcome and energy barrier to hop to Mn4+ ions through the oxygen atom. [5, 12] The latter explain the transition around TC in figure 5.. FIG. 5. Differential scanning calorimetry for La0.7Ca0.23Sr0.07MnO3 sample in cooling and heating regimes at 2, 3, 5 and 7 K/min measurement rates.. 8.
(9) https://cimav.repositorioinstitucional.mx/jspui The endothermic peak occurred at 225 K and the heat flux below this temperature, shown in figure 5, appears for all measurement rates in heating and cooling regimes. These are attributed to the JT and tilt modes identified by Raman. The oscillating flux is attributed to the phase transition from a JT static cooperative state above 225 K to a dynamic JT state below [13] 225 K. In static cooperative JT phase the distortions are correlated; identically distorted molecules establish a particular orbital array that allows eg electrons to move through these orbitals preserving the initial phase distortion. [14, 15] Whereas in dynamic JT phase the distortions are not correlated, establishing a random phase where the molecules perform random motions and the electrons move according to their changing orbital surroundings. [14] The endothermic peak shown at 225 K for all measurement temperature rates in figure 5, and the transitions observed between 196 and 257 K in figure 3 belong to the same second order [16] JT transition. The behavior change between these two measurements could be related with the fact that magnetic field enhances metallic behavior due to double exchange interaction. [17] When temperature rates change in this enhanced FMM state, the amount of energy applied with each temperature rate activates different vibrational modes of the orthorhombic structure due to random orientation of Mn3+ and Mn4+ ions, triggering the JT transition between 196 and 257 K. The static JT cooperative distortion is possible in the orthorhombic crystal structure (x=0.07) however the higher symmetry of MnO6 octahedron in the romboedral phase (x=0.15) with a single Mn-O bond length does not allow it. The JT distortion modes are tetragonal or orthorhombic but the romboedral symmetry does not split the eg orbital. [6]. 9.
(10) https://cimav.repositorioinstitucional.mx/jspui Conclusions As presented here, the Curie temperature could be adjusted to room temperature in La0.7Ca0.3-xSrxMnO3 using a fine Sr doping and the methodology proposed. The presence of Jahn-Teller vibration modes and MnO6 octahedron tilt were identified by Raman spectroscopy in Sr0.07 sample. These modes appear at 480 and 210 cm−1 respectively and are observed in DSC and M vs T graphs as a Jahn-Teller transition. The appearance of JT transition for temperatures between 196 and 257 K in M vs T curves is due the strong spin-lattice coupling of this system and to the occurrence of the static to dynamic Jahn-Teller transition. The static to dynamic JT transition is revealed in DSC graph with an endothermic peak at 225 K which appears independently of temperature measurement rate. Also, the dynamic JT phase is evidenced with thermal fluctuations occurred for temperatures below 225 K. The factors shown here must be considered for the experimental measurements and potential practical use either for manganites or any other family of materials intended to be studied as a magnetocaloric material. References 1. R. Venkatesh, L. Theil Kuhn, N. Pryds, C.R.H. Bahl, and J. Bohr, Chemistry and Physics 132, 192 (2011). 2. Z. Chen, T.A. Tyson, K. H. Ahn, Z. Zhong, and J. Hu, Journal of magnetism and magnetic materials 322, 3049 (2010). 3. M.W. Shaikh, I. Mansuri, M.A. Dar, and Dinesh Varshney, Materials Science in semiconductor processing 35, 10 (2015).. 10.
(11) https://cimav.repositorioinstitucional.mx/jspui 4. P. K. Siwach, H. K. Singh, and O. N. Srivastava, J. Phys.: Condens. Matter 20, 273201 (43 pp) (2008). 5. Kathrin Dörr, J. Phys. D: Appl. Phys. 39, R125 (2006). 6. J. Mira, J. Rivas, L. E. Hueso, F. Rivadulla, and M. A. López Quintela, Physical review B 65, 024418 (2001). 7. A.N. Ulyanov, J.S. Kim, Y.M. Kang, and D.G. Yoo, J. of applied physics 104, 11391617 (2008). 8. A. Espinosa, M. Otero-Leal, F. Rivadulla, J Rivas, and A de Andrés, Journal of Luminescence 128, 992 (2008). 9. L. Martin-Carrón and A. de Andrés, Journal of alloys and compounds 323-324, 417 (2001). 10. G. Alejandro, M. Otero-Leal, M. Granada, D. Laura-Ccahuana, M. Tovar, E. Winkler, and M. T. Causa, J. Phys.: Condens. Matter 22, 256002 (7pp) (2010). 11. G. C. Rout, Nilima Parhi, and S. N. Behera, Physica B 404, 2315 (2009). 12. J. L. Cohn, Journal of superconductivity: Incorporating Novel Magnetism 13, 2 (2000). 13. M. Pissas, I. Margiolaki, G. Papavassiliou, D. Stamopoulos, and D. Argyriou, Phys Rev B 72, 064425 (2005). 14. Koppel, Horst, Yarkony, R. David, Barentzen, and Heinz, Springer Series in Chemical Physics (2009), ISBN: 978-3-642- 03432-9. 15. Lorenzo Malavasi, Maria Cristina Mozzati, Paolo Ghigna, Carlo B. Azzoni, and Giorgio Flor, J. Phys. Chem. B 107, 2500 (2003).. 11.
(12) https://cimav.repositorioinstitucional.mx/jspui 16. Ralph G. Pearson, Proc. Nat. Acad. Sci. USA 72(6), 2104 (1975). 17. G. C. Rout, Saswati Panda, and S N Behera, J. Phys.: Condens. Matter 23, 396001 (12pp) (2011).. 12.
(13)
Figure


Documento similar