Present and Potential Land use Mapping in Mexico
17
0
0
Texto completo
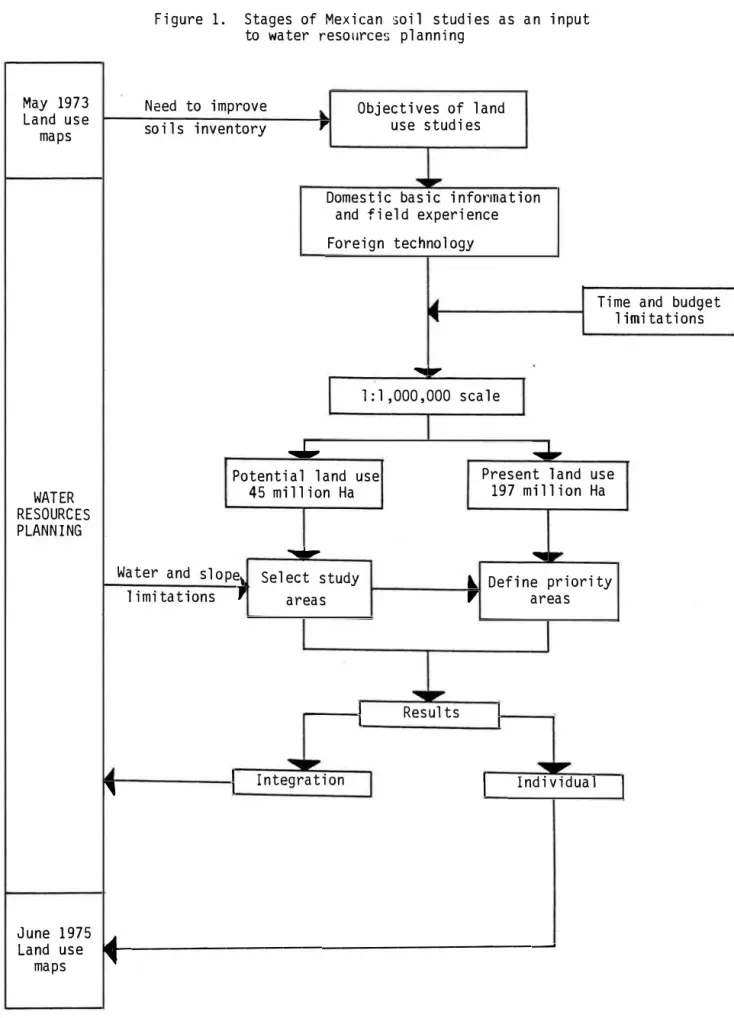
(2) METHODS Figure 1 shows the Mexican soil studies stages using LANDSAT Satellite imagery. The MHP de fined a work program for a 33 month period project, which included soil invéntories as one ot" the main inputs. Water requirements for irrigated agricutture accounts for more thar, 95% of the country's total water consumption. Therefore. so11 inventories are as import as water inventaries for successful water resources p1anning. Only the FAO soils map was available for the whole country. as we11 as many loca1 soil stud ies covering srnall areas, when the MWP project was started. Very good p resent and pótential 1:50,000 scale land use maps are being deve1oped in Mexico by CETENAL (Com1sí6n de tstudios del Territorio Nacional). Unfortunate1y. the FAO soi1s map is too general, and not suíta ble for water resources planning. On the other hand, CETENAL maps are exce11�nt but cover less than a third of the country at present time.. The MWP staff defined the object1ves for the present and potent1al 1and stud1�s and sk�tched preliminary procedures. Afterwards. two seminars were conducted 1n Mex1co City 1n arder to define the final procedures to study present and potentia1 1and usé us1ng LANOSAT•l 1my agery..!./ A well experienced U.S. So11 Conservation Service scientist and two leading U.s. experts in LANDSAT imagery were selected to partic1 a p te fo the seminars.. The whole country was surveyed with present 1and use studies and maps sca1e 1:1 míll1on were prepared, while only 45 mi111on Ha were covered w1th potent1al 1and use stud1es. The areas to study potential use were se1ected from regions �,ith less than 10% s1ope wher� water is still available for agricu1ture developrnent.. A short training course on image interpretation for present 1and use purposes was then given by one of the remate sensing experts, and a Mexican consulting firm conducted the study. In a two-year period the whole country was mapped ata 1:1,000,000 scale w1th a cost of 200 thousand U. S. dollars, i.e. 0.1 cents/hectare. The areas where potentia1 1and use stud ies would later be carried on were given first pr1or1ty.. The potential land use study was started 6 months later since presént 1and use information was needed as an input. Thé other LANDSAT expert and the soí1 sciantist 1ed two píiót studies while adjusting the proposed methodology, aiong w1th éxperienced soi1 scientist of anúther Mexican consulting firm. They made six one-week triPS to Mexíco durínq the fo11owing year to carry on the study. With each trip. they functionéd more as a rev1éw team, whilé th� leadership and responsib111ty of the study was turned over to the Mexican soil scíenthts. More than a fifth of the country was studied in ayear wíth a cost of roughly 150 thousand dollars; i.e. 0.33 cents/hectare. Also 1:1,000,000 rnaps were f1na11y produced,. The results of both present and potentíal land use studies have improved the Mexican soil re sources inventories as a by-product of the water resóurces planning 1tse1f. The integration · of results contributed significantly to 1rnprove the regional water resourcés pianníng pro• cess; A summary of results of both studies, as well as the1r integratíon ís presented, Finally, to accomplish the cornn1tment with the United Nat1ons, an out1íne of ti step-byastep hahdbook to make land use studies usíng LANDSAT irnagery, present1y under prsparatión, ís submitted for discussion. Suggestions from the Symposium will help MWP in making a useful contribu tion to the field of remote sensihg technology.. 1/ Garduño, H., García Lagos, R., García Simo, F. y Pérez Gavilán, D., UTILIZ�CION DE LAS IM� - GENES DEL SATELITE ERTS-1 EN LA PLANEACION DE LOS RECURSOS HIDRAULICOS, Primer Congreso Panamericano y Tercero Nacipnal de Fotogrametrfa, Fotointerpretaci6n y Geodesia, México, 1974. 1824.
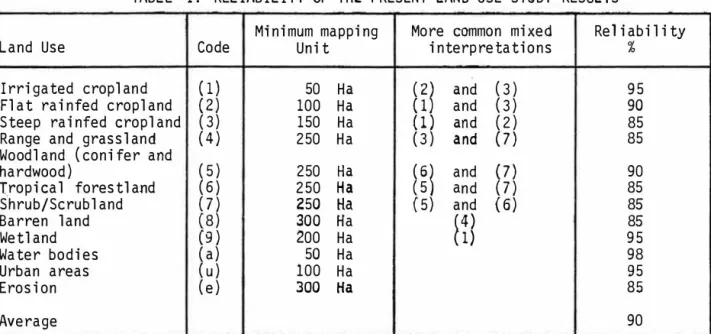
(3) PRESENT LAND USE STUDY The objectives of this study were; 1) To survey present land use in the whole country. Specia1 emphasis was placed on irri gated agricultural land and on rainfed areas. 2) To provide basic information to de.termine potentia1 land use and to compare later the results of present and potentia1 land use studfes. False infrared color transparencies using channels 4, 5, and 7 fr�m LANDSAT were used. The U.S. Geological Survey First Classification leve1 recommendations_l were followed with slight modifications to interpret the 200 images that cover the country. Since agricultural land was the main interest of study, images taken during the dry and rainy seasons were used. This made it possible to discriminate irrigated from rainfed agriculture. The project included intensive low altitude flights and ground-truth trips, as well as compar ison with detailed l :50,000 CETENAL maps. Table I shows the reliability far each present land use mapped. In southeastern tropical Mexico Skylab IR color photographs were used where cloud-free LANDSAT images were not available. Since only visual interpretations techniques were used, those areas densely covered by vegetation were especially difficult to interpret. Future efforts will also utilize methods which take advantage of spectral computer•aided scanning. TABLE. I.. RELIABILITY OF THE PRESENT LAND USE STUDY RESULTS. Land Use. Code. Irrigated cropland Flat rainfed cropland Steep rainfed cropland Range and grassland Woodland (conifer and hardwood) Tropical forestland Shrub/Scrubland Barren land Wetland Water bodies Urban areas Erosion. (1) (2). (3) (4). (5) (6) (7) (8) (9) (a) (u) (e). Mínimum mapping Unit 50 100 150 250. Ha Ha Ha Ha. and (3) and (3) (1) and (2) (3) and (7). (2 (1 �. 250 Ha 250 Ha 250. 300 200 50 100. 300. More common mixed interpretations. (6 (5 � (5). Ha. Ha Ha Ha Ha Ha. and (7) and (7) and ( 6) 1) f 4). Rel iability %. 95 90 85 85 90 85 85 85 95 98 95 85 90. Average Note l. The two uses more intensively field checked were irrigated and rainfed land. Note 2. Water bodies and urban areas were easily identified.. :_! U.S. Geological Survey, A LAND CLASSIFICATION SYSTEM FOR USE WITH REMOTE-SENSOR DATA, Geological Survey Circular 671, Washington, D. C. 1973. 1825.
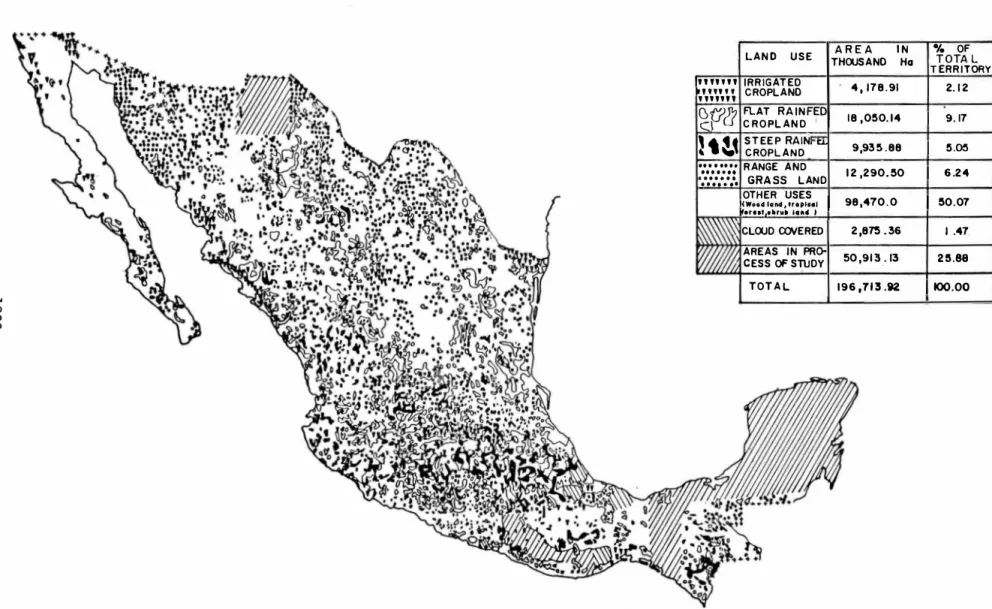
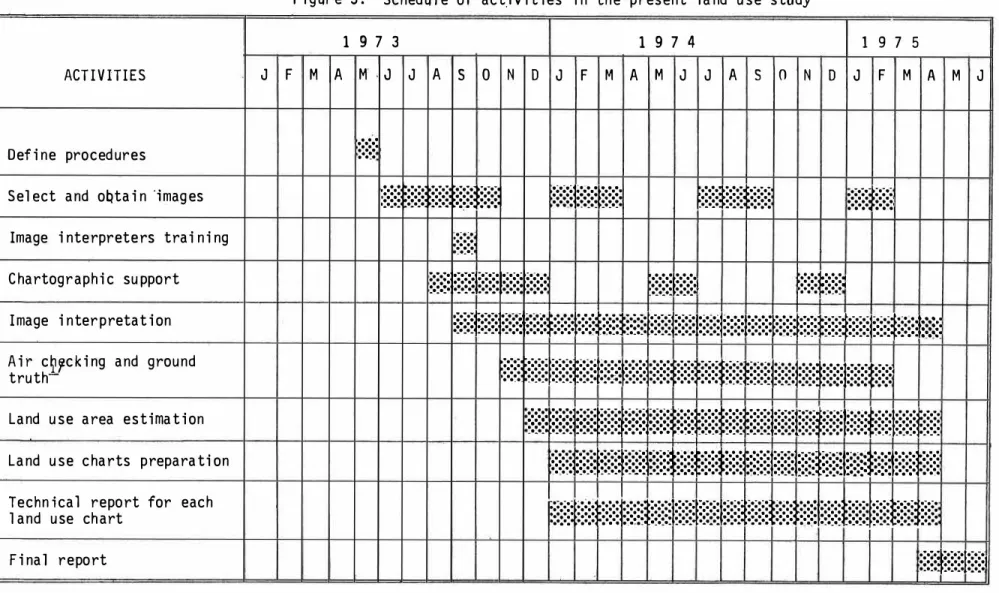
(4) Results The final results are now being printed in 17 land-use 1:1 ,000,000 charts (Fig. 2). Each map includes a detailed description for each use, which takes into account regional differ ences found within the country. A grid formed by squares of one half degree latitude and one half degree longitude was superimposed onto the maps and supporting area statistics were calculated for each land use type on the basis of state, MWP regions and individual charts. The hectares covered by each used with advanced erosion was also computed. Fig. 2-A shows a generalization of results for the whole country. Comparison with tions; however, of 30.0 million lion Ha of land. censal figures is usually meaningless due to differences in land use defini it is interesting to point out that while censal data indicated that an area Ha is completely eroded, the present land use study detected only 6.3 mil with advanced erosion. Duration, Manpower, and Cost. Figure 3 shows the schedule of activities for the present land use study. Once the proce dure was defined and the interpreters trained a set of straiqht forward: steps were followed for each one of the 17 land use charts. However, a major change was made in the original methodology, when ground truth proved to need a far greater effort than was at first anticipated. Table II shows the manpower used in the study and Table III shows an estimate of costs for the whole study which covered 197 million hectares. The reported total cost of U.S. $200,000.00 doesn't cover air checking nor foreign personnel expenses. TABLE II.. MANPOWER REQUIRED FOR PRESENT LAND USE STUDY. Mexican personnel. Man months. Project manager MWP project coordinator Image interpreters Chartographic support assistants Assistants land use area estimation Draftsmen. 26 3 112. 29. 90 64 329. Foreign personnel Remote sensing expert. 1. TABLE III. COST OF PRESENT LAND USE STUDY 8% 35% 7% 15% 22% 13% 100%. Image and photographic material· Image interpretation Chartographic support Ground truth Land use area estimation Drawing and reports 1826.
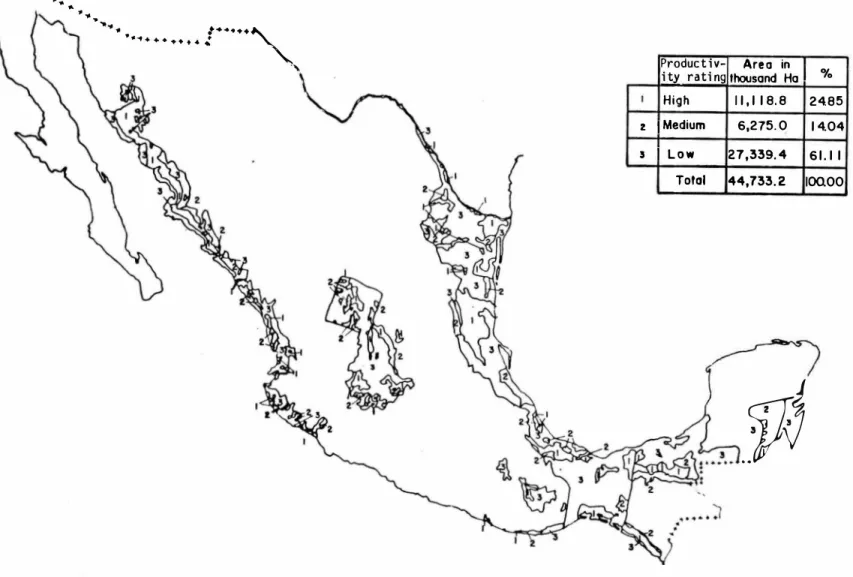
(5) POTENTIAL LAND USE STUDY Description The objective of the study was to assess, at an identification and not a proiect level, areas with high, medium or low agriculture and pasture productivity and water erosion risk. Since the project also aimed at the development of methodology to be used, two pilot studies covering 6 million Ha were first carried out in·a semi-arid and in a humid tropical area. The area covered was of a reasonable size and the ecological conditions different enough as to assure that the methodology could be successfully applied in any other region of the coun try. Interpretation of infrared false color and channel 5 images was made using transparencies and prints, both at 1:1,000,000 and 1,500,000 scales, although final results were produced at 1:1,000,000 scale. Overlays with general delineations of present land use maps, geology, rainfall, FAO soil units and infrastructure were used to help imag� interpretation. Also more reconnaissance flights and ground truth trips with more intensive sampling were re quired than by the present land use study. The soil units classification was taken from the 1:2,000,000 scale FAO map, but a far more detailed soil units map was produced after interpreting the images with the aid of the ove!:_, lays mentioned above as well a� the air and ground truth. The potential land us71ctassifi cation mas made according tho Handbook 210 of the U.S.Soil Conservation Service.Finally, interpretative maps were produced for agriculture and pasture use, slope classifi cation, and water erosion risk. A reliability of 80% to 90% was determined by comparing results of the study with available more detailed results of conventional soil surveys. Results Figure 4 shows the soil unit delineations obtained following the FAO soil classification sys tem. Image interpretation was determinant in defining more precisely the soil unit bounda r�es and produced more details than the original FAO map showed. Potential land use maps were prepared based on the properties of the FAO soil units,_yield and production statistics, results from agriculture and livestock experimental stations, field observations, and personal experience of the soil scientists that carried out the study. Estimates of yields were made for the most important crops as well as evaluations of carrying capacity under grass for cattle feeding in each soil unit. Figure 5 shows the general re sults for agriculture productivity. Only 17 million Ha were found to have high and moderate agricultural potential productivity. This figure seems low, taking into account that thé study was carried out in selected areas according to slope. However, large areas in the south east were classified under present conditions as of low productivity due to seasonal flooding. It is believed that with adequate flood protection and drainage measures, they could easily be considered as areas of high productivity since the soils are deep, flat, and fertile. The potential range and grass productivity was determined only in 29.7 million Ha since es timates of carrying capacity per hectare were not available in the north western and central regions of the country. Figure 6 shows the general results. A large proportion of the area }j Klingebiel, A.A., and Montgomery, P.H. LAND CAPABILITY CLASSIFICATION. Agriculture Hand book No. 210, Soil Conservation Service, U.S. Department of Agriculture, 1973. 1827.
(6) was found to have from medium to high productivity (23 million r:a). Most of the land is lo cated in the Gulf coastal plains and on the south eastern regions where most of the country's present livestock production is concentrated. Finally, Figure 7 shows areas with different degree of water erosion risk. Even though the studied areas lie mostly on flat lands, 69% of the 45 million Ha shows medium to high water erosion risk. This fact points out the need for sound soil conservation programs and poli cies. Duration, Manoower, and Cost Figure 8 shows a schedule of activities for the potential land use study. A line-production procedure was not feasible and separate package studies were carried out in each selected area. The reason for this is that integration of image interpretation, basic data, field notes and personal experience should be borne to a great extent in the mind of the soil sci entist in order to finish up a specific area. Hence, one area had to be finished by each team before starting studies on the next one. Two teams were responsible for the whole proj ect. Table IV shows the manpower used in the study and Table V shows an estimate of costs for the whole study which covered 45 million hectares. The reported total cost of U.S. $150,000.00 doesn't cover air checking nor foreign personnel expenses. TABLE I V. MANPOWER REQUIRED FOR THE POTENTIAL LAND USE STUDY Mexican personnel 2 2 2 2. Man months. Team leaders Soil scientists Image interpreters Draftsmen MWP. 22 22 22 20 2 88. Foreign personnel 2 2 4. Soil scientist Remote sensing expert TABLE V. COST OF POTENTIAL LAND USE STUDY Overlay material and image prints Office work: preliminary delineation, source material analysis and final integration to obtain soil unit maps and interpretative maps Field reconnaissance trips Drawing and reports. 2% 56% 26% 16% 100%. 1828.
(7) THE ROLE OF LAND USE STUDIES rn WATER RESOURCES PLANNING The comparison of potential and present land use maps shows that 82% of total land now being farmed and.rated as hiqh aqri�ultural productivity is being used at present time with irrigat ted and ra,nfed flat land agr,culture. However, there are 535 thousand Ha of low productivi ty areas presently being irrigated and 3.6 million Ha with rair.fed agriculture of the same productivity class. On the other hand, 3.9 million Ha with high potential agricultural pro ductivity remain unfarmed. It is also important to point out that 41% of 16.6 million Ha presently being used within the area studied, are in high danger of being eroded. Most of these areas have rainf�d agri culture, since most irrigated land lies in areas with low risk of erosion. This was expect ed, as well as the fact that 15.6 million Ha with medium to high risk of water erosion are not being farmed. There are large areas in the Gulf coastal plains with low potential agricultural productivity and medium to high risk of water erosion. These areas should be mainly devoted to pasture land, taking care not to over-graze them. Detailed studies using these results are presently carried on at. MWP in order to define fu ture regional water resources development related to agriculture, livestock, and soil con servation. OUTLINE OF A STEP-BY-STEP SOILS HA�DBOOK USING LANDSAT SATELLITE IMAGERY The MWP soils group is preparing a handbook covering the points outlined below. Comments and suggestions from the Symposium part,cipants are welcome. It is important to point out that for the sake of clarity it is intended that each step will be illustrated in detail with figures and in a general way, the results for the whole country will also be discussed. l.. Introduction. 2.. Present land use Objectives Classifi�ation criteria Satellite image selection Air reconnaissance and ground truth trip Interpretation adjustments Land use area estimation Reliability criteria Cost estimates Report writing and graphical presentation. 3. . Potential land use Objectives Work teams Image transparencies and prints Basic source overlays Classification criteria for soil units and for land capability Preliminary soil units delineation in the office 1829.
(8) Air reconnaissance and ground truth trips Adjustments, final delineations, and interpretative maps Reliability criteria Cost estimates Report writing and graphical presentation 4. Examples of interpretative maps worked out 5. Integration of present and potential land use studies CONCLUSIONS The use of LANDSAT imagery has made it possible to make land use inventory maps scale 1:1 ,000, 000 in Mexico with an extremely low cost in a two-year period. The Agriculture Ministry is a1 ready carrying out a new inventory scale 1 :500,000. The objectives of the present land use study were met, with an overall reliability of 90%. However, only a small fraction of the information contained in the images was used.. The next steps in using LANDSAT in Mexico will include study of dynamic changes in land use, computer aided spectra1 scanning, more detailed studies of areas of interest at wider scales (1 :250,000), etc. The potential land use maps were developed faster and at a lower cost than would have been possible using any of the conventional methods. A reliability of 90% was also accomplished in these studies. The integration of both present and potentia1 land use maps is extremely usefu1 in providing orientations for regional development of water resources in agricu1 tura1 countries with sparse water supp1 ies; it also helps to set forth policies about land redistribution accord ing to capability and water erosion risks. ACKNOWLEDGEMENTS Messrs. Gerardo Cruickshank, Undersecretary of Planning at the Water Resources Ministry and Fernando González Villarreal, General Coordinator of the Mexican Water Plan supported and oriented the land use studies. Dr. Donald Lauer in charge of training programs at the EROS Data Center of the U.S. Geolog ical Survey, helped in defining the present land use study methodo1 ogy, trained the image interpreters and recently made an appraisal of the final results. Dr. Albert Klingebiel, one of the more experienced U.S. soil conservation scientists, recent ly retired from the Soil Conservation Service and Dr. Victor �1yers, Director of the Remote Sensing Institute at the University of South Dakota, helped in defining the potential land use study methodo1 ogy and trained Mexican soi1 scientists on the field. They were also re sponsible for assistance during·the air and field reconnaissance and the reviewing of �anu scripts. Roberto Vital from MWP was in charge of preparing source material, map generalizations and integration of present and potential land use.. The EROS Data Center provided excellent service in processing and sending the images that. were required for the study.. 1830.
(9) Figure l.. May 1973 Land use maps. Stages of Mexican soil studies as an input to water resources planning. Need to improve so ils inventory. ,. Objectives of land use studies. Domestic basic infonnation and field experience Foreign technology. Time ahd budget limitations. ....... 1:1 ,000,000 scale. -L... �. Present Tand use 197 million Ha. Potential land use 45 million Ha. WATER RESOURCES PLANNING. ,. -. �. 1. 1. ,. 1. 1. ... priority ,. Defineareas. Water and sl_ ope, Select study 1 imitations areas. �. 1. Results. 1. 1. Integration. Individual. June 1 975 Land use 11�1------------------------maps ....1111. 1831. 1.
(10) 11 1 :t/JfslJ t -r-lr'-111•. 1r1•. ... •. 111•. 114•. +. •• .,. .,.. 111•. /. 11.-. 111•. l!'.s ,�. _f()I•. toe• 104• IOI•. tc:11•. 101!__�. N•. N•. .,. __..•. N•. @ci>.�. .... ""L. -. i:��. 9. n. �, I. � 1. '. 1\1 T\ /\\ / r �lf\ � L)-,\. \1. �/l. �. .... 1 ..,. ,,.. .. ... IO'. , ,. �. �f'). )'. ¿·;hj �,,. J'-" 1 1 l f..::'l_':--- ., L/ 1 ,, � V IC'tORIA,,;f'..:. ... ª" •••. •••. u•. ... ... .... -. IO'. REGIONS. ••. .... 11?". 111•. ---. \,,.. , GRI�.Jr��l?_:b.1 �-l��I/ F t,t·Jg1�·JPw�;h1·M. -l1••. .... n•. 17;�·.. �,.. .. ----· ],.. . -� fr�1LPA�"GO ,lf+df11it�ti -thH?L U1 ,4 lL. !�;)\§j�l!'.C tJ\�1:��J- \ V. AT. A. :tJ® r �] _. .;,. •••. AR E' A t<_,ñZ I BAJA C ALIFOR N IA 1 43 789 II NOROEST E 1 316 5 86 m PACIFI CO CEN TRAL I 1 16 9 31 IV BALSAS 151809 1 1 1 Y ISTMO SUR 88032 1/I BRAVO I 329927 'W: PAN U CO 158 1 1 1 :y]ll PAPALOAPAN 56 5 50 lX GRlJALVA USUMACINTA 8H85 X PENINSULA DE YUCATAN 139626 XI CUENCAS CERRADAS DEL NORTE 269 400 89 332 001 LERM A 22 470 :xm VALLE DE MEXICO TOTAL 1967948. MWP. URl!'.00. YI. Hío)�b.. -1{8)DU�ANGC! _I I. ,..r,L 1 1 1 / 1 / 1 1 1 1 1 e. .... �. Fig.2:-Distribution of charts for the pres ent land use study. ,, �('� /�� 1. .o. rr•. •••. HIORAULICO. f"--.1 \J \1 tn.�1 ·Vt1 (.) f\vf( l'--�.. I I//1 )}.;. �1 1 1 1. .t_2•. NACIONAL. @aJ•�"l_ i(!'l0N�. "\. "'. •1•. w 1 \.1 1 I\ 1 U 1 , 1� 1 1 � \:f::+/1· � ) 1 f, P \ J, 1. 1 l _). Kvl�PAZ\. M•. �PLAN. ,] 'f=R:.r··--�--.L-L _._ �.f -+--f� -.¡ """ \ 1 '-i,1 f\. ... ·�"!R""i"" �. .,. 1. 110• _ -�- to1• _10�. _1_. L_�1. �. ---' 1. -· ). .... ----ti•. /. •. ... ·�---i----J-----J----J____J_____l���j____l___���������·. ··ci==i==±�=b==,�-J�-l,.,,.._,1,,.....,,L-J=-=--J=-l-:--l........,.L=-Jb-J:::-tO.. -l=-=--=L-J=-=--l=--1���-�b=d:;;;:=d:;::=±;:=t;:=t=j==l:J 111•. 111•. 11... 111•. 111•. 111•. 110•. toe4'. tc11•. .01"". lc,til. IOI•. 104'. IOI•. 10... 100'. fft. ,... l'P'. N•. •••. t••. 11•. ti•. t1•. ,ot. 11•. 11•. 1?•. 11•.
(11) LAND. ""'" IRRIGATED '""" '""" CROPLANO. �P2r !tt1 ........ ....... ._,. ..... 1 ••••••. -·. TOTAL. TERRITORY. . 4,178.91. 2.12. FLAT RAINFED I CROPLAND. 18 ,0!50.14. 1. 9.17. S TEEP RAIN. u. CROPLANO RANGE ANO GRASS LAND OTHER USES. 9,93!5 .88. 1. !5.05. 12 ,290.!50. 1. 6 .24. 98,470.0. 1 !50. 07. l{Wood lan4, troplHI. f.rut1,llru• ltAII ). CLOUD COVEREO AREAS IN PROCESS OF STUDY TOTAL. _, co w w. •1. OF. IN AREA THOUSANO Ha. USE. 1. 2,87!5 .36. 1 .47.. 50,9111,. 13. 2!5.88. 196,713.92. 1 too.oo. '. ,:¡. Figure 2-A Present land use study in Mexico. -1.
(12) � '. Fi gur e 3 . Schedul e of actJvi t i es i n the present l a nd use study 1 9 7 3. ACT I V ITIES Def i ne procedures Select and obta i n ·;mag es Image i nterpreters trai ni ng Chartographi c support Image i nter pretat i on A i r c� , c k i ng and ground truthLand use area estima t i on Land use charts prepara ti on Techn i cal report for each land use chart F i na 1 report. li. J. F M I A M .¡ J J A. :,•::·•=:�•=:·. 1 9 7 5. 1 9 7 4. s o. N. :;:;:;{:;:;l:;:t�=�l:�:�:. �-�-�. ,:::::. D J. F M A M J J A. =�=�=�t;:;fü;:;:. s o. N. D J. ,•:•:·�=·:•:)•:•:•: �:!:::$:::::�::::::. F M A M J. ,·,··;t·····. 1::::::J::::::. ··· ··. ·. · · · =.. =..·=..·1 ==�==1=��==�==�=·· ,•.•.• ._=.=.•=t•••••• , : · :;:;:;:l:;:;:fü:;:;:l:;:�:�f�: ::: • : : i: : : 1: : : �:=:•=:·=1i·=:•=:·=-e�:·=:;·:s;:;:;:(::::::!::::::l::::::f:=:=: l: =:=:=�=:=J:;:;:�;:;:;�:;:;:fü:;:;f::::f:: ::; =··=····r= �=·····i·····-r···-·;i: .. ... • • •. :i,· • · · · · · · · - - -. �·==:·==:�==s:J�==:�==:�==¡=::=:: ::�(:::::tt:;::.�:-::1J::·!=:·!=:·!�J·!=·:=:·=�)·:=:·=·:�f=·:=·:=¡·:�=:�·=:·��-::·-::-·::-·t-:·;·:·.·:· ¡·..:·:·3...:· :· :· ¡ ...:· :· :·i .:· .:· ' :���*���*������W�W�fü : : t: : : �: : :=t: : : f: : : 1: : : �: : :(: : ::t: : :(: : : t:=: : 1;:;:;�:;:;:;¡;:;:�:�·=·=·1·=·=·=�·:·:·. 1. .. =..= ;-=�i=;..:;:;r�;:;·:;;�r=;·=�-r=;1;=�·=�=-�i�=��l=�=�l�=�r.,= �ttmtittmtt=�=mttt ��It��=�=��tM:�ItfütfIlIJI}�:�:}�:�:litmmt;�fü!JtI. :,Y,;t9•'•"•t•·•·• ;:;:j;:;:;: : : :. A tota l d i stance of 13,500 Km was covered by pl ane. Ground truth covered 12,500 Km, sampl i n� 4 , 000 po i nts.. 1.
(13) ,......,. · - � · + • . . .... .. 3 1�. .. 1. h1. toll. 1 ··-. PhJoou m L1101ol. : 4jQ!I . 4 8 35 7. 7. 11. _, (X). w. u,. ��. ... ·�· . 14 ,s. �. ... s. �. 1. 14. Yormoaol 1 2 llendzlna 1 3 ' Cornblsol 1 4 Vort11ol l !I Plana,ol 1 6 Solonchak Xeroool-j.111-,1 17 (be). ,__,_. ::!�1 %. 11. 755 . 6 4330. 2 1 94 3, 5 ' 4380. 3 706. 5 !!OO. 5. 1.63 1 9.1 1 4. 3 4 9.24 1 . 44 1. 1 1. 1 7 7. 9. 0.39. 1 119. 2. 0.34. PhaooHm·Lllholol ( 3a - tb) _ Phaoorom·Lllhoaol 0 ( 3a-lc) Phaoonm·Lttholol 1 ( 2 a - l bc) 22 Phooonm·Verll1ol Lltholol-Phaaonrn 23 ( b - 3a) tthoool-PhooozOffl 1 2 4 "" ( c· - 3 a ) ..1thoool-Phmozo111 2 11 (c - 2 b) 211 Lllhosol-Luvloal Flvvlool - V.H� 2 '1 1t. Total. 4. .l. 4. Potentlol land. UH. 1tudles 1n Mexico. G reat. 1011. 0.39 0.33. 1 0 4.4. O 23. 1 3 4. 6. .3. 5 1 0. 9. 0.69. 2 2 11 O. oroupa ond asaoclatio n a . Preliminary ru u Ita .. 1. 0.50. 3 3 1.0. 0.74. ·5 7. 0. 0. 1 2. 4 5 8. 2. 28 !i.pol-S........k 1 11011.2. o t udlH. Flour•. 1 7 7 .0 1 11 1 .0. 1 .02. 1. 1.H. 44,7SU 1 100.00.
(14) . .. . .. . � -+... . .,.. .. .. .. .. .. ...... :. ,. • t1 "'1 + + + • • • • ... '". +•••++". Product i v- Are o in i tv rati ng thousand Ha High. z ¡ Medium s I Low. Total. 1 1 , 1 1 8. 8. 1. 6,275. 0. %. 2485 1 4.04. 27,339. 4. 61. 1 1. 44,733. 2. 100.00. co w O'I. . :f!J Fi gure 5 Potenti al soi l producti vity for agri culture. -- ......-·--·- -·�---.
(15) ... .. ...... �. ... '���. ... . ... .. ....... .. t • •• + +. Producti· Areo i n v ity rot� thousond Ha. º/o. 1. High. 6 ,989 . 9. 2. Medlum. 1 5 ,839 . 8. 53. 3 1. 3. Low. 6 ,8 85 . 7. 23.1 7. 29, 715 . 4. 100 . 00. Total. 2 3. 5 2. Note : Area not ,tudled. ce w -...¡. Floure 6. . Potential soil productivity for grass. (4 ).
(16) ... . . -. �. .. . r ···· ·. • ti .. . + • • • • • •. Risk. , 4�9 1. 1 0,47 1 . 3. 1 2 3.4 2. Low. 1 4, 1 7 1 . 1. Total. 44, 733. 2. 1 3 1 .6 7. 2 1 Medium. :X, .,.J X,. Fiour, 7 Water Eroslon . rlsk. 0/ o. 20,090. 8. High. 5 1. In r Area thousand Ha •. 1100.00.
(17) ". F I G • -1. SC H E D U L E. JANUAU. t.a<D PAPAI.OI\PAN IO.TERSIIID 1 lI. I,mge Interpretation Air ard Field Checkin:¡ Final Delineations & Report. CENIRAL ZACA'Iff:AS Image Interpretation . aro Field . Air Checkin:¡ Fina De meatwns &. t. III PANlO'.l WATERSHID-IOR!lElN VERACIUJZ Image Interpretation Air am Field Checkin;¡ Final Delineations & Report. -' 00 w lO. N. V. 1 I. 1. Vl. OF. TEHUANl'EPEI: IS'llH..5 Image Interpretation Air am Field Checkin;¡ PACIFIC CDASr. Image Interpretation Air aro Field Checkin;¡ Final Delineationa O Raport. IV!m!F.AST Image Interpretation Air aro Field Checkin:J Final Delineationa & Report. VII SOUl'HEI\ST Image Interpretation Air ard Field Checkin:¡ Final Delineatione & Report. VIII CENl'AAL RD,¡g,¡___ Ilt'age Interpretation Air am Field Checkin:J Final Delineations , Rep:lrt. AC T IVITI E S. I H I IIUARY I 1 1. 1. 1. 1. 1. 1 I. i. I. 1. 1. 1. 1. : 1 1. 1. 1 1. ¡. 1 1. 1. 1. 1 .:. : 1. 1. 1. 1 1 ,. 1. 1. 1. 1. 1. 1. 1 1. 1 :. 1. 1. 1 1. 1. ! : :. 1 ! i 1 1. j ; ( 1 1 1 1 1 1. : 1 1. 1 ' 1. !. 1 1. •. 1 !_I : 1 1 1 1 1 I ' 1 .1 ' 1 1 t I i 1. 1. 1 : 1. :. �. LJ� , 1. 1. l I. I. A'IIL. -.-n- 11--r j. 1 1 1· 11 ,1. 1 : 1 1. :. 1 1 1 1 1 , 1 1 1 1 1 1 1 1 ·,'. TH E. P OT E N T I A L. 11 A Y. JUN 1. J ULY. J : 1 1. J I : , 1 1• 1 1. 1. j 1 1 1 : 1 1 1 • ,--, !1 1 1 : 1 1 1 ¡ 1 '1. 1. 1 1 1. :. 1. ! 1 1. 1. 1 1. 1 Í j 1. 1 1 I 1. :. 1. j. ¡ I. 1. 1 1. 1. :. J :. , 1. , 1. :. !. I 1 1. ¡. i:. ___;_____l___J 1 : 1 ,. 1. 1. ¡ : :. 1. !. i ¡. 1. ! :. 1 1. 1 1 1. i •. 1. : 1 j 1 1 I. II A I C H. FOR. : : ! j : j : 1 1 ! 1 1 1 1 1 :. 1I :. 1 : 1. i. 1 1 '1 , , 1 1 1 1 1 1 1 1 1 '1 ! 1. i i. 1. 1. 1 1 1. 1 1 Í 1 ,. 1 ! : j 1 1. ! : !. 1 l 1. :. 1. 1 ¡ 1. : 1. 1 1 :. : 1 :. !. 1. 1. i. I. 1 : 1 1 , l. 1 ·I. : ,. l_. 1 : 1 :. :. 1. 1 1 1. ! 1. ___J 1. i. ¡ 1 1. 1. 1. 1. 1. 1 1 l. -- 1. : l 1 1. -: 1. J j j 1 1 1 !. 1. 1. 1 1 1. 1. 1. 1. i 1. 1. 1. 1. 1 !. 1. 1 1 , ' 1 1. ,. 1. 1 1 1. l. 1. 1 I 1 . 1 ' 1 1 I •1. 1 1 1 1 1 1 1 : 1 1 1 1. j. l. l. : I. ! ' 1 1 1 1. 1. 1. : ! 1. Í 1 1. 1 !. 1. 1. 1. !. !. :. 1. 1 ·1 1. 1 1 1. 1 :. 1 1. 1 1 1 ! • ,1 1 1 1 1 · 1•. : 1. 1. 1 1. 1. 1. 1. 1 1 1. I 1. _l_ 1. j-----. 1 ,. :. 1 1. i :. ! \ ! l-! - Jj I Í 1. !. ; · 1 ¡. �_. 1. :. October 1 11ov1111u I. 1 1 .1 1 1 1 :. 1. j J , 1 I. 1. :. ¡. STUDY. j J 1. I. I : 1 I J 1 I J l ¡ 1 1 1 1 1 1. _l _l _1. 1 1. ! 1. J : j 1 , :. Í. : 1 , • 1 1. ! _J. '! ,-r-1-¡ .--------,----i -, -·-r·-- ¡ r ---, i ¡ i l ! i i 1· 1 : l 1 1. 1 1. 1 :. 1 1 1. 1 1. USE. ,u e u n 111,n111u 1. J. 1 l 1 1 i :. 1 '. LAN D. 1. 1. •:. íl. 1 :. 1. 1 1 '. 1 1. ' : ,. !I. l. +H '. !. :. 1. :. : , 1. :. I -1. 1. ·\ 1 1 1 ' 1 1 ! 1 i 1 :. 1. r-1- f 1. 1. 1 1 1 1. 1 : I 1 j ,. 1. i. 1 1 I. t I. 1. :. ! :. 1. .:. :: :. 1 !. 1. j. : : 1 1. 1 1 , ' 1 1 1 1 ! 1 1 1 ·1 1 1 1 1 --i----f--; , ¡ . • - -1 1 , 1 1 : : 1 1. 1 J 1 1 ' :. 1. H c , 11 1 11. 1 1. 1 1 : T 1 1. '. ¡. ,. ,. 1 j 1 j J : 1 1 __r___j l. !! lj 1. 1 1. :. __l _ _l. :. 1. llii1 •11.
(18)
Figure
+2
Documento similar
Summary of the varying number of found and eventually selected Sentinel-2 image tiles of 224 × 224 pixels depending on the different consensus level reached across the 15 Land-Use
Contrasting the pastoral lifestyle of the hobbits, who make a responsible and respectful use of the land, and the environmental aesthetics of the elves, who
The data obtained from the study area provide a broader view of the concentration, distribution, enrichment, sources, and the potential environmental contamina- tion by As in
50 The goal is to help people to reach an optimum level in the dimensions of psychological well- being: environmental mastery, personal growth, purpose in life,
Considering LCC A as the Land Cover Component for land cover class A, and LCC B as the Land Cover Component for land cover class B, Equation 1 is transformed into
The biosphere reserve model explicitly recognizes the necessity of integrating different actors into the design and implementation of effective mechanisms of biodiversity
The majority of crusaders probably returned to the West in the summer of 1099, but those lords and knights who remained went on to constitute the military and administrative
The broad “WHO-ICF” perspective on HrWB provided at Figure 1 has a significant implication also for HRQoL. The develop- ment of ICF and its conceptual approach has challenged to
