The HST/ACS Coma Cluster Survey V Compact stellar systems in the Coma Cluster
Texto completo
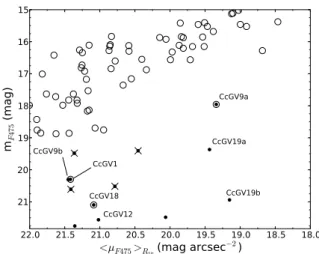
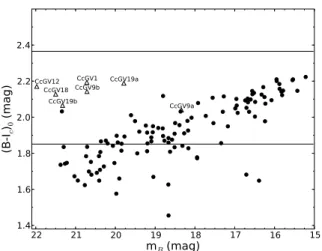
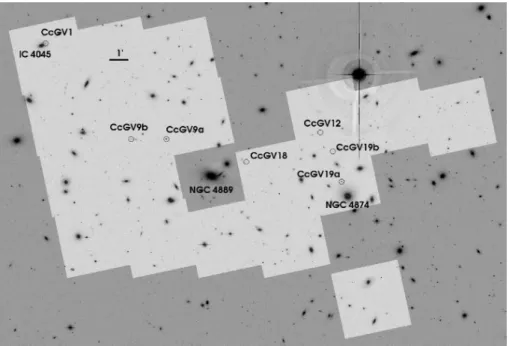
Figure


Documento similar
With this design, it has been evidenced that the equilateral triangular resonator may be a promising geometry yet to be exploited in the design of compact microwave lters, and
This implies that the simulations, which span the range 52<V flat <222 km s −1 where V flat is the circular velocity at the flat part of the rotation curve, and match
It is shown that for a wide class of spaces, namely the locally compact σ-compact ones, the Riesz decomposition on the monoid forces the (covering) dimension of the space to be
This component allows for the introduction of a rank discount by having ( | ) reflect the fact that the lower an item is ranked in , the less likely it will be seen.
However, we find tentative evidence that the (g − K) colour distributions remain bimodal in the two cluster-rich galaxies in our sample (NGC 4486 and NGC 4649) when restricted
The circularized stellar mass density profiles for the galaxies in our sample, comparing them with similar mass SDSS ETGs and the massive compact galaxies in Szomoru et al..
For a given metallicity, the changes in the emission-line spectrum and in the ionization parameter are due to the changes in the cluster mass, which determines the number of
Relationship between the total cluster stellar mass and the photometric blue fraction for the ALHAMBRA cluster and group sample stacked into different redshift bins. The galaxy
