Why do some prices in the retail sector drop when demand rises? : evidence from the chilean case
18
0
0
Texto completo
(2) 152. REVISTA ABANTE, VOL. 10, Nº 2. There is growing empirical international evidence that the prices of retail products tend to drop temporarily during seasons of high demand. Once the demand returns to its original level, prices rise. Under the perfect competition models, a positive demand shock helps keep prices the same or pushes them up, but never down. So, this price trend must be explained by imperfect competition models. The purpose of this article is to investigate whether this effect takes place in the retail sector in Chile and identify which of the imperfect competition models better adapts to the results. The investigation took into account some mass consumer retail products for which there is a clear positive seasonality during the course of the year. The data was taken from the National Statistics Bureau (INE)’s monthly consumer price series for Santiago and the Wholesale Price Index (IPM). According to Chevalier, Kashyap and Rossi (2003), there are three imperfect competition models that explain this countercycle in prices: the implicitly colluded oligopoly model of Rotemberg and Saloner (1986), where the equilibria in the industry oscillate between cooperative and uncooperative trends, depending on whether demand is low or high; the procyclical demand elasticity model of Warner and Barsky (1995), based on the existence of economies of scale in the search for information; and the theory of the loss leaders according to which retailers offer significant discounts on specific products in order to attract buyers to the store, and thus increase their profits. The results obtained in this study indicate that as it happens internationally, there are indeed price reductions in products for which there are seasonal rises in demand. When comparing theories, we find that the results are more consistent with the loss leader theory than with the other two competing explanations. This article is organized as follows: Section I contains a review of literature, Section II describes the methodology and data used, Section III presents the results and Section IV, the conclusion.. I. REVIEW OF LITERATURE. Although there are several theories on price discounts, none is capable alone of explaining all the phenomena seen..
(3) WHY DO SOME PRICES IN THE RETAIL SECTOR. 153. There is a growing set of international empirical evidence that registers countercyclical movements in prices. Specifically, the data shows that positive demand shocks are associated with reductions in prices. This price behavior cannot be explained by models of perfect competition unless there are economies of scale in production. If there are economies of scale, a positive demand shock may bring prices down if the implicit production increase results in a cost reduction in companies that facilitates the occurrence of such price reduction. This case is not analyzed in this paper. There are some price discounting theories that do adequately address some material aspects of consumer and market behavior, but they are incapable of explaining countercyclical price movements. They include the theory of price discrimination of Varian (1980) and the theory of uncertain demand of Lazear (1986). Varian (1980) holds that discounts are a sort of price discrimination among consumers who are more informed or for whom the cost of finding information is lower than for those who are less informed or for whom the cost of being informed is higher. Lazear (1986) studied the behavior of prices in products with uncertain demand. Since the demand for a product is uncertain, supposing that the retailer has more than one period to set prices, he decides to begin selling initially at high prices, to then lower the prices of the products still unsold in the second period. This strategy of starting with high prices and then dropping them maximizes the expected profits of the retailer and assumes that a price that drops will not rise again. Pashigian and Bowen (1991) apply the Lazear model to fashion products since they are directly associated with products of uncertain demand as fashion products are new and no one knows exactly how consumers will react to them. The retailer begins the season with high prices, to then lower the price for what is left unsold. According to this model, discounts or sales take place towards the end of the season, which means that price movements are procyclical and not countercyclical. Nevertheless, when they measure discounts for seasonal sales using the uncertain demand model of Lazear (1986), they find evidence of the existence of a countercyclical trend in prices in some products (prices tend to drop during periods of high demand), which cannot be explained by Lazear’s theory. There are three imperfect competition models capable of explaining the phenomenon of countercyclical movements in prices (e.g. theories explaining price reductions during periods of exogenous increases in demand): the theory of a temporary rupture of collusion agreements, by Rotemberg-.
(4) 154. REVISTA ABANTE, VOL. 10, Nº 2. Saloner (1986); the theory of procyclical elasticity of demand, of Warner and Barsky (1995); and the loss leaders theory. The theory of the price war in boom periods developed by Rotemberg and Saloner (1986) suggests that companies alternate between being cooperative and uncooperative depending on whether demand is low or high. In periods of high demand, companies tend to steer away from implicit oligopolistic agreements and behave more competitively, with the consequent reduction in prices and margins. This is because in those periods it is more costly to maintain an agreement as the benefits of moving away from the oligopoly increase. Companies that break implicit commitments are willing to face the future penalties since they know that those penalties will be imposed at a time when demand has already fallen to its original level and, therefore, what they risk losing is less than what they gain by breaking free. The authors hold that this behavior is especially valid in situations where prices are a strategic variable and production costs are constant. They find moderate empirical support for their theory. The other model of imperfect competition is that of Warner and Barsky (1995), who hold that demand elasticity is procyclical given the existence of economies of scale in the search for information. In periods of intense buying activity (positive demand shocks), consumers are more interested in looking for better than normal prices or discounts as the investment in time and other costs of the search must be distributed among a higher total purchase. Hence, the unit cost of the search falls. In this context, when consumers are more informed, vigilant and price sensitive, retailers tend to lower their prices as they envisage a more elastic demand for their products. Once the positive demand shock is over, the products’ elasticities fall to their original values and prices rise to previous levels. These authors studied the daily prices of eight products from November to February across 17 different stores within a zone in Michigan. They found important discounts in the pre-Christmas period, during week-ends, and on holidays (Thanksgiving). They concluded that discounts are offered in periods when demand is unusually high. The third model is the loss leaders model. In this model the retailer chooses to offer some products at a low price (close to or even below the marginal cost) in order to attract buyers to the store. It assumes that consumers enter a store attracted by specific discounts and once inside, they buy other additional products, thus increasing the overall profits of the retailer. This theory is sustained on the existence of multi-product enterprise.
(5) WHY DO SOME PRICES IN THE RETAIL SECTOR. 155. competition, imperfect information on prices, and a complementarity of goods in the purchase by consumers. The latter is grounded on the fact that buying is costly to them given the time this activity consumes. The “onestop” shopping is benefited since there are economies of scale in buying more than one product at a time (Betancourt and Gautschi, 1990). Lal and Matutes (1994) formalize the loss leader argument as traffic generators in a model of two companies, each offering the same two products. They assume that consumers do not know the prices of the products unless they are advertised and that there are economies of scale in buying more than one product at the same time even if they are unrelated. They conclude that, in equilibrium, both firms opt to offer the same product at a price equal to or lower than their marginal cost (loss leader) and to advertise this product, and that consumers have a positive surplus from it even knowing that the unadvertised product will be sold at a higher price. In selecting products to be treated as loss leaders, retailers must consider what prices consumers look at in making a decision whether or not to enter the store. This is very important to retailers since they understand that consumers are incapable of knowing each of the prices of the products they purchase and, therefore, only remember a limited number of them. A study conducted by McKinsey Quarterly in an enticement product study revealed that 74 percent of consumers base their price assessment of the store on a few products. On average, consumers say they memorize 3.8 prices in making that assessment. Strictly speaking, any product could be loss leader.1 Some seasonal products can be good candidates to be considered loss leaders at their peak moment in demand, because consumers set their eyes on them. If retailers find that these products create traffic to the store, they may decide to offer them at prices close to, or even below, their marginal costs. If this is the case, when sales volumes are high, product prices fall because of the proactive effect of the distributor reducing margins. Chevalier, Kashyap and Rossi (2003) analyze the movements in the prices of supermarket products in order to detect potential countercyclical. 1. The same study by McKinsey Quarterly found that enticement products differ among the Latin American cities analyzed. For example, in Buenos Aires, the enticement product is 1 kilo of Ledesma sugar; in Bogotá, it is 1 liter of soybean oil; in Mexico City, it is 1 liter of regular oil among low-income consumers and Ariel detergent among high-income consumers..
(6) 156. REVISTA ABANTE, VOL. 10, Nº 2. variations and test the three alternative models of imperfect competition. They measure prices weekly for 29 types of products, representing close to 30 percent of total sales in the Dominick’s Finer Food supermarket chain (the second most important chain in Chicago, with 100 stores and a 25 percent market share) for a period of seven and one-half years, taking into account final prices, retailer purchase prices and their margins. They prove the existence of reductions in product prices during periods of seasonal increases in demand. In order to compare the three models empirically, the authors consider the specific implications of each. Although the three predict a drop in prices when there is a generalized increase in demand towards the store, these predictions differ when there are specific increases in demand for certain products and aggregate demand remains low. Only the loss leader theory supposes that the prices of products will drop when there are idiosyncratic increases in demand for those products in particular. It also assumes that the retailer margins for those specific products will fall as well. The price war theory and the procyclical demand elasticity theory predict generalized reductions in prices and in retailer margins during a boom in aggregate demand, but not a specific boom for specific products. Both the price war theory and the procyclical demand elasticity theory suppose that wholesalers or manufacturers will reduce their prices for specific products in this type of seasonality. The procyclical elasticity of demand model stems from the fact that the greater sensitivity of consumers to prices is transferred from retailers to them. The price war theory supposes that manufacturers of products with seasonal peaks in demand will be encouraged to abandon their collusive agreements temporarily as long as this increase in demand persists, which means that they will reduce their margins and, therefore, the sale prices of their products. This does not occur in the loss leader theory, where the retailers are the ones who proactively reduce their margins for selected products (in this case, the margins for products with seasonal peaks in demand) such that no reduction in manufacturers’ prices or margins should be expected. The results show that the prices of products with positive demand seasonality fall more often because of reductions in the sales margins for those products than because of the reductions in purchase prices. This is clearly consistent with the loss leader theory and not with the other two, where a manufacturer price reduction would be expected. Furthermore, the authors consider the preThanksgiving and Christmas periods to be a generalized seasonality of high demand. During those periods, no generalized reductions in the prices of.
(7) WHY DO SOME PRICES IN THE RETAIL SECTOR. 157. all products studied were seen but rather a slight rise in the average price. This result does not adjust to the theories of a temporary break of collusive agreements nor of procyclical elasticity in demand, even though the authors do say that their results do not allow them an outright rejection of these theories since they are considering just a subset of the products sold by the supermarket and not all of them. MacDonald (2000) also records countercyclical movements in the prices of food products in supermarkets, noting reductions in periods of high demand and increases once demand falls. In turn, drops in prices do not appear to be linked to reductions in the prices of inputs but rather to decreases in the margins of supermarkets. A price drop is seen to coincide with an increase in promotional activity during demand peaks. II. METHODOLOGY AND DATA A.. Methodology. The objective of this paper is to determine whether there is a countercyclical relationship in Chile between prices and exogenous demand shocks for a set of retail products and, if so, which of the three theories (Rotemberg-Saloner, Warner and Barsky, or Loss Leaders) is more compatible with data. The methodology follows the line of Chevalier et al. (2003) The equation to be estimated is the following:. Pi,t = α + βPi,t −1 + γDt + μi,t. ∀i,. where Pi, t is the real monthly price of product i in period t deflated by the CPI, Pi, t −1 is the same price with a lag of one month, and D t is the dummy matrix that includes the seasonal effects it considered and uses a value = 1 for periods when demand is seasonally high and a value = 0 for months when demand is low. If prices of some products are seen to fall during exogenous demand increases, the next step is to try to discriminate between the three alternative models. The differences between them must be considered. Table 1.
(8) 158. REVISTA ABANTE, VOL. 10, Nº 2. summarizes the effects of each of the theories on retailer sale and purchase prices. Table I shows that all theories predict low retail sale prices during exogenous increases in demand, but with differences. Both the RotembergSaloner theory as well as the Warner and Barsky theory predict price drops for a set of products when there are more generalized demand shocks. The Rotemberg-Saloner theory assumes that when collusion agreements between retailers break up because of a temporary increase in demand, they tend to lower the prices of products generally, and not specifically, since those agreements were based on prices for a set of products and not one in particular. According to Warner and Barsky, consumers become more vigilant of prices during an increase in demand since economies of scale arise in the search for prices that make them more sensitive to prices (the price elasticities of demand for products that they purchase are procyclical). Thus, prices of a set of products tend to fall to the extent that consumers are better informed of the different products and not of just one in particular. The loss leader theory predicts price reductions for some specific products when there are specific demand shocks associated with those products. This theory supposes that the retailer proactively selects those products for which to lower price and attract consumers to the store. This selection is made by the retailer based on his estimates of how much traffic the products he chooses will bring in. It suffices to see a price reduction in just one product at a moment when that product has a seasonal rise in its particular demand for this to be compatible with the loss leader theory. In other words, no price drops are required for each of the products during their specific increases in demand. The reason is that only some of these products can be selected by retailers to be loss leaders. Hence, the first difference is that under the loss leader model, specific price reductions are expected for specific products that experience demand shocks. Under the other two models, more generalized price reductions are expected during also generalized increases in demand, as it occurs in the month of December because of Christmas. There are also differences across the theories in terms of implications for retailer purchase prices, as shown in Table I. Both the RotembergSaloner as well as the Warner and Barsky theories indicate potential drops in purchase prices. Only the loss leader theory does not. According to Rotemberg-Saloner, the rupture of collusion agreements may occur at the level of producers of certain goods with demand shocks and not at the retailer level. In this case, what should be seen is a drop in manufacturing.
(9) WHY DO SOME PRICES IN THE RETAIL SECTOR. 159. TABLE I SUMMARY TABLE OF THEORIES OF IMPERFECT COMPETITION EFFECT OF THE DIFFERENT THEORIES ON THE PRICES OF GOODS WHEN THERE ARE EXOGENOUS DEMAND SHOCKS. Theo ries 1.. Ru p tu re o f C ol lus io n A g ree me n ts Ro tem b erg -Sa lo ner. R etail er P r ices E ffe c t: P rices d ro p fo r a set o f p ro du cts w h e n t here a re g en erali ze d s ho cks in d e m a nd . C aus e: Im p licit co llus io n ag ree men ts b etw een retai lers are b rok en. T h ey co ns ider th at th e b e n efit s fro m d ev iatin g fro m a g re e men ts are g reater th an t he san c tio n th ey w ill receive if th ey o c cur in dem and p eaks and the s anc ti on w ill o ccur w he n th e d em an d return s to its n orm al lev e l. 2 . Pro cycli cal P ric e El a sticity W arner Ba rsk y. E ffe c t: P rices d ro p fo r a se t o f p ro du cts w h en t here a re g en erali z ed d ema nd sh ock s. C aus e: T h e inc rea s e i n p urch ase vo lu m e creates e con o mies of sc ale in the s earch for p ric e in form a tio n. T hi s increase s the elas ticities of d ema nd and has re p ercus sio ns on redu ctio ns i n p ro d uct p rices.. 3 . L o ss L ea d er M o d e l. E ffe c t: P rices d ro p fo r s pe cific p rod u cts that ex p e ri ence a p arti cular ex og en ou s d ema nd sh ock . C aus e: R etailers k n ow th a t co ns um e rs lo ok at the p rices o f certa in p rod u cts to m ak e ge n eral e s tim ates o f prices in a su perm arket. So th ey red uc e th e prices fo r t ho se p rod u cts (inclu d ing bel ow th eir m argin al co sts) to enti ce co n su mers an d cre ate tra ffic to th e sto re . T h e pro du cts w ith ex og eno u s d ema n d s ho ck s m ay b e go o d en ticem ent s.. Theo ries. 1 . Ru p tu re o f C ol lus io n A g ree me n ts Ro tem b erg -Sa lo ner. P rod ucer or Su pplier P rices. E ffe c t: P rod ucer p ri ces ma y d ro p w he n t hey exp erienc e an ex og en ou s sh o ck in de man d fo r t he ir p ro d ucts . C aus e: L ik e in t he c ase o f retai le rs , p ro du cers of go o d s are en cou raged to b reak i mp lic it c o llu sio n a g reemen ts i n p eriod s o f h ig h d ema nd bec au se th e y w an t to ben efit fro m t he tem po ra ry sh o ck in d ema nd . T h is b enefit w il l b e g reat er th an th e ex pec ted san c tio n th at w il l o ccu r w h en the d ema nd has res um e d i ts n orm al level. 2 . Pro cycli cal P ric e El a sticity W arner Ba rsk y. E ffe c t: P rod ucer p ri ces ma y d ro p fo r p rod u cts e x pe rien cing in creases in th e e l asticit y o f d eman d . C asu e: R etailers tra n sfer t he in creased elasticit y in dem an d to p rod u cers that th ey face du rin g p eriod s o f g eneraliz ed sh o cks i n d ema nd .. 3 . L o ss L ea d er M o d e l. E ffe c t: T he p ri ce s of sp ecific pro d ucts d o no t dro p w h en th e re are s pecific sh o cks i n d ema n d . C aus e: R etailers p roact ive ly redu c e the p rices o f sel ecte d en ticem ent p ro du c ts. T his is no t tran sfe red to s up p liers sin c e th ey d o n ot b en efit fro m th e exp e cted effec t o f th e mea sures , w h ic h is to crea te traffic. W h at d o fall a re ret ailer m a rgi ns fo r th e p ro d ucts i n q ues tio n ..
(10) 160. REVISTA ABANTE, VOL. 10, Nº 2. prices or retailer purchase prices. The Warner and Barsky theory can also imply drops in retailer purchase prices since they transfer the greater price sensitivity that they pick up from consumers to their suppliers. The loss leader theory supposes that the retailer decides to lower the product price that is experiencing a positive demand shock at the cost of reducing his own sales margins (even to the point of operating negatively for the selected product), which has no impact on the product purchase price. It is therefore inferred that the behavior of product purchase prices when there are demand shocks is important in discriminating between the theories. For this reason, analogously, the same equations were estimated for each of the products, but using the retailers’ purchase prices. The hypothesis is that seasonal products experience consumer price reductions during their demand peak. According to Chevalier et al. (2003), the results will be consistent with the loss leader theory if the prices fall when there are idiosyncratic increases in demand for a specific product but no generalized price reductions for the rest of the products. This theory is reinforced when the retail purchase prices do not fall because of specific demand shocks, which would mean that the drop in the sale price stems from a reduction in the retailer’s margin for that product. If what is seen are reductions in a set of prices at the retailer level, then the results would be more consistent with the theories of Rotemberg and Saloner or of Warner and Barsky. This would be reinforced if drops were also seen in purchase prices. B. Data. The prices of the products studied were taken from the INE’s monthly price series for Santiago and from the IPM for use as estimators of retail purchase prices. The period analyzed ran from January 1999 to December 2005. Products were selected from the INE’s monthly price series for Santiago for which there was a clear seasonality of positive demand throughout the year. The products chosen under these criteria were: one liter of ice cream with summer seasonality, since 53 percent of total ice cream sales in the year occur between December and March, according to Estrategia newspaper of October 6, 2003; tempera, cardboard and drawing paper with high seasonality during March because of the start of the school year. Also.
(11) Toothpaste. Cereal Regular bread. Broom M ilk fortifier Laundry Detergent. 2. Non-Seasonal Products. X. Empanada. X X. X X X X. X. Holidays. Doll Wine. Ice cream Tempera Cardboard Drawing paper. Summer. New Years. Independence. Children’s Day. Start of School. Year. Nov. to Feb.. December Christmas &. Seasonality September. August. March. 1. Seasonal Products. TABLE II LIST OF SELECTED PRODUCTS. WHY DO SOME PRICES IN THE RETAIL SECTOR 161.
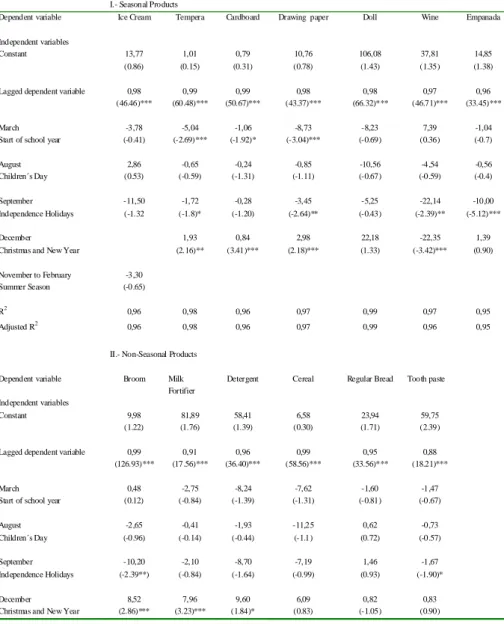
(12) 162. REVISTA ABANTE, VOL. 10, Nº 2. included are: a doll highly demanded in August for Children’s Day; the “empanada” (a type of meat pastry) that is popular in September because of the Independence Day holidays (at DyS, sales of empanadas in September rose 900 percent compared to a regular month (Estrategia newspaper of September 15, 2003); and wine that is popular in September for the same reason and in December for Christmas and New Year’s. Wine sales may increase up to 80 percent in September (Cable Channel 13, September 8, 2005). For control purposes, a group of products was also selected for which there is no clear seasonal pattern. The products selected for control were: a broom, milk fortifier, laundry detergent, cereal, regular bread and toothpaste. Table II contains the products selected and their associated seasonality and control products. III. RESULTS AND COMMENTS A.-. Consumer Prices. Table III contains the results obtained from the end product prices. The results tend to confirm the hypothesis on the existence of countercyclical movements in some the prices of some products when there are exogenous increases in their respective demands. Tempera dropped by CH$5.04, cardboard by CH$1.06, and drawing paper by CH$8.73 in March, which corresponds to the start of the school year. In September, the Independence Holiday month, the empanada price fell by CH$10 and wine by CH$22.14. In December, wine dropped by CH$22.35. All are statistically significant. The price drops for the doll in August and ice cream during the summer season are not statistically significant. The prices of products considered non-seasonal (i.e., brooms, milk fortifier, laundry detergent, cereal, regular bread and toothpaste) did not show any significant price variations except for milk and detergent, where there was a significant seasonal rise during December. Moreover, the results indicate that seasonal products did not significantly drop in price during any of the idiosyncratic peaks in demand tested other than those directly associated with them (except for drawing paper, for which the price drops in September). Ice cream showed no significant variations in March, August or September. The tempera and.
(13) WHY DO SOME PRICES IN THE RETAIL SECTOR. 163. TABLE III RESULT CONSUMER PRICES Dependent variable Independent variables Constant. I.- Seasonal Products Ice Cream Tempera. Cardboard. Drawing paper. Doll. Wine. Empanada. 13,77 (0.86). 1,01 (0.15). 0,79 (0.31). 10,76 (0.78). 106,08 (1.43). 37,81 (1.35). 14,85 (1.38). 0,98 (46.46)***. 0,99 (60.48)***. 0,99 (50.67)***. 0,98 (43.37)***. 0,98 (66.32)***. 0,97 (46.71)***. 0,96 (33.45)***. March Start of school year. -3,78 (-0.41). -5,04 (-2.69)***. -1,06 (-1.92)*. -8,73 (-3.04)***. -8,23 (-0.69). 7,39 (0.36). -1,04 (-0.7). August Children´s Day. 2,86 (0.53). -0,65 (-0.59). -0,24 (-1.31). -0,85 (-1.11). -10,56 (-0.67). -4,54 (-0.59). -0,56 (-0.4). September Independence Holidays. -11,50 (-1.32. -1,72 (-1.8)*. -0,28 (-1.20). -3,45 (-2.64)**. -5,25 (-0.43). -22,14 (-2.39)**. -10,00 (-5.12)***. 1,93 (2.16)**. 0,84 (3.41)***. 2,98 (2.18)***. 22,18 (1.33). -22,35 (-3.42)***. 1,39 (0.90). 0,96. 0,98. 0,96. 0,97. 0,99. 0,97. 0,95. 0,96. 0,98. 0,96. 0,97. 0,99. 0,96. 0,95. Detergent. Cereal. Regular Bread. Lagged dependent variable. December Christmas and New Year November to February Summer Season 2. R. 2. Adjusted R. -3,30 (-0.65). II.- Non-Seasonal Products Dependent variable Independent variables Constant. Broom. Milk Fortifier. Tooth paste. 9,98 (1.22). 81,89 (1.76). 58,41 (1.39). 6,58 (0.30). 23,94 (1.71). 59,75 (2.39). 0,99 (126.93)***. 0,91 (17.56)***. 0,96 (36.40)***. 0,99 (58.56)***. 0,95 (33.56)***. 0,88 (18.21)***. March Start of school year. 0,48 (0.12). -2,75 (-0.84). -8,24 (-1.39). -7,62 (-1.31). -1,60 (-0.81). -1,47 (-0.67). August Children´s Day. -2,65 (-0.96). -0,41 (-0.14). -1,93 (-0.44). -11,25 (-1.1). 0,62 (0.72). -0,73 (-0.57). September Independence Holidays. -10,20 (-2.39**). -2,10 (-0.84). -8,70 (-1.64). -7,19 (-0.99). 1,46 (0.93). -1,67 (-1.90)*. December Christmas and New Year. 8,52 (2.86)***. 7,96 (3.23)***. 9,60 (1.84)*. 6,09 (0.83). 0,82 (-1.05). 0,83 (0.90). Lagged dependent variable. t-statistics between parenthesis *significant at 10 per cent, **significant at 5 per cent, ***significant at 1 per cent. Notes: - The null hypothesis of unit root is rejected. Dickey Fuller test were performed. - The regressions were run using the White - Consistent Standard Errors & Covariance method..
(14) 164. REVISTA ABANTE, VOL. 10, Nº 2. cardboard prices rise in December and do not change in August or September. There were no changes in the price of wine in either March or August while the empanada did not vary in price in March, August or December. These results reinforce the evidence that price reductions in products are directly related to exogenous increases in their respective demands. This countercyclical price behavior of products in this study cannot be explained by perfect competition theories where the peaks in demand mean that prices remain the same or rise but do not fall unless there is a cost reduction simultaneous to that rise that more than offsets the effect of the rise, which is unlikely, and goes beyond the scope of this paper. Nor can these results be explained applying the Lazear theory (1986) developed by Pashigian and Bowen (1991) to fashion products since, according to them, price drops must occur after, and not during, a period of high demand. So, the answer to this price behavior must be sought in theories of imperfect competition. Opinions can be expressed regarding the different theories based on the results of the end prices of the products selected, following the line of Chevalier et al. (2003). According to the authors, neither the theory of the procyclical elasticity of demand nor the theory of the break of collusive agreements is consistent with the fact that specific prices fall in periods of high specific demand for those products since both theories implicitly entail a more generalized reduction in the prices of products that is not focalized during specific rises in demand for some products in particular. The specific drops in prices better fit the loss leader model where the retailer proactively reduces the prices of the relevant products since he selects them as an anchor for the purpose of bringing consumers into the store. The specific drops in the prices of empanadas and wine in September, cardboard, drawing paper and tempera better adapt to the loss leader theory than do the other two. This is supported by the fact that nonseasonal products experience no price reductions in the peak months of exogenous demand for the different products selected. The same occurs with the prices of seasonal products in the peak periods of demand not associated with them. However, strictly speaking, the behavior of all prices should be tested in periods of generalized rises in demand in order to reject the theories of procyclical demand and a temporary breach of collusive agreements, which goes beyond the scope of the study..
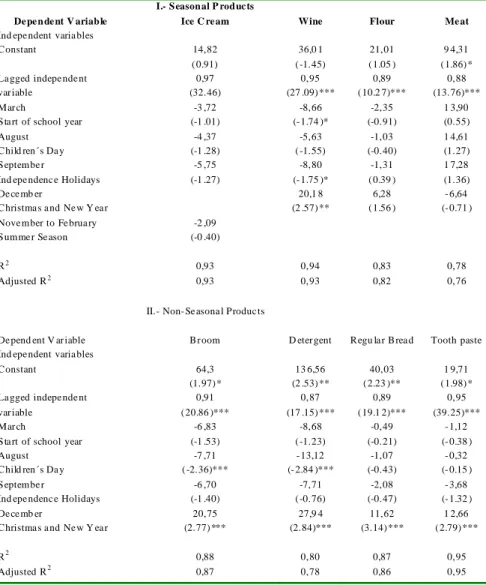
(15) WHY DO SOME PRICES IN THE RETAIL SECTOR. 165. B.- Wholesale Prices. Table IV contains the wholesale prices of products as proxies of the retailer purchase prices. The IPM data was not available for all the products selected so a subset had to be used. In the case of the empanada, since there is no wholesale price, the wholesale prices of flour and meat were used to indicate their direct cost. Table IV shows that the wholesale prices of seasonal products or their direct inputs do not fall during peaks in idiosyncratic demand. The wholesale price of ice cream showed no significant change during its seasonal peak (summer). Flour and meat (both empanada materials) recorded no significant variations in September. The wholesale price of wine rose significantly in December and fell in March and in September by CH$ 8.8. In this case, it could be thought that the price drop for the wine consumed during September is due to the drop in its wholesale price. However, the price reduction for the consumer is greater than the wholesale price reduction (CH$22.14 and CH$ 8.8, respectively), which leads to assume a reduction in the retailer’s margin for that product during September. The prices of non-seasonal products all climbed at Christmas time, with a 99% level of significance. The results indicate that there is no correlation between wholesale prices and peaks in exogenous demand for empanadas and wine en December. This is consistent with the loss leader theory, since reductions in end prices come from promotional efforts of retailers and not supplier price reductions. This is more evident yet in the case of wine, since its wholesale price rises in December and the consumer price falls that same month. In the case of wine in September, it can be assumed that the retailer’s margin will fall that month for that product since the consumer price reduction is more than twice the wholesale price reduction. These results fit neither the theory of procyclical demand nor that of a temporary breach of collusive agreements since the supplier prices should tend to fall according to both. An analysis of consumer price and wholesale price behavior reveals that the results are compatible with the loss leader theory and not with any of the other two theories, even though they are not rejected altogether since a study of a more ample set is required or even of all products offered by the store. As mentioned above, the loss leader strategy is based on the existence of multiple product companies as they can afford to work with.
(16) 166. REVISTA ABANTE, VOL. 10, Nº 2. TABLE IV RESULTS WHOLESALE PRICES I.- Seasonal P roducts Dependent V ariable Ind ependent variables Constant. Ice C ream. Wine. Flour. Meat. Lagged independent variable. 14,82 (0.91) 0,97 (32.46). 36,0 1 (-1.45) 0,95 (27 .09)***. 21,01 (1.05 ) 0,89 (10.2 7)***. 9 4,31 (1.86)* 0,88 (13.76)***. March Start of school year. -3 ,72 (-1 .01). -8,66 (-1.74 )*. -2,35 (-0.91). 1 3,90 (0.55). August Child ren´s Day September Ind ependence Holidays Decemb er Christmas and New Y ear. -4 ,37 (-1 .28) -5 ,75 (-1 .27). -5,63 (-1.55) -8,80 (-1.75 )* 20,1 8 (2 .57)**. -1,03 (-0.40) -1,31 (0.39 ) 6,28 (1.56 ). 1 4,61 (1.27) 1 7,28 (1.36) -6,64 (-0.71 ). November to February Summer Season. -2 ,09 (-0 .40). R2. 0,93. 0,94. 0,83. 0,78. Adjusted R 2. 0,93. 0,93. 0,82. 0,76. II.- Non-Seasonal Products Depend ent V ariable Ind ependent variables. Broom. D etergent. Regu lar Bread. Tooth paste. Constant Lagged independent. 64,3 (1.97)* 0,91. 13 6,56 (2 .53)** 0,87. 40,03 (2.23 )** 0,89. 1 9,71 (1.98)* 0,95. variable March Start of school year August Child ren´s Day. (20.86 )*** -6 ,83 (-1 .53) -7 ,71 (-2.36)***. (17 .15)*** -8,68 (-1.23) -13,12 (-2.84 )***. (19.1 2)*** -0,49 (-0.21) -1,07 (-0.43). (39.25)*** -1,12 (-0.38 ) -0,32 (-0.15 ). -6 ,70 (-1 .40) 20,75 (2.77)***. -7,71 (-0.76) 27,9 4 (2.84)***. -2,08 (-0.47) 11,62 (3.14)***. -3,68 (-1.32 ) 1 2,66 (2.79)***. 0,88 0,87. 0,80 0,78. 0,87 0,86. 0,95 0,95. September Ind ependence Holidays Decemb er Christmas and New Y ear 2. R 2 Adjusted R. t-statistics between parenthesis *significant at 10%, **significant at 5%, ***significant at 1%. Notes: - The null hypothesis of unit root is rejected. Dickey Fuller test were performed. - The regressions were run using the White - Consistent Standard Errors & Covariance method..
(17) WHY DO SOME PRICES IN THE RETAIL SECTOR. 167. very low and even negative margins for some products since benefit of creating traffic largely exceeds the cost. This benefit is lower in companies that work with a reduced variety of products. The empirical results of this study, consistent with the loss leader theory, agree with the strong increase in the share of hypermarket formats that has taken place in Chile in recent years, a phenomenon that has also been seen in the rest of the world. According to AcNielsen (2004), the percentage sales of hypermarkets as compared to all supermarkets in Chile rose from 20 percent in 2000 to 32 percent in 2003. In the United States, a fundamental part of Wal-Mart’s success has been the proliferation of its hypermarket, which grew from 10 stores in 1992 to 1006 stores in 2002 (Bell and Feiner, 2003). Ellikson (2005) claims that the proliferation of hypermarkets is related directly to industry concentration as the advanced logistical systems required by this type of format result in economies of scale and of scope that favor large companies on the market. In Chile, the two leading supermarket chains have expanded very heavily and as of March 2006, held 62.6 percent of all sales in the industry nationwide. IV. CONCLUSIONS. The principal conclusion from this study is that consumer prices for a set of retail products in Chile fall when their demands experiment a positive shock. Internationally, there is empirical evidence that detects this price behavior. This behavior is not consistent with theories of perfect competition, where positive demand shocks are associated with prices increasing or remaining the same, but not falling. Of the three models of imperfect competition capable of explaining this phenomenon, the loss leader theory is the one that best fits the data. According to it, retailers proactively cut the prices of products when their demand is seasonally high in order to attract consumers to the store. Once they are inside, it is convenient for consumers to buy more than one product since they are making use of economies of scale in the purchase. A future challenge that this study could not undertake because of lack of information is a better identification of the idiosyncratic demand shocks..
(18) 168. REVISTA ABANTE, VOL. 10, Nº 2. REFERENCES AcNielsen (2004). “Cambios en el Mercado Chileno 2004, Entendiendo al Consumidor”. Entrega de índices ACNielsen Chile. Bell D. y J. Feiner (2003). Wal-Mart Neighborhood Markets. Harvard Business School. November 22(9): 503-034. Betancourt, X y Y. Gautschi (1990). “Demand, Complementarities, Households Production and Retail Assortment”. Marketing Science, 9(2): 146-161. Chevalier A., A. Kashyap y P. Rossi (2003). “Why Don’t Prices Rise During Periods of Peak Demand? Evidence from Scanner Data.” The American Economic Review. March 15-37. Ellikson P. (2005). “Does Sutton apply to Supermarkets?” Duke University, August 2005. Lal, R. y C. Matutes (1994), “Retail Pricing and Advertising Strategies”. Journal of Business, 67(3). Lazear, E. (1986). “Retail Pricing and Clearance Sales.” The American Economic Review, 14-32. MacDonald, J. (2000). “Demand, Information and Competition: Why Do Food Prices Fall at Seasonal Demand Peaks?” Journal of Industrial Economics, 48, Issue 1. Pashigian P. y B. Bowen (1991). “Why Are Products Sold on Sale? Explanations of Price Regularities.” Quarterly Journal of Economics, 106: 1015-1038.I Rotemberg J. y G. Saloner (1986). “A Supergame-Theoric Model of Price Wars during Booms.” The American Economic Review, June 1986. Varian, H. (1980). “A Model of Sales”. The American Economic Review, 70: 651-659. Warner E. y R. Barsky (1995). “The Timing and Magnitude of Retail Store Markdowns. Evidence from Weekends and Holidays”. Quarterly Journal of Economics, May..
(19)
Figure
Documento similar
The expansionary monetary policy measures have had a negative impact on net interest margins both via the reduction in interest rates and –less powerfully- the flattening of the
Jointly estimate this entry game with several outcome equations (fees/rates, credit limits) for bank accounts, credit cards and lines of credit. Use simulation methods to
In our sample, 2890 deals were issued by less reputable underwriters (i.e. a weighted syndication underwriting reputation share below the share of the 7 th largest underwriter
We have quantified the influence of climate in the retail through an analysis of some sale variables using Decathlon data for Filomena’s week and the surrounding ones.
Recent observations of the bulge display a gradient of the mean metallicity and of [Ƚ/Fe] with distance from galactic plane.. Bulge regions away from the plane are less
(hundreds of kHz). Resolution problems are directly related to the resulting accuracy of the computation, as it was seen in [18], so 32-bit floating point may not be appropriate
In this paper we will prove that in the case of hyperbolic demand function and concave transport cost, perfect equilibrium yields spatial dispersion, obtaining the minimum profit
To find the customer interest in performing a demand offer -reduction of its forecasted demand in a time pe- riod where prices are high [7]- in short-term markets, the
