A Standardized Index for Assessing Seawater Intrusion in Coastal Aquifers: The SITE Index
16
0
0
Texto completo
(2) may be exacerbated in the near future by the effects of climate change and potential sea level rise (Estrela and Vargas 2012; Estrela et al. 2012; Pérez-Martín et al. 2014). In Europe, seawater intrusion affects almost all Mediterranean coastal aquifers to some degree, particularly those in Spain (Guhl et al. 2006; García-Menédez et al. 2016), Italy (Barrocu 2003; Benini et al. 2016), Greece (Petalas and Lambrakis 2006; Kazakis et al. 2016), and Turkey (Günay 1997; Arslan et al. 2012). Coastal aquifers also show signs of seawater intrusion in countries such as Poland and Finland (EEA 2007). Seawater intrusion is also widespread throughout Africa (Steyl and Dennis 2010), Australia (Werner et al. 2013), Asia (FAO 1997; Liu 2004; Sivsankar et al. 2013; Shi and Jiao 2014), North America (Cardoso 1993; Daessle et al. 2014), and the Caribbean (Morell et al. 1997). In Europe, one of the principal objectives of European Directives 2000/60/CE (EU-WFD 2000) and 2006/118/CE (EU 2006) is to attain good qualitative and quantitative status in water bodies by 2015. As a result, several studies have attempted to define suitable methods that will allow coordinated characterization of water bodies and optimization of groundwater monitoring networks. The effects of marine intrusion on groundwater bodies (GWB) are determined both by intrinsic, such as the type and size of the aquifer, hydraulic parameters and hydrostatic conditions, and extrinsic, such as natural and induced recharge and pumped abstractions, factors. These multiple influences mean that characterization of the intrusion process is a rather complex procedure and only straightforward approaches that use basic criteria are practical on a universal scale. Spatial and temporal assessments of seawater intrusion need to be done on a case-by-case basis, supported by a knowledge of the hydrogeological functioning of the aquifer and data from monitoring networks. The complexity increases if the aim is to assess the reversibility of the intrusion process (viability and requirements) and the synergies that might exist with other salinization processes (such as regional saline flows, mobilization of connate waters, effects of agricultural activities, and discharges). Consequently, there are no canonical scenarios; rather, both the intensity of the intrusion and its temporal and spatial evolution must be studied for each specific case. Nevertheless, to ensure that the methodology can be used to make global assessments and to establish reference scales, we need an index that defines the state of the intrusion, is easy to obtain from common or easily available data, and is capable of delivering realistic and understandable information that allows aquifer classification. Additionally, a universally applicable seawater intrusion index must provide a simple overview of the principal characteristics of the salinization processes. Therefore, the index must offer qualitative and quantitative information about the spatial impact, intensity, temporal trends, and probable evolution of seawater intrusion over the medium- to long-term. Results must be comprehensive, unequivocal, and descriptive, so that differences between aquifers can be distinguished. In this paper, we propose an index of seawater intrusion that takes all these conditions into account and uses easy-to-obtain data from monitoring networks, namely chloride concentrations. Application of this method provides relevant information about the degree of seawater intrusion in coastal systems and its historical trends. Further, it facilitates comparisons between different aquifers.. 2.
(3) 2. Current state of indicator development for seawater intrusion Numerous indices of seawater intrusion that vary in complexity and success have been proposed. Most of these indices are based on physico-chemical parameters, and, in particular, on the chloride ion, which is considered the most reliable element for identifying and describing the seawater intrusion process. While chloride is a very useful indicator, additional properties might also be considered, such as ion ratios (hydrogeochemical indices) and morphological and/or piezometric data. Total dissolved solids (TDS), an indicator of the salinity and general groundwater quality, has been proposed by some authors (Voudouris et al. 2004) as a useful indicator of the distribution of seawater intrusion. Inclusion of TDS however have two main disadvantages, i.e., information about all the major ions is needed to calculate TDS and other salinization processes may be involved. Voudoruis et al. (2004) used the geographical distribution of the ionic strength to establish the zone of impact of the intrusion process. Because of its non-reactive properties, the chloride ion can be used to calculate the percentage of seawater in coastal aquifers, and the evolution of chloride concentrations is an ideal indicator of marine intrusion. Normally, the natural background concentrations of chloride in coastal aquifers is low (in the order of 50–150 mg/L) and, in the absence of occasional natural or anthropic processes, this component derives exclusively from sea spray and evapotranspiration of rainwater. Murillo and Navarro (1991) proposed the Itemized Index of Marine Intrusion (IPI), which discretized the aquifer and assigned a weight to each of the cells as a function of their chloride concentrations. The index values are between zero and ten, where zero and ten correspond to freshwater and seawater, respectively. Other methods take into account the chloride content and the relationship between recharge and pumping system to determine the extent seawater intrusion and the good quantitative status of aquifers (CHJ, 2015). 2+. 2+. The ionic ratios most commonly used for evaluating the status of marine intrusion are Mg /Ca , 2−. +. Cl−/HCO3−, SO4 /Cl−, and Na /Cl−. These ions are involved in rock-water interaction processes, such as cation exchange, redox reactions, and precipitation-dissolution of carbonates. While minor ion 2+. ratios (Br−/Cl−, I−/Cl−, and Sr /Cl−) also provide useful information, data are not commonly available. The Br−/Cl− (or Cl−/Br−) ratio has been most often used to identify the origin of salinity (Morell 1985; Custodio and Alcalá-García 2003; Voudouris et al. 2004; Mandilaras et al. 2007). Kazakis et al. (2016) developed a GIS-based method that used ionic ratios to identify the areas affected by seawater intrusion. Over the last few years, various attempts have been made to apply new hydrogeochemical indices 10. 11. that are analytically complex and demanding. One such index is the B /B. isotope ratio, which can. discriminate the origin of salinity and evaluate mixing processes. It is not really an index, but rather a parameter that gives a better understanding of the hydrogeochemical features in aquifers that are influenced by marine intrusion (Giménez and Morell 1997; Morell et al. 2008). Edet and Okereke (2001) proposed a semiquantitative assessment index of marine intrusion using five monitored parameters, namely density, TDS, sodium and chloride concentrations, and the Br−/Cl− ratio, and classified the aquifers into three classes according to the intensity of the intrusion.. 3.
(4) Finally, a number of indices have been developed from vulnerability maps (Werner et al. 2012).. 3. Methodology The method highlights the need to illustrate the current status of seawater intrusion in a hydrogeological system by providing information about its spatial distribution, degree of impact, and evolution over time, all of which are important indicators of the intrinsic vulnerability of the aquifer and its capacity for recovery. The SITE index is based on commonly-available and easy-to-obtain data and its objective is to characterize the intrusion process in a way that is straightforward to calculate and interpret. The index provides an assessment of the general state of the aquifer that facilitates comparison with other aquifers. The method, based on the chloride ion concentrations in groundwater at different points in the aquifer over time, generates numeric and alphanumeric results that allow qualitative and quantitative discrimination between the water quality states of different aquifers. The SITE method characterizes spatial and temporal intrusion of seawater from four perspectives, namely the surface area affected, intensity, seasonal variation, and medium- to long-term trends of water quality. The acronym SITE derives from these parameters as follows: S = Surface area affected I = Intensity of salinization T = Temporality or seasonality E = Evolution over the medium- to long-term. 3.1. Conceptual simplifications and definitions Seawater intrusion is a very complex heterogeneous and three-dimensional process (Werner et al. 2013; Pratheepa et al. 2015) with spatial and temporal variations in groundwater quality. To be truly useful, concepts in the SITE index are simplified and a basic model is assumed: two water types (fresh and seawater) are mixing inside homogeneous aquifers and the method ignores the depth variable. This substantial simplification are justified because (a) high hydrodynamic anisotropy commonly occurs in aquifers; (b) there is lack of information about the construction characteristics of the wells and boreholes and of penetration through the transmissive horizons (lithological columns); (c) different hydraulic heads that generate ascending and descending flows in the boreholes and (d) there is limited water quality data. As a result, it is very difficult, both in terms of effort and cost, to define the saline wedge and to assign a reliable value of salinity to different depths (Guhl et al. 2006). Indexes that consider variations in depth are enormously complicated and expensive, and cannot be applied universally but can only be used at a few well-studied sites for which very detailed information is available. Furthermore, tests on the four aquifers where the SITE model was developed confirmed that the results do not differ considerably from those indexes that included three-dimensional salinity data. Seven concepts are used in the SITE index: total surface (St), potentially affected distance (Dpa), potentially affected surface (Spa), reference value (Vr), surface affected (Sa), current situation (Sc), and preceding situation (Sp).. 4.
(5) 2. The total surface (St) of the aquifer, expressed in km , is one of the index inputs. Application of the index to the whole aquifer surface may result in distorted results for large aquifers or elongated aquifers that are perpendicular to the coastline. Intrusion in aquifers is restricted to a certain distance from the sea, known as the potentially affected distance (Dpa), because of factors that impede its movement inland, such as the elevation of an impermeable basement, or the dimensions and geometry of the system itself. Therefore, the SITE index only considers the area that is potentially affected by seawater intrusion, named potentially affected surface (Spa). This area is derived from the Dpa, and can be determined in very well-known aquifers. To standardize the results, where there is insufficient data, the Dpa is fixed at 10 km from the coastline The reference value (Vr) is defined as the chloride concentration above which the groundwater is considered to be that is influenced by seawater intrusion, and it is used to identify the affected surface (Sa) of the aquifer by this process. Vr is the geochemical natural background chloride concentration in the aquifer. This background value is difficult to determine because it is related to several complex natural (surface water infiltration, evaporation from shallow aquifers, quality of feed flows from adjacent aquifers or lixiviation from saline formations) and induced (recirculation of irrigation water or pollution processes) hydrological mechanisms. For simplification purposes, we have suggested two approaches, namely (i) to use the geochemical background as the reference value in cases where it can be determined easily with a high degree of certainty, or (ii) to use a chloride value of 250 mg/L, which is the threshold limit for water human consumption in many countries. Defining the current state of intrusion in a coastal aquifer can also be quite complex, because of spatial and temporal variabilities in the chloride concentrations caused by natural and anthropogenic processes. In the SITE method the current situation (Cs) is defined for the last four years, to minimize the influence of dry and humid years, and calculations include the mean of the annual values for each point over that four-year period. If there are no current data, the aquifer state will be calculated for the last four years with available data, and will be expressly referenced to this date. The preceding situation (Ps) is determined as the Cs, but is based on the four-year period prior to the current situation.. 3.2. Initial conditions: Data requirements The chloride ion (mg/L) is the only data used in the SITE index. This data is routinely measured in monitoring networks in countries with problems of seawater intrusion. Ideally, there should be two measurements per year that coincide with high and low piezometric periods. The data matrix constructed should be as homogeneous in space and time. Occasional missing data points can be estimated from the mean of the preceding and following values, based on the assumption that variation in salinity is gradual. The base matrix is then used to derive the data matrices for each of the SITE parameters.. 3.3. SITE parameters. 5.
(6) This section describes how each of the four parameters of the index is calculated.. 3.3.1 Surface affected (S) The parameter S is defined as the surface area of the system where groundwater chloride exceeds the Vr, and is the extent of the surface area of the aquifer that is impacted by seawater intrusion, independent of its intensity. The S parameter is calculated by constructing a map of isochloride for the current situation (last four years). Where the geochemical background level is not defined, the default value (250 mg/L) is used. Isolines corresponding to 1Vr, 2Vr, 4Vr, and 8Vr are determined, and are used to calculate the next parameter. Additional values of Vr can be established beyond the 8Vr mg/L isoline. Thus, S is given by:. S=. Sa St. [1]. where St is the total surface area of the aquifer, or potentially affected surface (Spa) if that is the case, and Sa is the surface area where chlorides exceed the reference value. The values of S are divided into different ranges and a number or alphanumeric type-code is assigned to each one, which corresponds to five aquifer states (Table 1).. 3.3.2 Intensity of the intrusion (I) The Intensity (I) parameter is designed to reflect the average salinity of the surface area of the aquifer above the Vr in the current situation. The parameter is derived from the map of the chloride content (drawn to determinate the S parameter). The area between adjacent isolines (Si) is calculated and is assigned the mean value of the two isolines (Cli). By convention, the value assigned to the surface area above the highest isoline is the value of this isoline plus the difference between this isoline and one below it. The I parameter is calculated as follows:. I ( mg / L ) =. ΣS i ( >Vr )Cli ( >Vr ) Sa. [2]. 2. where Si is the surface area in km between isoline i (with a value equal to or greater than Vr) and the one immediately above it, Cli is the mean chloride concentration (mg/L) assigned to each area, and Sa is the surface area for which the chloride concentrations exceed the Vr. A numeric code and an alphabetical type-code are assigned to each range of values according to the intensity of the intrusion, and five categories are stabilized (Table 1).. 3.3.3 Temporality or seasonality (T) The dynamic of groundwater can generate a certain sequentiality or seasonality in the chloride ion concentration of coastal aquifers, and are denoted in this study as temporality (T). In addition to external factors (recharge and discharge of system), the amplitude and relative importance of the seasonal variations will depend on their hydraulic features, which will influence its capacity to respond to external pressures. Temporality does highlight the system's inertia and resilience, and its propensity for recovering its original water quality. Small values show high inertia and resilience to intrusion,. 6.
(7) where recovery of water quality will be very difficult. In contrast, high values imply low inertia, which indicates a greater facility for intrusion but a greater potential for recovery of water quality. To calculate this parameter, two samples per year are needed for each monitoring well from the seasons with best and worst water quality. Temporal continuity of the data is not strictly necessary. With these data, two time series of salinity, one of annual maximum values and another of minimum annual chloride contents, can be made. The parameter T is calculated by average difference between the two data series as follow:. 1 n ∑ ( f ( x) max − f ( x) min ) n x =1 [3] T ( mg / L ) = f max where. f ( x ) max is the annual maximum value, f ( x ) min is the annual minimum value, and f max. is the average maximum value. If only one sample is available per year, the parameter T is calculated from the standard deviation of the time series, named T0, as follows:. 1 n ∑ f ( x) − f n x =1 T0 (mg / L) = f. [4]. where f (x ) is the mean chloride concentration for a particular year, and. f is the mean of the whole. series. Logically, it is necessary to apply a correction factor that was determined empirically from the four aquifers where the SITE method was applied (two years of data available). For these aquifers, T was calculated from the two series (maximum and minimum) while T0 was calculated from a single series. As a result T0 is attenuated and is smaller than that obtained using the two separate time series. The correlation between the two results was 1.25. Thus:. T (mg / L) = 1.25 * T0. [5]. The parameter T is differentiated into five categories according to the magnitude of the fluctuations in the chloride concentrations to which numeric and alphanumeric codes are assigned (Table 1).. 3.3.4 Evolution (E) The parameter E is used to classify the current trend of the intrusion, and three categories are differentiated: stable, in progress or decreasing intrusion. The calculation begins with the time series of the mean annual chloride concentration across the total surface of the aquifer (St), or surface aquifer corrected where appropriate (Spa). The first step is to determine the current situation (last four years) and then to determine the preceding situation (prior four years). E parameter is calculated with the expression:. 7.
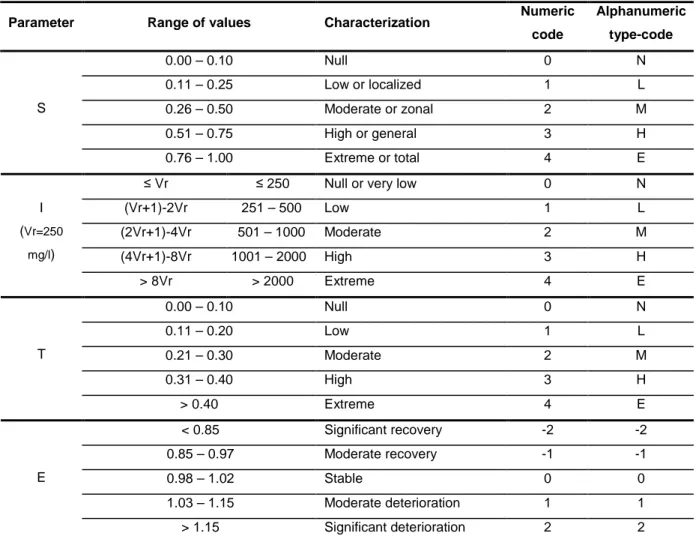
(8) E=. C ln C ln − 1. [6]. where Cln is the mean chloride concentration over the total surface of aquifer at current situation (Cs) (last four years) and Cln-1 is the mean chloride concentration for the preceding situation (Ps) (prior four years). For each range of E, a numeric code is assigned (Table 1).. 3.3.5. Compilation of the SITE index: SITE value and alphanumeric SITE type-code The SITE index can be given as a numeric value (SITE value) and an alphanumeric type-code, which provide specific information about each of the parameters involved in the salinization. The chosen form (one or both together) depends on the purpose for which the index is applied. The numeric values of the S, I, and T parameters are from 0 to 4, where 0 is the best and 4 is the worst. The Parameter E uses a numeric code to describe the temporal behaviour in the system salinity. Positive values indicate increasing intrusion, negative values indicate decreasing intrusion, and zero value indicates no significant variation. The numeric values of the SITE parameters are summarized in Table 1. Table 1 Summary of ranges, characterization, numeric codes and type-codes for each parameter of the SITE method Parameter. S. Range of values. Characterization. Numeric. Alphanumeric. code. type-code. 0.00 – 0.10. Null. 0. N. 0.11 – 0.25. Low or localized. 1. L. 0.26 – 0.50. Moderate or zonal. 2. M. 0.51 – 0.75. High or general. 3. H. 0.76 – 1.00. Extreme or total. 4. E. Null or very low. 0. N. ≤ Vr. ≤ 250. I. (Vr+1)-2Vr. 251 – 500. Low. 1. L. (Vr=250. (2Vr+1)-4Vr. 501 – 1000. Moderate. 2. M. mg/l). (4Vr+1)-8Vr. 1001 – 2000. High. 3. H. Extreme. 4. E. 0.00 – 0.10. Null. 0. N. 0.11 – 0.20. Low. 1. L. 0.21 – 0.30. Moderate. 2. M. 0.31 – 0.40. High. 3. H. > 0.40. Extreme. 4. E. < 0.85. Significant recovery. -2. -2. 0.85 – 0.97. Moderate recovery. -1. -1. 0.98 – 1.02. Stable. 0. 0. 1.03 – 1.15. Moderate deterioration. 1. 1. > 1.15. Significant deterioration. 2. 2. > 8Vr. T. E. > 2000. 8.
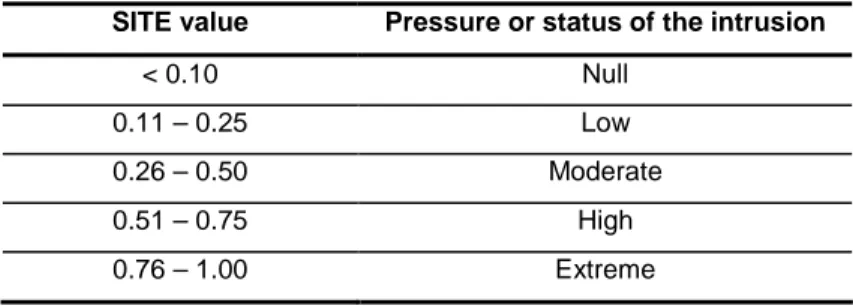
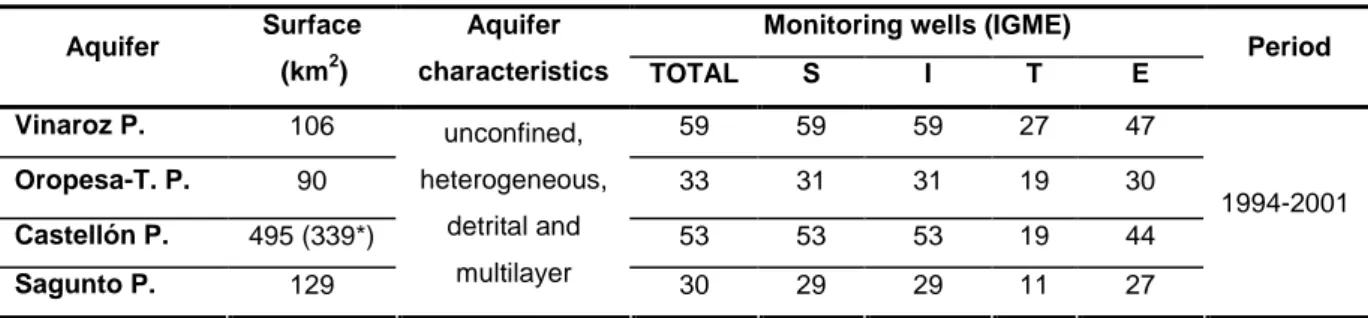
(9) The SITE value is calculated, after weighting each parameter, as follows:. SITEvalue =. 3 S + 3( S / 4 ) I + T + E 30. [7]. A quotient of 30 is the maximum possible value of the algorithm for the numerator, and gives a numeric SITE code of 1 for a completely salinized aquifer. The alphanumeric SITE type-code is compiled by writing the type-codes of all four parameters together. The codes for the S, I, and T parameters are N (Null), L (Low), M (Moderate), H (High), and E (Extreme). The E code is the same as its numerical value. In this way, the most favourable aquifer status is described by the code NNN2, whilst the most unfavourable situation is described by the code EEE2. Different ranges of the SITE index are defined to describe the status of seawater intrusion and the degree of pressure it exerts on the aquifer (Table 2). Table 2 Intrusion status or pressure exerted by seawater intrusion SITE value. Pressure or status of the intrusion. < 0.10. Null. 0.11 – 0.25. Low. 0.26 – 0.50. Moderate. 0.51 – 0.75. High. 0.76 – 1.00. Extreme. Finally, the SITE index is combined with the alphanumeric SITE type-code and the SITE value. For example, a SITE index equal to MML1(0.37) indicates an aquifer with zonal intrusion (M) of moderate intensity (M), low seasonality (L) and moderate increase in salinity (1). The general assessment shows a moderate pressure on the aquifer because of marine intrusion (0.37). The low seasonality points to an aquifer with high inertia that would be quite difficult to remediate.. 4. Application of the SITE index The SITE index has been calculated for four coastal GWBs in eastern Spain: Vinaroz Plain, OropesaTorreblanca Plain, Castellón Plain and Sagunto Plain (Figure 1). They are unconfined, heterogeneous, detrital and multilayer aquifers composed of gravel and sand levels in a silty clay matrix, with high pumping volume and seawater intrusion processes of different entity. The number and situation of monitoring wells used is set out in figure 1 and table 3.. 9.
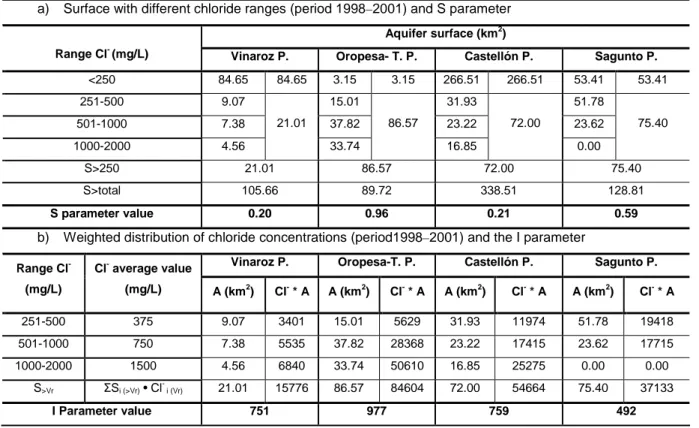
(10) Fig. 1. Location of the aquifers Table 3 Aquifer characteristics and number of monitoring wells used to calculate the SITE index parameter Aquifer. Surface 2. Aquifer. Monitoring wells (IGME). Period. (km ). characteristics. TOTAL. S. I. T. E. Vinaroz P.. 106. unconfined,. 59. 59. 59. 27. 47. Oropesa-T. P.. 90. heterogeneous,. 33. 31. 31. 19. 30. Castellón P.. 495 (339*). detrital and. 53. 53. 53. 19. 44. Sagunto P.. 129. multilayer. 30. 29. 29. 11. 27. 1994-2001. (*) Spa: potentially affected surface. The chloride concentration data was provided by the Geological Survey of Spain (IGME) quality monitoring network, which operated from 1972 to 2001 (Table 3). There are no data beyond 2001, so the S value was calculated for 1998–2001, which was the most recent four-year period with available chloride concentration data. An isochloride map was constructed from the mean value of each point over this period with isolines corresponding to 250 (Vr), 500 (2Vr), 1000 (4Vr), and 2000 (8Vr) mg/L (Figure 2). A surface correction had to be applied to the Castellón Plain because the hydrogeological system extends quite far inland. The index considers only the coastal zone up to 10 km from the coast. Application of this condition involves that the potentially affected surface (Sc) is only 338.51 km. 2. (Table 3). The S parameter (Table 4) was calculated from the maps of mean isochloride concentrations for the most recent period (1998–2001) (Figure 2), and the I parameter (Table 4) was defined from the surface above of reference value (Vr=250 mg/L). The T parameter (Table 5) was determined for mean. 10.
(11) annual minimum and maximum chloride concentrations. The E parameter (Table 5) was settled down from the quotient of the mean chloride content for the most recent situation (1998–2001) and the preceding situation (1994–1997). Table 4 Calculation of parameters S and I. a) Surfaces with different chloride ranges (1998–2001) and S parameter. b) Weighted distribution of chloride concentrations (1998–2001) and I parameter a). Surface with different chloride ranges (period 1998–2001) and S parameter Aquifer surface (km2) -. Range Cl (mg/L). Vinaroz P.. <250. 84.65. 251-500. 9.07. 501-1000. 7.38. 1000-2000. 4.56. 84.65. Oropesa- T. P. 3.15. 3.15. Castellón P. 266.51. 15.01 21.01. 266.51. 31.93 86.57. 37.82. 53.41. 53.41. 51.78 72.00. 23.22. 33.74. Sagunto P.. 16.85. 75.40. 23.62 0.00. S>250. 21.01. 86.57. 72.00. 75.40. S>total. 105.66. 89.72. 338.51. 128.81. S parameter value. 0.20. 0.96. 0.21. 0.59. b). Weighted distribution of chloride concentrations (period1998–2001) and the I parameter Vinaroz P.. Oropesa-T. P.. Range Cl-. Cl- average value. (mg/L). (mg/L). A (km2). Cl- * A. A (km2). Cl- * A. Castellón P. A (km2). Cl- * A. Sagunto P. A (km2). Cl- * A. 251-500. 375. 9.07. 3401. 15.01. 5629. 31.93. 11974. 51.78. 19418. 501-1000. 750. 7.38. 5535. 37.82. 28368. 23.22. 17415. 23.62. 17715. 1000-2000. 1500. 4.56. 6840. 33.74. 50610. 16.85. 25275. 0.00. 0.00. 21.01. 15776. 86.57. 84604. 72.00. 54664. 75.40. 37133. S>Vr. ΣSi (>Vr) • Cl. i (Vr). I Parameter value. 751. 977. 759. 492. Table 5 Calculation of parameters T and E Aquifer Maximum annual Cl- (mg/L)) -. Minimum annual Cl (mg/L) -. Vinaroz P.. Oropesa-T. P.. Castellón P.. Sagunto P.. 301. 402. 1014. 479. 241. 316. 793. 382. Difference max./min. Cl (mg/L). 60. 86. 221. 97. T parameter value. 0.20. 0.21. 0.22. 0.20. 323. 882. 352. 295. Period 1998-2001 Cl (mg/L). 335. 895. 392. 321. E parameter value. 1.04. 1.01. 1.11. 1.09. Period 1994-1997 Cl- (mg/L) -. 11.
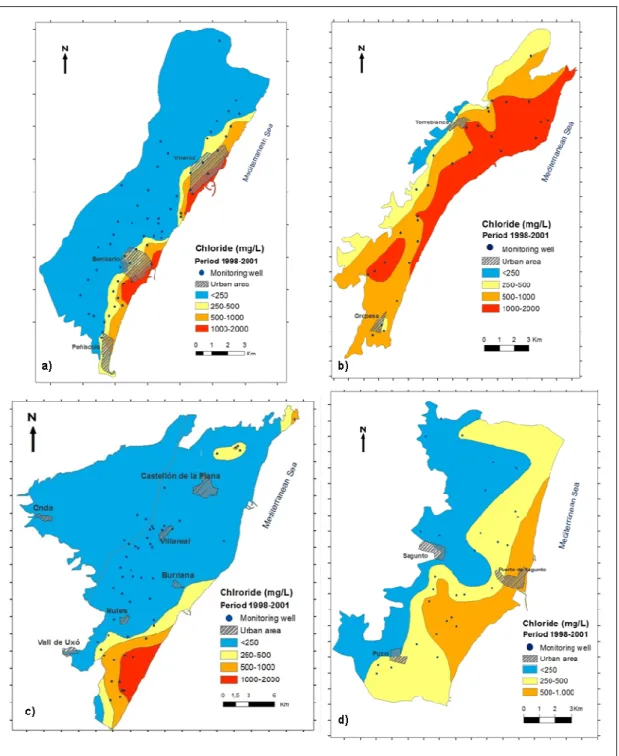
(12) Fig. 2 Chloride concentrations for the last period available (mean of 1998–2001) in the (a) Vinaroz Plain, (b) Oropesa-Torreblanca Plain, (c) Castellón Plain, and (d) Sagunto Plain aquifers. The points indicate the monitoring networks. 5. Results and discussion The numeric values and codes of the SITE index applied to the four unconfined detrital GWBs on the Mediterranean coast of Spain are shown in Table 6. The Vinaroz Plain GWB is described by LML1(0.22), which denotes a LOW pressure from seawater intrusion because it is located, with a moderate intensity, low seasonal variation and moderate increase in chloride concentrations. The SITE index for the Oropesa-Torreblanca Plain, EMM0(0.67), indicates that there is HIGH pressure on. 12.
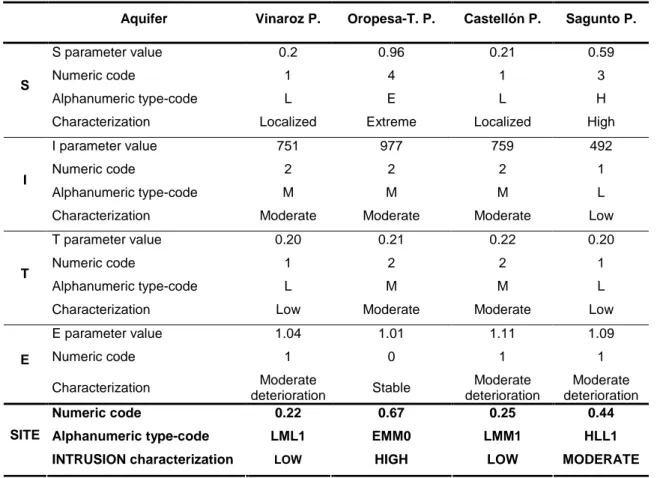
(13) the aquifer because seawater intrusion is total, with moderate intensity, moderate seasonal variation and it is stabilized. The index for the Castellón Plain aquifer is LMM1(0.25), which denotes a LOW pressure because seawater intrusion, but right on the border with MODERATE. It is located, with moderate intensity, moderate seasonal variability and a moderately increasing trend in chloride concentrations. Finally, the SITE index in the Sagunto Plain aquifer is HLL1(0.44), indicating that the pressure caused by seawater intrusion is MODERATE because almost the entire area is subject to seawater intrusion, but it is low intensity, low seasonal variation and a moderately increasing trend in salinity.. Table 6 Codes and characterization of the SITE index Aquifer S parameter value S. I. Castellón P.. Sagunto P.. 0.2. 0.96. 0.21. 0.59. 1. 4. 1. 3. Alphanumeric type-code. L. E. L. H. Characterization. Localized. Extreme. Localized. High. I parameter value. 751. 977. 759. 492. Numeric code. 2. 2. 2. 1. Alphanumeric type-code. M. M. M. L. Moderate. Moderate. Moderate. Low. 0.20. 0.21. 0.22. 0.20. Numeric code. 1. 2. 2. 1. Alphanumeric type-code. L. M. M. L. Characterization. Low. Moderate. Moderate. Low. E parameter value. 1.04. 1.01. 1.11. 1.09. 1. 0. 1. 1. 0.67. Moderate deterioration 0.25. Moderate deterioration 0.44. LML1. EMM0. LMM1. HLL1. LOW. HIGH. LOW. MODERATE. T parameter value. E. Oropesa-T. P.. Numeric code. Characterization. T. Vinaroz P.. Numeric code Characterization Numeric code. SITE Alphanumeric type-code INTRUSION characterization. Moderate deterioration 0.22. Stable. The results of SITE index show that the Oropesa-Torreblanca Plain GWB is subject to most influence from seawater intrusion, with a high impact (0.67). This suggests that it would be very difficult to restore the groundwater quality, and that measures to remediate this aquifer would be more complicated and expensive than for the other tested GWBs. The seawater intrusion into the Sagunto Plain GWB is minor, and considerate as moderate (0.44), because it is low intensity but wide extension. Finally, the GWB of the Vinaroz and Castellón Plains show low impacts as seawater intrusion is confined to specific areas near the coast and the water quality in the rest of these systems is acceptable. However, in the case of Castellon Plan GWB the pressure is in the edge to be moderate (0.25), because both intensity and extension of seawater intrusion is greater than Vinaroz Plain (0.22). The SITE index indicates that it will be easier, less expensive, and more practical to restore the. 13.
(14) groundwater quality in the Vinaroz and Castellón Plains than in the first two aquifers, because actions can be limited to small areas of the aquifer. However, the SITE index highlights that seawater intrusion was increasing at a moderate rate in the Sagunto Plain, Castellón Plain, and Vinaroz Plain GWBs, so it will be necessary to design measures to correct these trends to prevent further deterioration of their groundwater. Additionally, the results of T parameter for the four aquifers (0.1-0.2) show that they have similar hydrogeological characteristics (unconfined, heterogeneous, detrital, and multilayer), which indicates that it may be difficult to restore their water quality because of inertia and resilience of the salinity.. 6. Conclusions We have demonstrated that this method is easy to derive and can be used to summarize the main features of the seawater intrusion process in coastal aquifers in an objective manner. It offers key information that can be used to assess the overall current situation of the groundwater body and the evolution of the seawater intrusion over time. These features mean that the SITE method can effectively measure compliance with European Directives 2000/60/EC (EU-WFD, 2000) and 2006/118/EC (EU, 2006), whose aims are to achieve good quality and quantity in groundwater bodies. The status of groundwater bodies is described in a standardized and objective way, thereby facilitating comparison between different groundwater bodies, so that priorities for actions can be established. The index also supports the identification of the most suitable recovery strategy, and so facilitates optimal use of available human and economic resources. In addition, it provides an objective assessment of the problems in each aquifer, which can then be used to improve groundwater management.. REFERENCES Arslan H, Cemek B, Demir Y (2012) Determination of seawater intrusion via hydrochemicals and isotopes. in. Bafra. plain,. Turkey. Water. Resources. Management 26(13):3907-3922.. doi:10.1007/s11269-012-0112-3 Barrocu G (2003) Seawater intrusion in coastal aquifers in Italy. Coastal Aquifers Intrusion Technology: Mediterranean Countries. IGME (ed). ISBN:84-7840-470-8 Benini L, Antonellini M, Laghi L (2016) Assessment of water resources availability and groundwater salinization in future climate and land use change scenarios: A case study from a coastal drainage basin in Italy. Water Resources Management 30:731-745. doi:10.1007/s11269-015-1187-4 Cardoso PR (1993) Saline water intrusion in Mexico. In: Transactions on ecology and the environment, vol 2. WIT, Southampton, UK. doi:10.2495/WP930051 CHJ (2016) (Júcar Water Agency) Júcar River Basin Plan. Demarcación hidrográfica del Júcar. Confederación Hidrográfica del Júcar. Ministry of Agriculture, Food and Environment, Spain. Custodio E, Alcalá-García FJ (2003) El potencial de la relación Cl/Br como indicador del origen de la salinidad de los acuíferos costeros españoles. Coastal aquifers intrusion technology: Mediterranean Countries. IGME (ed.) pp:401-412. ISBN:84-7840-470-8. 14.
(15) Daessle LW, Pérez-Flores MA, Serrano-Ortiz J (2014) A geochemical and 3D-geometry geophysical survey to assess artificial groundwater recharge potential in the Pacific coast of Baja California, Mexico. Environmental Earth Sciences 71: 3477-3490. doi:10.1007/s12665-013-2737-9 Edet AE, Okereke CS (2001) Monitoring seawater intrusion in the Tertiary-Quaternary aquifer system, Coastal Akwa Ibom area, Southeastern Nigeria-Baseline data. First Int. Conf. Saltwater Intrusion and Coastal Aquifers. Estrela T, Vargas, E (2012) Drought Management Plans in the European Union. The case of Spain. Water Resources Management, 26, pp1537-1553 Estrela T, Pérez-Martin MA, Vargas E (2012) Impacts of climate change on water resources in Spain, Hydrological Sciences Journal 201 doi:10.1080/02626667.2012.702213 European Environment Agency (EEA) (2007) Groundwater overexploitation and saltwater intrusion in Europe. European Union-Water Framework Directive (EU-WFD) (2000) “Directiva 2000/60/CE del Parlamento Europeo y del Consejo de 23 de Octubre de 2000”. Diario Oficial de las Comunidades Europeas de 22/12/2000. L 327/1-327/32 European Union (EU) (2006) “Directiva 2006/118/CE del Parlamento Europeo y del Consejo de 12 de Diciembre de 2006”. Diario Oficial de las Comunidades Europeas de 27/12/2006. L 327/19-327/31 FAO (1997) Seawater intrusion in coastal aquifers. Guidelines for study, monitoring and control. 153 pp. ISBN: 92-5-103986-0 García O. Morell I. Ballesteros BJ; Renau-Pruñonosa A, Esteller MV (2016) Spatial characterization of the seawater upconing process in a coastal Mediterranean aquifer (Plana de Castellón, Spain): evolution and controls. Environmental Earth Sci 75:728. doi:10.1007/s12665-016-5531-7 Giménez E, Morell I (1997) Hydrogeochemical analysis of salinization processes in the coastal aquifer of Oropesa (Castellón, Spain). Environmental Geology 29:118-131 Guhl F, Pulido-Bosch A, Pulido-Leboeuf P, Gisbert J, Sánchez-Martos F, Vallejos A (2006) Geometry and dynamics of the freshwater-seawater interface in a coastal aquifer in Southeastern Spain. Hydrological Sciences Journal 51(3):543 -555. doi:10.1623/hysj.51.3.543 Günay G (1997) Solutions of seawater intrusion problems in Turkey. Chap. 15 of Seawater intrusion in coastal aquifers. Guidelines for study, monitoring and control. FAO. 153 pp. ISBN:92-5-103986-0 Kazakis N, Pavlou A, Vargemezis G, Voudouris KS, Soulios G, Pliakas F, Tsokas G (2016) Seawater intrusion mapping using electrical resistivity tomography and hydrochemical data. An application in the coastal area of eastern Thermaikos Gulf, Greece. Science of the Total Environment 543:373-387. doi:10.1016/j.scitotenv.2015.11.041 Liu D (2004) The situation and analysis of salinity intrusion in coastal areas, China. Journal of Geological Hazards and Enviroment Preservation. doi:10.1007/s12665-014-3186-9 Mandilaras D, Lambrakis N, Stamatis G (2007). The role of bromide and iodide ions in the salinization mapping of the aquifer of Glafkos rives basin (northwest Achaia, Greece). Hydrological Processes, 22(5):611-622. doi:10.1002/hyp.6627. 15.
(16) Morell I (1985) Caracterización hidrogeoquímica de la intrusión marina de la Plana OropesaTorreblanca (Prov. Castellón). PhD Thesis. Morell I, Giménez E, Fagundo JR, Pulido-Bosch A, López-Chicano M, Calvache ML, Rodríguez JE (1997) Hydrochemistry and Karstification in the Cienaga de Zapata aquifer (Matanzas, Cuba). In: Karst Waters & Environmental Impacts, Günay & Johnson (eds), Balkema, Rotterdam:191-198 pp. Morell I, Pulido-Bosch A, Sánchez-Martos F, Vallejos A, Daniele L, Molina L, Calaforra JM, Roig AF, Renau-Llorens A (2008) Characterization of the salinization processes in aquifers using boron isotopes. Application to south-eastern Spain. Water, Air, Soil Pollution 187: 65 -80. doi: 10.1007/s11270-007-9497-7 Murillo JM, Navarro JA (1991) Modelo para el cálculo de un índice del estado de intrusión de un acuífero costero. Aplicación a la Plana de Castellón. IGME (ed) Pérez-Martín MA, Estrela T, Andreu J, Ferrer J (2014) Modeling Water Resources and River-Aquifer Interaction in the Júcar River Basin, Spain. Water Resources Management 28:4337-4358 doi:10.1007/s11269-014-0755-3 Petalas C, Lambrakis N (2006) Simulation of intense salinization phenomena in coastal aquifers of Thrace. Journal of Hydrology, 324:51-64. doi:10.1016/j.hjydrol.2005.09.031 Pratheepa V, Ramesh S, Sukumaran N, Murugesan AG (2015) Identification of the sources for groundwater salinization in the coastal aquifers of Southern Tamil Nadu, India. Environ Earth Sci. 74:2819-2829. doi:10.1007/s12665-015-4303-0 Renau-Pruñonosa A, Morell I, Pulido D (2014) Ecological Remediation Volume (ERV) in Coastal Aquifers Affected by Seawater Intrusion. Methodology and Application in the Oropesa-Torreblanca Plain (Spain). Mathematics of Planet Earth (2193-8571) 521 pp.doi:10.1007/978-3-642-32408-6_114 Shi L, Jiao JJ (2014) Seawater intrusion and coastal aquifer management in China: a review. Environmental Earth Science 71: 2811-2819. Doi:10.1007/s12665-014-3186-9 Sivsankar V, Ramachandramoorthy T, Senthil K (2013) Deterioration of coastal groundwater quality in Rameswaram Island of Ramanathapuram District, Southern India. Journal of Water Chemistry andtechnology 35:91-98. ISSN 1063455X Steyl G, Dennis I (2010) Review of coastal-area aquifers in Africa. Hydrogeology Journal, 18:217-225. doi:10.1007/s10040-009-0545-9. Vallejos A, Sola F, Pulido-bosch A (2015) Processes influencing groundwater level and the freshwater-saltwater interface in a coastal aquifer. Water Resources Management 29(3):679697.doi:org/10.1007/s11269-014-0621-3 Voudouris K, Mandilaras D, Antonakos A (2004) Methods to define the surface distribution of the SALT intrusion zone. 18th SWIM. Werner AD, Ward JD, Morgan LK, Simmons CT, Robinson NI, Teubner MD (2012). Vulnerability indicators of sea water intrusion. Ground Water 50 (1):48-58 Werner AD, Bakker M, Post VEA, Vanderboede A, Lu CH, Ataie-Ashtiani B, Simmons CT, Barry DA (2013) Seawater intrusion processes, investigation and management. Recent advances and futures challenges. Advances in Water Resources 51:3-26. doi:10.1016/j.advwatres.2012.03.004. 16.
(17)
Figure
+3
Documento similar