and sharing with colleagues.
Other uses, including reproduction and distribution, or selling or
licensing copies, or posting to personal, institutional or third party
websites are prohibited.
In most cases authors are permitted to post their version of the
article (e.g. in Word or Tex form) to their personal website or
institutional repository. Authors requiring further information
regarding Elsevier’s archiving and manuscript policies are
encouraged to visit:
Relation of resistin levels with cardiovascular risk factors,
insulin resistance and inflammation in naı¨ve diabetes
obese patients
D.A. de Luis
*
, M. Gonzalez Sagrado, R. Conde, R. Aller, O. Izaola, B. de la Fuente,
J.L. Perez Castrillo´n, E. Romero
Institute of Endocrinology and Nutrition, Medicine School and Unit of Investigation, Hospital Rio Hortega, RD-056/0013 RETICEF, University of Valladolid, C/Los Perales 16, Simancas 47130, Valladolid, Spain
1.
Introduction
Obesity and insulin resistance are associated with inflamma-tory markers and adipocytokines[1]. Obesity is characterized by a low grade systemic inflammation. The incidence of obesity and diabetes mellitus is dramatically increasing worldwide. Epidemiological evidence of this rising tide of obesity and associated pathologies has led to a dramatic increase of research on the role of adipose tissue as an active participant in controlling the body’s physiologic and patho-logic processes[2].
Adipocytokines are proteins produced mainly by adipose tissue[3]. The current view of adipose tissue is that of an active secretory organ of adipocytokines, sending out and respond-ing to signals that modulate appetite, insulin sensitivity, energy expenditure, inflammation and immunity. These molecules have been shown to be involved in the pathogenesis of the metabolic syndrome.
Resistin is a 12.5 kDa, cysteine-rich protein identified by screening for the genes that are induced during the differ-entiation of the adipocytes. Resistin is a dimeric protein that received its name from its apparent induction of insulin
a r t i c l e
i n f o
Article history:
Received 13 February 2010 Received in revised form 25 March 2010
Accepted 30 March 2010 Published on line 21 April 2010
Keywords:
Cardiovascular risk factors Diabetes mellitus
Inflammation Obesity Resistin
a b s t r a c t
Background: The aim of the present study was to explore the relationship of resistin levels
with cardiovascular risk factors, insulin resistance and inflammation in naı¨ve diabetic patients.
Subjects:A population of 66 naı¨ve diabetic patients with obesity was analyzed. A complete
nutritional and biochemical evaluation was performed.
Results: The mean age 56.911.6 years and the mean BMI was 37.86.3. Patients were
divided in two groups by median resistin value (3.3 ng/ml), group I (patients with the low values, average value 2.50.5) and group II (patients with the high values, average value 4.81.8). Patients in the group I had lower waist circumference, total cholesterol, LDL-cholesterol and C-reactive protein than patients in group II. Correlation analysis showed a significant correlation among resistin levels and the independent variables; BMI (r= 0.26; p<0.05), waist circumference (r= 0.38;p<0.05), fat mass (r= 0.28;p<0.05), LDL-cholesterol (r= 0.3;p<0.05), C-reactive protein (r= 0.28;p<0.05). In the multivariate analysis, resistin concentration increase 0.024 ng/ml (CI 95%: 0.006–0.42) for each mg/dl of C-reactive protein.
Conclusion: Circulating resistins are associated with C-reactive protein in an independent
way in naı¨ve diabetic patients.
#2010 Elsevier Ireland Ltd. All rights reserved.
*Corresponding author.
E-mail address:[email protected](D.A. de Luis).
C o n t e n t s l i s t s a v a i l a b l e a t S c i e n c e D i r e c t
Diabetes Research
and Clinical Practice
j o u r n a l h o m e p a g e : w w w . e l s e v i e r . c o m / l o c a t e / d i a b r e s
resistance in mice. It belongs to the FIZZ (found in inflam-matory zones) family. As noted above, it has been postulated that resistin mediates insulin resistance, but this role may be limited to rodents. Initial enthusiasm for this theory, which provides a direct link between adiposity and insulin resistance
[4], was quickly quenched by contradictory findings in both mice and humans. Its effects on insulin action have been extensively investigated in mice [5,6], where resistin is involved in lipid metabolism and hepatic glucose [7] and appears to be a major determinant of hepatic insulin resistance induced by high-fat diet[8]. In humans, data on the role of this adipocytokine in insulin sensitivity and obesity are controversial. Some authors indicated that increased serum resistin levels are associated with increased obesity, visceral fat[9]and type 2 diabetes [10], while other groups failed to observe such correlations[11]. New data suggest that hyperresistinemia would contribute to the pathogenesis of hypertension in patients with diabetes mellitus [12] and albuminuria in hypertensive adults[13].
The aim of the present study was to explore the relation-ship of resistin levels with cardiovascular risk factors, insulin resistance and inflammation in naı¨ve diabetic patients.
2.
Subjects and methods
2.1. Subjects
A population of 66 naı¨ve diabetic patients with obesity (BMI>30) was analyzed in a prospective way and enrolled in a consecutive population way. These patients signed informed consent and the protocol was approved by the local ethical committee.
2.2. Procedure
Weight, blood pressure, basal glucose, insulin resistance, HbA1c, C-reactive protein (CRP), insulin, total cholesterol, LDL-cholesterol, HDL-LDL-cholesterol, triglycerides blood and resistin levels were measured in fasting condition. Inclusion criteria were; obesity (BMI>30) and diabetes mellitus (fasting basal glucose>126 mg/dl) treated only with diet in the last year. Exclusion criteria included active infectious disease, total cholesterol>300 mg/dl, triglycerides>400 mg/dl, blood pres-sure>140/90 mmHg, as well as the use of sulphonylurea, thiazolidinedionas, insulin, glucocorticoids, antineoplastic agents, angiotensin receptor blocker, angiotensin converting enzyme inhibitors, and psychoactive medications.
2.3. Assays
Serum total cholesterol and triglyceride concentrations were determined by enzymatic colorimetric assay (Technicon Instruments, Ltd., New York, NY, USA), while HDL-cholesterol was determined enzymatically in the supernatant after precipitation of other lipoproteins with dextran sulphate– magnesium. LDL-cholesterol was calculated using Friedewald formula. Plasma glucose levels were determined by using an automated glucose oxidase method (Glucose analyser 2, Beckman Instruments, Fullerton, CA). Insulin was measured
by enzymatic colorimetry (Insulin, WAKO Pure-Chemical Industries, Osaka, Japan) and the homeostasis model assessment for insulin sensitivity (HOMA) was calculated using these values [14]. Hemoglobin A1c levels were measured by using high-pressure liquid chromatography (HPLC, Menarini, It).
CRP was measured by immunoturbimetry (Roche Diag-nostics GmbH, Mannheim, Germany), analytical sensitivity 0.5 mg/dl. Resistin was measured by ELISA (Biovendor Labora-tory, Inc., Brno, Czech Republic) with a sensitivity of 0.2 ng/ml with a normal range of 4–12 ng/ml.
2.4. Anthropometric measurements
Body weight was measured to an accuracy of 0.1 kg and body mass index computed as body weight/(height2). Waist (narrowest diameter between xiphoid process and iliac crest) and hip (widest diameter over greater trochanters) circumfer-ences to derive waist-to-hip ratio (WHR) were measured, too. Tetrapolar body electrical bioimpedance was used to deter-mine body composition[15](EFG, Akern, Italy) and applied to the skin using adhesive electrodes placed on right-side limbs. Resistance and reactance were used to calculate total body water, fat and fat-free mass. Anthropometric measurements showed an average waist circumference (119.910.6 cm), waist-to-hip ratio (0.950.07), and average weight (96.117.4 kg). Tetrapolar body electrical bioimpedance showed the next data; fat-free mass (53.515.6 kg) and fat mass (41.515.3 kg). Serial assessment of nutritional intake with 3 days written food records showed a caloric intake of 1615410 kcal/day, a carbohydrate intake of 158.451.2 g/ day, a fat intake of 71.227.6 g/day and a protein intake of 79.320.5 g/day.
Blood pressure was measured twice after a 10 min rest with a random zero mercury sphygmomanometer, and averaged.
2.5. Statistical analysis
The results were expressed as averagestandard deviation. Sample size was calculated to detect a difference of 1 U in HOMA (n= 30 in each group). The distribution of variables was analyzed with Kolmogorov–Smirnov test. Patients were divided in two groups by median resistin value (3.3 ng/ ml)(group I vs II). Quantitative variables with normal distribu-tion were analyzed with a two-tailed paired Student’s-ttest. Non-parametric variables were analyzed with the Friedman and Wilcoxon tests. Qualitative variables were analyzed with the chi-square test, with Yates correction as necessary, and Fisher’s test. Correlation analysis was performed with Pearson and Spearmen tests. A multiple regression model (step by step) was used to study the dependent variable (resistin). Ap-value under 0.05 was considered statistically significant.
3.
Results
3.1. Univariate analysis
The mean age 56.911.6 years and the mean BMI was 37.86.3. Baseline biochemical characteristics of patients
were presented in Table 1, the average of resistin was 3.361.4 ng/ml.
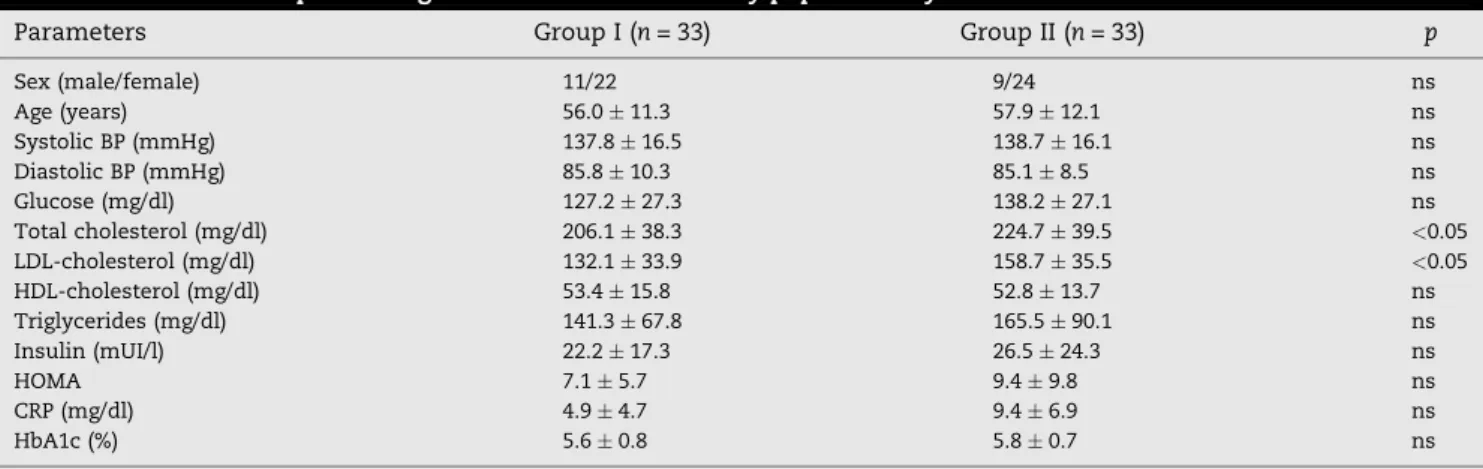
Patients were divided in two groups by median resistin value (3.3 ng/ml), group I (patients with the low values, average value 2.50.5) and group II (patients with the high values, average value 4.81.8). Table 2 shows the statistical differences between both groups in epidemiological and biochemical parameters. Patients in the group I had lower total cholesterol, LDL-cholesterol and C-reactive protein than patients in group II.
Table 3shows dietary intake and anthropometric para-meters. Patients in the group I had lower waist circumference than patients in group II.
Correlation analysis showed a significant correlation among resistin levels and the independent variables; BMI (r= 0.26;p<0.05), waist circumference (r= 0.38;p<0.05), fat mass (r= 0.28;p<0.05), LDL-cholesterol (r= 0.3;p<0.05), C-reactive protein (r= 0.28;p<0.05).
3.2. Multivariate analysis
In the multivariate analysis with age-, weight-, sex-adjusted basalresistin concentration as a dependent variable, only
C-reactive protein remained as an independent predictor in the model (F= 7.3; p<0.05), with a direct correlation. Resistin concentration increase 0.024 ng/ml (CI 95%: 0.006–0.42) for each mg/dl of C-reactive protein.
4.
Discussion
The main finding of this study is that resistin levels are related with C-reactive protein, LDL-cholesterol, fat mass and waist circumference in patients with diabetes mellitus type 2 and obesity. A limitation of our study is the absence of a control group, however the results are interesting in this topic area of investigation.
Initial studies have demonstrated that obesity in mouse and insulin resistance is associated with increased circulating resistin levels[6]. Given the incomplete homology between human and mouse resistin and the absence in humans of one of three murine resistin isoforms, resistin in humans may have a different physiologic role than that in mouse. There is controversial correlation between body weight, adiposity, cardiovascular risk factors and resistin[16], as shown by our data. Some articles, reported that in humans resistin levels
Table 1 – Clinical and epidemiological characteristics of study population.
Parameters n= 66
Age (years) 56.911.6
BMI (kg/m2) 37.86.3
Systolic BP (mmHg) 145.319.3
Diastolic BP (mmHg) 85.118.4
Glucose (mg/dl) 132.727.5
Total cholesterol (mg/dl) 215.439.7
LDL-cholesterol (mg/dl) 143.936.8
HDL-cholesterol (mg/dl) 51.611.6
Triglycerides (mg/dl) 153.293.2
Insulin (mUI/l) 24.320.9
HOMA 8.26.7
CRP (mg/dl) 7.16.8
HbA1c (%) 5.70.85
Resistin 3.361.4
BMI: body mass index. BP: blood pressure. CRP: C-reactive protein.
Table 3 – Dietary intake and anthropometric character-istics by median resistin value.
Parameters Group I
(n= 33)
Group II (n= 33)
p
Energy (kcal/day) 1642438 1585396 ns
CH (g/day) 157.957.2 159.044.1 ns
Fat (g/day) 73.726.7 68.428.9 ns
Protein (g/day) 81.517.2 76.923.9 ns
Weight (kg) 94.816.3 97.518.6 ns
BMI (kg/m2) 36.85.4 38.16.9 ns
Fat-free mass (kg) 54.815.3 52.312.3 ns
Fat mass (kg) 39.314.6 43.615.9 ns
Waist circumference 117.610.5 122.610.7 <0.05 Waist to hip ratio 0.960.07 0.950.06 ns
Group I (patients with the low values of median resistin) and group II (patients with the high values of median resistin). CH: carbohydrate. ns: no significative.
Table 2 – Clinical and epidemiological characteristics of study population by median resistin value.
Parameters Group I (n= 33) Group II (n= 33) p
Sex (male/female) 11/22 9/24 ns
Age (years) 56.011.3 57.912.1 ns
Systolic BP (mmHg) 137.816.5 138.716.1 ns
Diastolic BP (mmHg) 85.810.3 85.18.5 ns
Glucose (mg/dl) 127.227.3 138.227.1 ns
Total cholesterol (mg/dl) 206.138.3 224.739.5 <0.05
LDL-cholesterol (mg/dl) 132.133.9 158.735.5 <0.05
HDL-cholesterol (mg/dl) 53.415.8 52.813.7 ns
Triglycerides (mg/dl) 141.367.8 165.590.1 ns
Insulin (mUI/l) 22.217.3 26.524.3 ns
HOMA 7.15.7 9.49.8 ns
CRP (mg/dl) 4.94.7 9.46.9 ns
HbA1c (%) 5.60.8 5.80.7 ns
correlate with insulin resistance and obesity[4,6,17], while other investigations failed to observe any correlation of metabolic markers with resistin levels, and no significant difference was observed in resistin levels in subjects with metabolic syndrome compare to controls[18,19].
In our study and other previous study[20], resistin levels were correlated with BMI, waist circumference, fat mass, LDL-cholesterol and C-reactive protein, without correlation or association with insulin resistance. These controversial data may be due by a different genetic background of the participants, sex distribution, comorbidities (diabetes mellitus, hypertension) or different average of body mass index.
Other explanation for the lack of correlation with insulin resistance is that many hormones affect insulin resistance, and resistin may not be a major determinant of insulin resistance. Nevertheless, resistin is known to stimulate the expression of other proinflammatory cytokines and several studies have found circulating levels to correlate with markers of inflammation [21–23]. In the present study, as in some previous studies [21–24], levels of resistin and CRP were correlated. Cell-culture experiments on isolated monocytes demonstrated that resistin regulates proinflammatory cyto-kine secretion through the nuclear factor-kappa Beta pathway
[25], a master controller of the proinflammatory process. Also, the highest levels of resistin mRNA[26]and protein[27]were found in human mononuclear cells (e.g., macrophages), a major source of proinflammatory markers. Macrophage infiltration into visceral adipose tissue is a major feature of obesity[28]. This fact could explain the correlation between resistin levels and waist circumference and fat mass that we describe in our article.
In multivariate analysis, the relation between resistin levels and C-reactive protein remained in an independent way. Kunnari et al.[29]showed this positive correlation with C-reactive protein, too. These data suggest that in humans resistin could be related to the cardiovascular inflammatory state. Accordingly, the correlation between obesity (fat mass and waist circumference) and resistin levels might explain this inflammatory state produce by C-reactive protein sec-ondary to resistin without effect on insulin resistance[30]. There might be the possibility that resistin is rather associated with inflammation markers that would appear at different stages of metabolic syndrome development but not with an established diabetes mellitus and its metabolic parameters such as glucose, insulin resistance and HbA1c.
Secondary to this hypothesis there are studies about the reducing effects of thiazolidinedione (TZD) class of insulin sensitizers on resistin levels in an independent way of insulin resistance[31]and the notion that these agents could decrease CRP values is reported[32].
In conclusion, circulating resistin is associated with C-reactive protein in an independent way in naı¨ve diabetic patients. Further studies are needed to analyze this unclear topic area with clinical and therapeutically implications.
Conflict of interest
There are no conflicts of interest.
r e f e r e n c e s
[1] G. Fantuzzi, Adipose tissue, adipokines, and inflammation, J. Allergy Clin. Immunol. 115 (2005) 911–919.
[2] U. Meier, A.M. Gressner, Endocrine regulation of energy metabolism: review of pathobiochemical and clinical chemical aspects of leptin, ghrelin, adiponectin and resistin, Clin. Chem. Lab. Med. 50 (2004) 1511–1525. [3] M. Matsuda, I. Shimomura, M. Sata, Role of adiponectin in
preventing vascular stenosis. The missing link of adipo-vascular axis, J. Biol. Chem. 277 (2002) 37487–37491. [4] C.M. Steppan, S.T. Bailey, S. Bhat, The hormone resistin
links obesity to diabetes, Nature 409 (2001) 307–312. [5] H. Satoh, M.T. Nguyen, P.D. Miles, T. Immamura, I. Usui,
J.M. Olefsky, Adenovirus-mediated chronic hyper resistinemia leads to in vivo insulin resistance in normal rats, J. Clin. Invest. 114 (2004) 224–231.
[6] C.M. Steppan, M.A. Lazar, The current biology of resistin, J. Intern. Med. 255 (2004) 439–447.
[7] N. Sato, K. Kobayashi, T. Inoguchi, N. Sonoda, M.
Immamura, N. Sekiguchi, et al., Adenovirus-mediated high expression of resistin causes dyslipemia in mice,
Endocrinology 146 (2005) 273–279.
[8] E.D. Muse, S. Obici, S. Bhanot, B.P. Monia, R.A. McKay, M.W. Rajala, et al., Role of resistin in diet-induced hepatic insulin resistance, J. Clin. Invest. 114 (2004) 232–239.
[9] C. Pagano, O. Marin, A. Calcagno, P. Schiappelli, C. Pilon, G. Milan, et al., Increased serum resistin in adults with Prader Willi syndrome is related to obesity and not to insulin resistance, J. Clin. Endocrinol. Metab. 90 (2005) 4335–4340.
[10] M.S. Burnett, J.M. Devaney, R.J. Adenika, R. Lindsay, B.V. Howard, Cross-sectional associations of resistin, coronary heart disease and insulin resistance, J. Clin. Endocrinol. Metab. 91 (2006) 64–68.
[11] C.C. Zou, L. Liang, F. Hong, J.F. Fu, Z.Y. Zhao, Serum adiponectin, resistin levels and non-alcoholic fatty liver disease in obese children, Endocr. J. 52 (2005) 519–524. [12] Y. Takata, H. Osawa, M. Kurokawa, J. Yamauchi, M. Ochi,
W. Nishida, Hyperresistinemia is associated with coexistence of hypertension and type 2 diabetes, Hypertension 51 (2008) 534–539.
[13] A. Ellington, A. Malik, G. Klee, S. Turner, A. Rule, T. Mosley, et al., Association of plasma resistin with glomerular filtration rate and albuminuria in hypertensive adults, Hypertension 50 (2007) 708–714.
[14] D.R. Mathews, J.P. Hosker, A.S. Rudenski, B.A. Naylor, Df. Treacher, Homeostasis model assessment: insulin resistance and beta cell function from fasting plasma glucose and insulin concentrations in man, Diabetologia 28 (1985) 412–414.
[15] H. Lukaski, P.E. Johson, Assessment of fat-free mass using bioelectrical impedance measurements of the human body, Am. J. Clin. Nutr. 4 (1985) 810–817.
[16] G. Shetty, P. Economides, E. Horton, C. Mantzmoros, A. Veves, Circulating adiponectin and resistin levels in relation to metabolic factors, inflammatory markers, and vascular reactivity in diabetic patients and subjects at risk for diabetes, Diabetes Care 27 (2004) 2450–2454.
[17] K. Azuma, E. Katsukawa, S. Oguchi, M. Murata, H. Yamazaki, A. Shimada, et al., Correlation between serum resistin level and adiposity in obese individuals, Obes. Res. 11 (2003) 997–1001.
[18] A. Pfutzner, M. Langenfeld, T. Kunt, M. Lobig, T. Forst, Evaluation of human resistin assays with serum from patients with type 2 diabetes and different degrees of insulin resistance, Clin. Lab. 49 (2003) 571–576.
[19] N. Iqbal, P. Seshadri, L. Stern, J. Loh, S. Kundu, T. Jafar, et al., Serum resistin is not associated with obesity or insulin resistance in humans, Eur. Rev. Med. Pharmacol. Sci. 9 (2005) 161–165.
[20] G.D. Norata, M. Ongari, K. Garlaschelli, S. Raselli, L. Grigore, L. Catapano, Plasma resistin levels correlate with
determinants of the metabolic syndrome, Eur. J. Endocrinol. 156 (2007) 279–284.
[21] R. Ohmori, Y. Momiyama, R. Kato, H. Taniguchi, M. Ogura, M. Ayaori, et al., Associations between serum resistin levels and insulin resistance, inflammation, and coronary artery disease, J. Am. Col. Cardiol. 46 (2005) 379–380.
[22] M.P. Reilly, M. Lehrke, M.L. Wolfe, A. Rohatgi, M.A. Lazar, D.J. Rader, Resistin is an inflammatory marker of atherosclerosis in humans, Circulation 111 (2005) 932–939. [23] A. Kunnari, O. Ukkola, M. Paivansalo, Y.A. Kesaniemi, High plasma resistin level is associated with enhanced highly sensitive C-reactive protein and leukocytes, J. Clin. Endocrinol. Metab. 91 (2006) 2755–2760.
[24] J. Axelsson, A. Bergsten, A.R. Qureshi, O. Heimburger, P. Barany, F. Lonnqvist, et al., Elevated resistin levels in chronic kidney disease are associated with decreased glomerular filtration rate and inflammation, but not with insulin resistance, Kidney Int. 69 (2006) 596–604.
[25] M. Bokarewa, I. Nagaev, L. Dahlberg, U. Smith, A. Tarkowski, Resistin, an adipokine with potent proinflammatory properties, J. Immunol. 174 (2005) 5789–5795.
[26] C.A. Curat, V. Wegner, C. Sengenes, A. Miranville, C. Tonus, R. Busse, et al., Macrophages in human visceral adipose tissue: increased accumulation in obesity and a source of resistin and visfatin, Diabetologia 49 (2006) 744–747.
[27] P.G. McTernan, C.L. McTernan, R. Chetty, K. Jenner, F.M. Fisher, M.N. Lauer, et al., Increased resistin gene and protein expression in human abdominal adipose tissue, J. Clin. Endocrinol. Metab. 87 (2002) 2407.
[28] S.P. Weisberg, D. McCann, M. Desai, M. Rosenbaum, R.L. Leibel, A.W. Ferrante Jr., Obesity is associated with macrophage accumulation in adipose tissue, J. Clin. Invest. 112 (2003) 1796–1808.
[29] A. Kunnari, O. Ukkola, M. Paivansali, Y.A. Kesaniemi, High plasma resistin level is associated with enhanced hsCRP and leucocytes, J. Clin. Endocrinol. Metab. 91 (2006) 2755–2760.
[30] S. Bo, R. Gambino, A. Pagani, S. Guidi, L. Gentile, M. Cassader, et al., Relationships between human serum resistin inflammatory markers and insulin resistance, Int. J. Obes. 29 (2005) 1315–1320.
[31] M. Lehrke, M.P. Reilly, S.C. Millingyon, N. Iqbal, D.J. Rader, M.A. Lazar, An inflammatory cascade leading to
hyperresistinemia in humans, Plos Med. 1 (2004) e45. [32] N. Chu, A.P.S. Kong, D.D. Kim, D. AMstrond, S. Baxi, R.