Road load data acquisition system with SAE J1939 communications network: integration and laboratory test
Texto completo
Figure


Documento similar
Once the local side of the data acquisition system publishes data on Kafka, the real-time processing service subscribes to the corresponding topics to read the messages. It uses as
The Dwellers in the Garden of Allah 109... The Dwellers in the Garden of Allah
All the sampling strategies are parame- terizable by the number of daily tests, the minimum testing frequency (i. the minimum time between two tests carried out for the same
Figure 3.5: Range of fluctuations for real data (black bars, marking minimum and maximum of the time course) and surrogate data (colored dots). The empty circles mark the medians of
Note that, for the same linear drift rate β, and once the values for time detector δ and threshold h have been set to approximately achieve the same percentage of
As can be seen below, at the input of the system is the camera equipment, based on the operation of sensors that allow the capture of images in the form of digital data by forming
Figure 13 depicts hourly electricity load data together with the estimated responses, while Figure 14 shows the same variables but differentiated by time of day (hour). As can
In these tests we study the training time for the ensemble and for the single SVM as a function of the size of the train set N train and in function of t p.. The tests have been


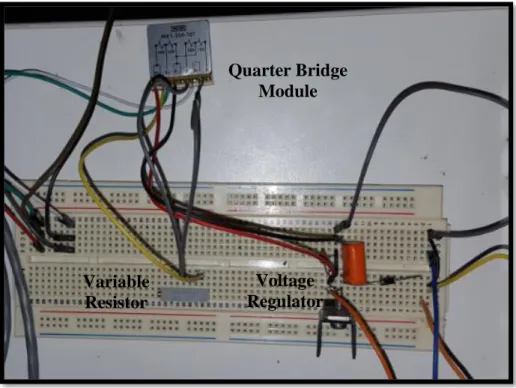
![Figure 28 Quarter Bridge configured with a Bridge Module [9]..](https://thumb-us.123doks.com/thumbv2/123dok_es/2056444.503735/51.918.179.737.112.379/figure-quarter-bridge-configured-bridge-module.webp)


![Figure A2. 1 Primary characteristics of an Analog Signal [14]](https://thumb-us.123doks.com/thumbv2/123dok_es/2056444.503735/67.918.209.706.482.777/figure-a-primary-characteristics-analog-signal.webp)