Search for squarks and gluinos in events with isolated leptons, jets and missing transverse momentum at root s=8 TeV with the ATLAS detector
83
0
0
Texto completo
(2) Prepared for submission to JHEP. Search for squarks and gluinos in events with isolated leptons, jets and missing transverse √ momentum at s = 8 TeV with the ATLAS detector. Abstract: The results of a search for supersymmetry in final states containing at least one isolated lepton (electron or muon), jets and large missing transverse momentum with the ATLAS detector at the Large Hadron Collider are reported. The search is based on √ proton–proton collision data at a centre-of-mass energy s = 8 TeV collected in 2012, corresponding to an integrated luminosity of 20 fb−1 . No significant excess above the Standard Model expectation is observed. Limits are set on supersymmetric particle masses for various supersymmetric models. Depending on the model, the search excludes gluino masses up to 1.32 TeV and squark masses up to 840 GeV. Limits are also set on the parameters of a minimal universal extra dimension model, excluding a compactification radius of 1/Rc = 950 GeV for a cut-off scale times radius (ΛRc ) of approximately 30..
(3) Contents 1 Introduction. 2. 2 The ATLAS detector. 3. 3 SUSY signal modelling and simulated event samples 3.1 Signal event samples 3.1.1 Simplified models 3.1.2 Phenomenological models 3.1.3 Event generation 3.2 Standard Model event samples 3.3 Detector simulation. 3 3 4 5 7 7 7. 4 Trigger and data collection. 8. 5 Object reconstruction 5.1 Object preselection 5.2 Signal object selection. 9 9 10. 6 Event selection 6.1 Signal regions. 11 12. 7 Background estimation 7.1 Backgrounds from tt̄ and W/Z+jets 7.2 Fake-lepton background 7.3 Other backgrounds. 18 18 27 27. 8 Systematic uncertainties 8.1 Experimental uncertainties 8.2 Theoretical uncertainties on the background estimation 8.3 Dominant uncertainties on the background estimation 8.4 Theoretical uncertainties on the signal expectation. 28 28 28 29 30. 9 Background fit. 31. 10 Results and interpretation 10.1 Background fit results and limits on the visible cross section 10.2 Exclusion limits on specific models 10.2.1 Limits on phenomenological models 10.2.2 Limits on simplified models. 33 33 41 41 42. 11 Conclusion. 52. –1–.
(4) Bibliography. 1. 54. Introduction. Supersymmetry (SUSY) [1–9] postulates the existence of particles (sparticles) which differ by half a unit of spin from their Standard Model (SM) partners. The squarks (q̃L and q̃R ) and sleptons (ℓ̃L and ℓ̃R ) are the scalar partners of the left-handed and right-handed quarks and leptons, the gluinos (g̃) are the fermionic partners of the gluons, and the charginos (χ̃± i with i = 1, 2) and neutralinos (χ̃0i with i = 1, 2, 3, 4) are the mass eigenstates (ordered from the lightest to the heaviest) formed from the linear superpositions of the SUSY partners of the Higgs and electroweak gauge bosons. An attractive feature of SUSY is that it can solve the SM hierarchy problem [10–15] if the gluino, higgsino and top squark masses are not much higher than the TeV scale. If strongly interacting sparticles exist at the TeV scale, they should be accessible at the Large Hadron Collider (LHC). In the minimal supersymmetric extension of the SM such particles decay into jets, possibly leptons, and the lightest sparticle (LSP). If the LSP is stable owing to R-parity conservation [15–19] and only weakly interacting, it escapes miss ) in the detection, leading to missing transverse momentum (pmiss and its magnitude ET T miss can final state. In this scenario, the LSP can be a dark-matter candidate. Significant ET also arise in R-parity-violating scenarios in which the LSP decays to final states containing neutrinos or in scenarios where neutrinos are present in the cascade decay chains of the produced sparticles. This paper presents a search with the ATLAS detector [20, 21] for SUSY in final states miss . Different containing jets, at least one isolated lepton (electron or muon) and large ET search channels are used in order to cover a broad parameter space: the events are selected by different requirements on the transverse momentum (pT ) of the leptons, either using low-pT leptons (referred to as the “soft” lepton selection), or high-pT leptons (referred to as the “hard” lepton selection). Each of these categories is further subdivided into a single-lepton and a dilepton search channel. The soft-lepton and hard-lepton channels are complementary, being more sensitive to supersymmetric spectra with small or large mass splittings, respectively, while the different lepton multiplicities cover different production and decay modes. To enhance the sensitivity to gluino or squark production, high and low jet multiplicity signal regions are defined. Previous searches in these final states have been conducted by the ATLAS [22, 23] and CMS [24] collaborations using their full 2011 dataset at a centre-of-mass energy of 7 TeV. In this paper, the analysis is performed on the full 2012 ATLAS dataset at a centre-of-mass energy of 8 TeV, corresponding to an integrated luminosity of up to 20.3 fb−1 . All signal regions defined in this search are optimised for this dataset. The paper is organised as follows. After a brief description of the ATLAS detector in section 2, the simulation of the background and signal processes used in the analysis is detailed in section 3. Section 4 discusses the trigger strategy and the dataset used, while. –2–.
(5) the object reconstruction and the event selection are addressed in sections 5 and 6. The background estimation and the systematic uncertainties are discussed in sections 7 and 8. The fitting procedure used is described in section 9 and the results are presented in section 10. Finally, section 11 presents the conclusions.. 2. The ATLAS detector. ATLAS is a multi-purpose detector which provides a nearly full solid angle coverage around the interaction point.1 It consists of a tracking system (inner detector or ID) surrounded by a thin superconducting solenoid providing a 2 T magnetic field, electromagnetic and hadronic calorimeters and a muon spectrometer (MS). The ID consists of pixel and silicon microstrip detectors covering the pseudorapidity region |η| < 2.5, surrounded by the transition radiation tracker (TRT) which provides electron identification in the region |η| < 2.0. The calorimeters cover |η| < 4.9, the forward region (3.2 < |η| < 4.9) being instrumented with a liquid-argon (LAr) calorimeter for both the electromagnetic and hadronic measurements. In the central region, a high-granularity lead/LAr electromagnetic calorimeter covers |η| < 3.2, while the hadronic calorimeter uses two different detector technologies, with scintillator tiles (|η| < 1.7) or LAr (1.5 < |η| < 3.2) as active medium. The MS is based on three large superconducting toroids arranged with an eight-fold azimuthal coil symmetry around the calorimeters, and a system of three layers of precision tracking chambers providing coverage over |η| < 2.7, while dedicated fast chambers allow triggering over |η| < 2.4. The ATLAS trigger system [25] consists of three levels; the first level (L1) is a hardware-based system, while the second and third levels are software-based systems and are collectively referred to as the High Level Trigger (HLT).. 3. SUSY signal modelling and simulated event samples. 3.1. Signal event samples. The signal models considered cover simplified [26, 27] and phenomenological SUSY models, as well as a minimal Universal Extra Dimension (mUED) scenario [28, 29]. Some of these models were also probed by other ATLAS searches based on the 8 TeV pp dataset, using different final-state selections [30–34]. The simplified models studied here include the pair production of gluinos or first- and second-generation squarks with different hypotheses for their decay chains, as well as gluino-mediated top squark pair production. In these models, the LSP is always the lightest neutralino. The phenomenological models include scenarios for minimal super-gravity-mediated SUSY breaking (mSUGRA/CMSSM) [35–40], bilinear R-parity violation (bRPV) [41], natural gauge mediation (nGM) [42] and a non-universal Higgs-boson mass with gaugino mediation (NUHMG) [43]. 1. The nominal pp interaction point at the centre of the detector is defined as the origin of a right-handed coordinate system. The positive x-axis is defined by the direction from the interaction point to the centre of the LHC ring, with the positive y-axis pointing upwards, while the beam direction defines the z-axis. The azimuthal angle φ is measured around the beam axis and the polar angle θ is the angle from the z-axis. The pseudorapidity is defined as η = − ln tan(θ/2).. –3–.
(6) 3.1.1. Simplified models. The topologies of the simplified models considered in this paper are illustrated in figure 1. In these simplified models, all the sparticles which do not directly enter the production and decay chain are effectively decoupled. The first category of simplified models focuses on the pair production of left-handed squarks or of gluinos, the latter assuming degenerate first- and second-generation squarks. This category of models is subdivided into three different decay chains: “one-step” models, “two-step” models with sleptons, and “two-step” models without sleptons.. t p. c g̃. χ̃01. t̃ t̃. χ̃01. g̃ p. c t. Figure 1. Examples of the decay topologies of the q̃L (top) or g̃ (middle) pair production, in the simplified model with “one step” (left) and “two steps” with (centre) or without (right) sleptons. The bottom diagrams show examples of the topologies considered for gluino-mediated production of top squarks.. In the “one-step” models, the pair-produced strongly interacting sparticles decay via the lighter chargino into a W boson and the lightest neutralino. The free parameters in these models are chosen to be the mass of the squark/gluino and either the mass of the 0 0 chargino, with a fixed χ̃1 mass set to 60 GeV, or the mass of the χ̃1 , with the chargino mass set to mχ̃± = (mg̃/q̃ + mχ̃01 )/2. 1 In the “two-step” models with sleptons, the strongly interacting sparticles decay with equal probability via either the lightest chargino or the next-to-lightest neutralino. These subsequently decay via left-handed sleptons (or sneutrinos) which decay into a lepton (or neutrino) and the lightest neutralino. In these models, the free parameters are cho0 sen to be the initial sparticle mass and the χ̃1 mass. The masses of the intermediate. –4–.
(7) charginos/neutralinos are set to be equal, mχ̃± ,χ̃0 = (mg̃/q̃ + mχ̃01 )/2, while the slepton and 2 1 sneutrino masses (all three lepton flavours are mass degenerate in this model) are set to mℓ̃L ,ν̃ = (mχ̃± /χ̃0 + mχ̃01 )/2. 1 2 Finally, in the “two-step” models without sleptons, the initial sparticle decays via the lighter chargino, which itself decays into a W boson and the next-to-lightest neutralino. The 0 latter finally decays into a Z boson and the χ̃1 . The lighter chargino mass is fixed at mχ̃± = 1 (mg̃/q̃ + mχ̃01 )/2 and the next-to-lightest neutralino mass is set to be mχ̃02 = (mχ̃± + mχ̃01 )/2. 1 This signature could be realised in the Minimal Supersymmetric Standard Model (MSSM) in a region of parameter space where additional decay modes, not contained in the simplified model, may lead to a significant reduction in the cross section times branching fraction of the W Z signature. The second category of simplified models considers the gluino-mediated production of top squarks.2 In these models, the lightest squark is the lightest top squark mass eigenstate t̃1 formed from the mixing of t̃L and t̃R , and the squarks of all other flavours are effectively decoupled. Two models are considered in this specific search for gluino-mediated top squark production. In the first model, t̃1 is effectively decoupled and its mass is set to 2.5 TeV, a mass for which there is no current sensitivity to direct production. Each gluino decays with 100% branching fraction to a top quark and a virtual top squark, the latter exclusively 0 decaying to a top quark and the χ̃1 , leading to a final state with a pair of top quarks and 0 a neutralino, g̃ → tt̄χ̃1 . The mass of the gluino is a free parameter and is varied up to 1.4 TeV, a value representative of the expected reach of the analysis. This final state is therefore characterised by the presence of four top quarks (decaying to four b-jets and four 0 W bosons) and two χ̃1 . In the second model, the gluino is heavier than the t̃1 , and the 0 mass gap between the t̃1 and the χ̃1 is smaller than the W boson mass and fixed to 20 GeV. Gluinos decay to a top quark and a top squark, g̃ → t̄t̃1 , and the t̃1 is set to exclusively 0 0 decay to a charm quark and the χ̃1 , t̃1 → cχ̃1 . Using gluino-mediated production to probe this decay is particularly interesting as it is complementary to the direct pair production of t̃1 , which is more difficult to extract from the background for this specific decay mode of t̃1 (see ref. [44]). This final state is therefore characterised by the presence of two top quarks 0 (decaying to two b-jets and two W bosons), two c-quarks and two χ̃1 . 3.1.2. Phenomenological models. Phenomenological models are also considered in this paper. The mSUGRA/CMSSM model is specified by five parameters: the universal scalar mass m0 , the universal gaugino mass m1/2 , the universal trilinear scalar coupling A0 , the ratio tan β of the vacuum expectation values of the two Higgs fields, and the sign of the higgsino mass parameter µ. In the mSUGRA/CMSSM model studied here, the values tan β = 30, A0 = −2m0 and µ > 0 were chosen, such that the lightest scalar Higgs boson mass is approximately 125 GeV in most of the (m0 ,m1/2 ) parameter space studied. A bRPV scenario is also studied; it uses the same parameters as the mSUGRA/CMSSM model, but with non-zero bilinear R-parity-violating couplings, which are determined by In these models, the t̃ mixing angle is taken to be 56◦ , but the value of this mixing angle has no impact on the results of the analyses presented in this paper. 2. –5–.
(8) a fit to atmospheric and solar neutrino data [45] under the tree-level dominance scenario 0 [46]. In this scenario, the χ̃1 LSP decays promptly to W µ, W τ , Zν or hν (where the W/Z/h boson can either be on shell or off shell) with branching fractions which are weakly dependent on m0 and m1/2 but which are typically of the order of 20–40%, 20–40%, 20–30% and 0–20%, respectively. The nGM scenario differs from the general gauge mediation models [47, 48] in that all sparticles that are not relevant to the tuning of the Higgs sector are decoupled. The relevant sparticles are thus the higgsinos, one or two light top squarks, a light gluino and a very light gravitino (G̃) LSP. This configuration results in minimal fine tuning while obeying all current collider constraints. The sparticles that play no role in fine tuning can subsequently be reintroduced while retaining the naturalness of the model. In the model considered here, and described in detail in ref. [34], the stau (τ̃ ) is assumed to be the next-to-lightest SUSY particle (NLSP), and the gluino is assumed to be the only light coloured sparticle. Therefore, the only relevant production process in this model is gluino 0 pair production followed by two possible decay chains: g̃ → g χ̃1,2 → gτ̃ τ → gτ τ G̃ and ± g̃ → qq ′ χ̃1 → qq ′ ντ τ̃ → qq ′ ντ τ G̃, where q and q ′ are almost exclusively top or bottom quarks. The exact proportion of the two processes depends on the mass of the decoupled squarks, with the first process only happening for low gluino masses. The higgsino mass parameter µ is set to 400 GeV, which fixes the mass of the chargino and the neutralinos, such that strong production is the dominant process at the LHC. A range of signals with varying gluino and stau masses are studied. The lightest Higgs-boson mass is specifically set to 125 GeV. NUHMG is an R-parity-conserving model with the tau-sneutrino as the NLSP. There are six parameters which can be varied to obtain different phenomenologies: tan β, m1/2 , A0 and the sign of µ, defined above, as well as the squared mass terms of the two Higgs doublets: m2H1 and m2H2 . These parameters are set as follows: tan β = 10, µ > 0, m2H2 = 0; m1/2 and m2H1 are chosen such that the NLSP is a tau-sneutrino with properties satisfying Big Bang Nucleosynthesis constraints (see ref. [43]); A0 is chosen to maximise the mass of the lightest Higgs boson (in NUHMG models, the Higgs boson mass obtained is usually lower than the measured value: varying A0 allows the models considered here to minimise this difference to the level of a few GeV). In this model, there is a significant production of gluinos and squarks throughout the parameter space studied. The gluino decays mainly to a first- or second-generation quark/squark pair q q̃ (≈ 50%), but also to tt̃ (≈ 30%) or bb̃ (≈ 20%), while the squark cascade decay typically involves charginos, neutralinos and/or sleptons. This analysis also considers the mUED model, which is the minimal extension of the SM with one additional universal spatial dimension. The properties of the model depend on only three parameters: the compactification radius Rc , the cut-off scale Λ and the Higgs boson mass mh . In this model, the mass spectrum is naturally degenerate and the decay chain of the Kaluza–Klein (KK) quark to the lightest KK particle, the KK photon, gives a signature very similar to the supersymmetric decay chain of a squark to the lightest neutralino. Signal events for this model are generated with a Higgs-boson mass of 125 GeV.. –6–.
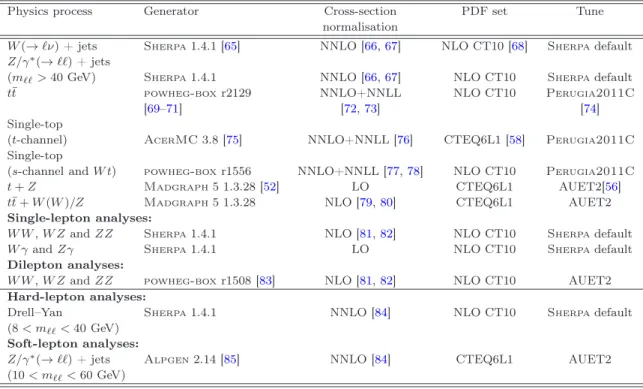
(9) 3.1.3. Event generation. SUSY-HIT and SDECAY 1.3b [49, 50], interfaced to SOFTSUSY 3.1.6 [51], are used to calculate the sparticle mass spectra and decay tables, and to ensure consistent electroweak symmetry breaking in the mSUGRA/CMSSM models. All the simplified models except the gluino-mediated top squark production are generated with up to one extra parton in the matrix element using Madgraph 5 1.3.33 [52] interfaced to Pythia 6.426 [53]; MLM matching [54] is applied with a scale parameter that is set to a quarter of the mass of the lightest sparticle in the hard-scattering matrix element. Herwig++ 2.5.2 [55] is used to generate the mUED, mSUGRA and nGM samples, as well as the samples for the simplified model with gluino-mediated top squark production. Finally, the NUHMG and bRPV samples are generated with Pythia 6.426. The ATLAS underlying-event tune AUET2 is used [56] for Madgraph 5 and Pythia 6 samples while the CTEQ6L1-UE-EE-3 tune [57] is used for Herwig++ samples. The parton distribution functions (PDFs) from CTEQ6L1 [58] are used for all signal samples. For all except the mUED sample, the signal cross sections are calculated at next-toleading order (NLO) in the strong coupling constant, adding the resummation of soft gluon emission at next-to-leading-logarithmic accuracy (NLO+NLL) [59–63]. The nominal cross section is taken from an envelope of cross-section predictions using different PDF sets and factorisation and renormalisation scales, as described in ref. [64]. For the mUED model, the cross section is taken at leading order from Herwig++. 3.2. Standard Model event samples. The simulated event samples for the SM backgrounds are summarised in table 1, along with the PDFs and tunes used. Further samples are also used to compute systematic uncertainties, as explained in section 8. The Drell–Yan samples used in the hard-lepton analyses have a filter which selects events at generation level by requiring the leptons to satisfy pT ℓ1 (ℓ2 ) > 9(5) GeV and |ηℓ1,2 | < 2.8. This filter prevents its use in the soft-lepton analyses which use Alpgen samples with a lepton pT cut at 5 GeV. The Alpgen [85] samples are generated with the MLM matching scheme and with 0 ≤ Nparton ≤ 5; for these samples Herwig 6.520 [86] is used for simulating the parton shower and fragmentation processes in combination with Jimmy [87] for underlying-event simulation. Pythia 6.426 is used for the Madgraph 5, AcerMC [75] and all powheg [69–71] samples except for the diboson powheg samples, which use Pythia 8.163 [88]. The powheg diboson samples have dilepton filters which increase the number of Monte Carlo events available for the dilepton analyses. Sherpa uses its own parton shower and fragmentation, and the Sherpa W +jets and Z/γ ∗ +jets samples are generated with massive b/c-quarks to improve the treatment of the associated production of W/Z bosons with heavy flavour. 3.3. Detector simulation. The detector simulation is performed either with a full ATLAS detector simulation [89] based on Geant4 [90] or a fast simulation based on the parameterisation of the performance of the ATLAS electromagnetic and hadronic calorimeters [91] and on Geant4. –7–.
(10) Physics process. Generator. Cross-section normalisation. PDF set. Tune. W (→ ℓν) + jets Z/γ ∗ (→ ℓℓ) + jets (mℓℓ > 40 GeV) tt̄. Sherpa 1.4.1 [65]. NNLO [66, 67]. NLO CT10 [68]. Sherpa default. Sherpa 1.4.1 powheg-box r2129 [69–71]. NNLO [66, 67] NNLO+NNLL [72, 73]. NLO CT10 NLO CT10. Sherpa default Perugia2011C [74]. NNLO+NNLL [76]. CTEQ6L1 [58]. Perugia2011C. NNLO+NNLL [77, 78] LO NLO [79, 80]. NLO CT10 CTEQ6L1 CTEQ6L1. Perugia2011C AUET2[56] AUET2. NLO [81, 82] LO. NLO CT10 NLO CT10. Sherpa default Sherpa default. NLO [81, 82]. NLO CT10. AUET2. NNLO [84]. NLO CT10. Sherpa default. NNLO [84]. CTEQ6L1. AUET2. Single-top (t-channel) AcerMC 3.8 [75] Single-top (s-channel and W t) powheg-box r1556 t+Z Madgraph 5 1.3.28 [52] tt̄ + W (W )/Z Madgraph 5 1.3.28 Single-lepton analyses: W W , W Z and ZZ Sherpa 1.4.1 W γ and Zγ Sherpa 1.4.1 Dilepton analyses: W W , W Z and ZZ powheg-box r1508 [83] Hard-lepton analyses: Drell–Yan Sherpa 1.4.1 (8 < mℓℓ < 40 GeV) Soft-lepton analyses: Z/γ ∗ (→ ℓℓ) + jets Alpgen 2.14 [85] (10 < mℓℓ < 60 GeV). Table 1. Simulated background event samples used in this paper (where ℓ = e, µ, τ ): the corresponding generators, cross-section normalisation, PDF set and underlying event tune are shown. More details (e.g. concerning the parton showers) can be found in the text.. elsewhere. All simulated samples are generated with a range of minimum-bias interactions (simulated using Pythia 8 with the MSTW2008LO PDF set [92] and the A2 tune [93]) overlaid on the hard-scattering event to account for the multiple pp interactions in the same bunch crossing (pile-up). The overlay also treats the impact of pile-up on bunch crossings other than the bunch crossing in which the event occurred. Event-level weights are applied to the simulated samples to account for differences between data and simulation for the lepton trigger, identification and reconstruction efficiencies, and for the efficiency and misidentification rate of the algorithm used to identify jets containing b-hadrons (b-tagging).. 4. Trigger and data collection. The data used in this paper were collected in 2012, during which the instantaneous luminosity of the LHC reached 7.7 × 1033 cm−2 s−1 . The average number of expected interactions per bunch crossing ranged from approximately 6 to 40, with a mean of 21. After applying data-quality requirements related to the beam and detector conditions, the total integrated luminosity is 20.1 fb−1 in the soft-lepton channel and 20.3 fb−1 in the hard-lepton channel; the integrated luminosities differ as these channels use different trigger requirements. The uncertainty on the integrated luminosity is ±2.8%. It is derived, following the same methodology as that detailed in ref. [94], from a preliminary calibration of the luminosity scale derived from beam-separation scans performed in November 2012.. –8–.
(11) In the hard single-electron channel the L1 decision is based on electron requirements miss requirements are used at the HLT. The trigger thresholds only, while electron and ET miss . The E miss trigger on HLT objects are 24 GeV for the electron and 35 GeV for ET T miss > 80 GeV. The electron trigger selects events containing one or is fully efficient for ET more electron candidates, based on the presence of an energy cluster in the electromagnetic calorimeter, with a shower shape consistent with that of an electron, and has no explicit electron isolation requirement except a loose one at L1. For electrons with pT > 25 GeV, the trigger efficiency increases from 70% to close to 100% as the electron pT increases from 24 to 30 GeV. In the hard single-muon channel the L1 decision is based on muon and jet requirements miss . The trigger thresholds on HLT only, while the HLT also includes requirements on ET miss . The muon objects are at 24 GeV for the muon, 65 GeV for the jet and 40 GeV for ET trigger selects events containing one or more muon candidates based on the hit patterns in the MS and ID, and has no muon isolation requirement. The combined trigger reaches its maximal efficiency of approximately 70% (90%) for a muon in the barrel (end-cap) for miss > 100 GeV and fully calibrated jets with p > 80 GeV. muons satisfying pT >25 GeV, ET T In the hard two-lepton channel, a combination of single-lepton and dilepton triggers is used with different pT requirements on the electron(s) and muon(s). The maximal trigger efficiency is reached when requiring the leading lepton to have pT > 14 GeV in ee and µµ events or peT (pµT ) > 10(18) GeV in eµ events. If both leptons are in the barrel (end-cap), these plateau efficiencies are approximately 96%, 88% and 80% (91%, 92% and 82%) for ee, eµ and µµ events, respectively. Since the thresholds in the single-lepton and dilepton triggers are too high to be suitable miss > 80 GeV trigger which is for the soft-lepton event selections, this channel relies on a ET miss fully efficient for events with a jet with pT >80 GeV and ET > 150 GeV.. 5. Object reconstruction. In this section, the final-state object reconstruction and selection requirements are described. The preselection described below identifies candidate objects. Some objects are also required to pass a tighter selection before they are used in the event selection. The event selection criteria and the various signal regions are described in detail in section 6. 5.1. Object preselection. The primary vertex of the event [95] is required to be consistent with the beam-spot envelope. When more than one such vertex is found, the vertex with the largest summed |pT |2 of the associated tracks is chosen. Jets are reconstructed from three-dimensional calorimeter energy clusters using the anti-kt algorithm [96, 97] with a radius parameter R = 0.4. Jets arising from detector noise, cosmic rays or other non-collision sources are rejected, as described in ref. [98]. To take into account the differences in calorimeter response between electrons/photons and hadrons, each cluster is classified, prior to the jet reconstruction, as coming from an electromagnetic or hadronic shower on the basis of its shape [21]. The jet energy is then. –9–.
(12) corrected at cluster level by weighting electromagnetic and hadronic energy deposits with correction factors derived from Monte Carlo simulation. A correction is applied to subtract the expected contamination from pile-up: it is calculated as the product of the jet area in the (η, φ) space and the average energy density of the event [99]. A further calibration, relating the response of the calorimeter to true jet energy [98, 100], is then applied, with a residual correction to account for differences between the data in situ measurements and the Monte Carlo simulation. Once calibrated, the “preselected” jets are required to have pT > 20 GeV and |η| < 2.5. Electrons are reconstructed from clusters in the electromagnetic calorimeter matched to tracks in the ID [101]. The “preselected” electrons are required to pass a variant of the “medium” selection of ref. [101], which was modified in 2012 to reduce the impact of pileup. These electrons must have |η| < 2.47 and pT > 7 (10) GeV in the soft(hard)-lepton channel. As each electron can also be reconstructed as a jet, electrons with ∆R(e, jet) < 0.2 p are kept, where ∆R = (∆η)2 + (∆φ)2 , and the jet is discarded in order to resolve the ambiguity; for 0.2 < ∆R(e, jet) < 0.4, the electron is discarded and the jet is kept; for ∆R(e, jet) > 0.4 both the electron and the jet are kept. The electrons are also required to be well separated from the preselected muons described below, with ∆R(e, µ) > 0.01. If two preselected electrons are found to have an angular separation ∆R(e, e) < 0.05, only the higher-pT electron is kept. Finally, any event containing a preselected electron in the transition region between the barrel and end-cap electromagnetic calorimeters, 1.37 < |η| < 1.52, is rejected. Muons are identified either as a combined track in the MS and ID systems, or as an ID track matched to a MS segment [102]. Requirements on the quality of the ID track are identical to those in ref. [103]. “Preselected” muons in the soft(hard)-lepton channel are required to have pT > 6 (10) GeV, |η| < 2.40 and ∆R(µ, jet) > 0.4 with respect to the closest preselected jet. The missing transverse momentum is computed from the transverse momenta of identified electrons, photons, jets and muons, and from all calorimeter clusters within |η| < 4.5 not associated with such objects [104]. 5.2. Signal object selection. For the final selection of events used to define the various signal regions, some objects are required to pass more stringent requirements, which are described below. “Signal” jets have a higher threshold than preselected jets, with pT > 25 GeV. Signal jets with |η| < 2.4 are further required to be associated with the hard-scattering process by demanding that at least 25% of the scalar sum of the pT of all tracks associated with the jet comes from tracks associated with the primary vertex in the event. This jet vertex fraction requirement is applied in order to remove jets which come from pile-up [105]; it is not applied to jets with pT greater than 50 GeV nor to the b-tagged jets (see below), since the probability of a pile-up jet satisfying either of these requirements is negligible. Signal jets containing b-hadrons are identified using the neural-network-based algorithm MV1 described in ref. [106], which uses information about track impact parameters and reconstructed secondary vertices. The presence of b-jets is vetoed in the hard dilepton signal. – 10 –.
(13) regions and in some of the soft-lepton signal regions in order to reduce the tt̄ background. In the single-lepton channels, there is no requirement on b-jets in the event selection, but they are used in the background estimation, as explained in section 7. The tightness of the selection criteria used in the b-tagging is optimised for each channel. In all signal regions except for the soft dimuon signal region, the chosen criteria give an inclusive b-tagging efficiency of 60% in a simulated sample of tt̄ events; in the soft dimuon signal region they are chosen to give an inclusive efficiency of 80%. For a b-jet efficiency of 60% (80%), the algorithm provides a rejection factor of approximately 585 (25) for light-quark and gluon jets, and of approximately 8 (3) for charm jets [107]. The “signal” electrons are required to be isolated, and the isolation requirement depends on the electron transverse momentum. For pT < 25 GeV (pT ≥ 25 GeV), the scalar sum of the pT of tracks within a cone of size ∆R = 0.3 (0.2) around the electron, excluding the electron itself, is required to be less than 16% (10%) of the electron pT . For pT < 25 GeV, the distance |z0 sin θ| must be ≤ 0.4 mm, where z0 is the longitudinal impact parameter with respect to the primary vertex. For pT ≥ 25 GeV, |z0 | is required to be ≤ 2 mm. Finally, for electrons with pT < 25 GeV, the significance of the distance of closest approach of the electron to the primary vertex in the transverse plane must be |d0 /σd0 | < 5, while for electrons with pT ≥ 25 GeV, the distance of closest approach itself must be |d0 | ≤ 1 mm. Isolation is also required in the “signal” muon definition. For pT < 25 GeV, the scalar sum of the pT of tracks within a cone of size ∆R = 0.3 around the muon candidate, excluding the muon itself, is required to be less than 12% of the muon pT , while for pT ≥ 25 GeV, the same sum within a cone of size ∆R = 0.2 is required to be less than 1.8 GeV. Muons with pT < 25 GeV are required to have |z0 sin θ| less than 1 mm and |d0 /σd0 | less than 3. With the lepton selection described above, the combined isolation and identification efficiency measured in simulated tt̄ events for electrons (muons) is 56% (72%) at pT = 20 GeV and 84% (82%) at pT = 100 GeV.. 6. Event selection. Events selected by the triggers are required to have a primary vertex with at least five associated tracks with pT > 400 MeV. An event is rejected if it contains any preselected jet which fails to satisfy the quality criteria which are designed to suppress non-collision backgrounds and detector noise [108, 109], or any preselected muon with |z0 | > 1.0 mm and |d0 | > 0.2 mm in order to remove cosmic-ray muons. These selection criteria remove O(2%) of data events. This analysis is based on a number of signal regions (SR), each designed to maximise the sensitivity to different SUSY topologies in terms of the chosen discriminating variables. As described in detail in section 7, a number of control regions (CR) are constructed to constrain the dominant backgrounds. These control regions are designed to have a high purity, a small statistical uncertainty in terms of the background process of interest and to contain only a small fraction of the potential SUSY signal. Because of these requirements, the CRs are not necessarily close to the SRs in terms of the main discriminating variables. As described in Section 9, validation regions (VR), closer to the SRs than the CRs, are used. – 11 –.
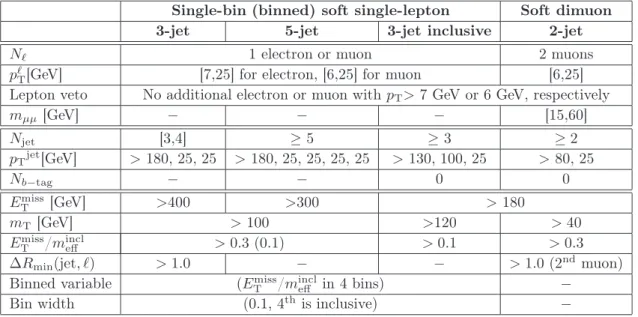
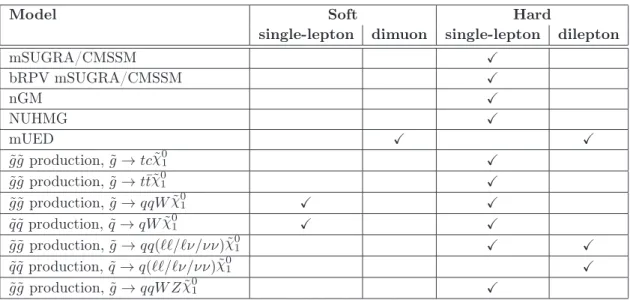
(14) to verify the compatibility between data and MC. Figures 2–4 illustrate these concepts, respectively for the soft-lepton, hard single-lepton and hard dilepton analyses. 6.1. Signal regions. The selection criteria used to define the various signal regions in this paper are summarised in table 2 for the soft-lepton signal regions, in table 3 for the hard single-lepton signal regions and in table 4 for the hard dilepton signal regions. The soft and hard single-lepton signal regions are designed with lower jet multiplicities to cover squark pair production and with higher jet multiplicities to cover gluino pair production. The soft single-lepton channel focuses on models with a compressed mass spectrum, with the 3-jet inclusive selection being defined to make the analysis sensitive to squark pair production in the case where there is a large mass gap between the squark and the LSP. The soft dimuon channel is optimised for mUED searches. The hard dilepton channel targets gluino and first- and second-generation squark production, as well as mUED searches; it is not designed to search for signal events in which a real Z boson is present. The correspondence between the analysis channels and the various models probed is summarised in table 5. Single-bin (binned) soft single-lepton 3-jet 5-jet 3-jet inclusive Nℓ pℓT [GeV] Lepton veto mµµ [GeV] Njet pT jet [GeV] Nb−tag miss ET [GeV] mT [GeV] miss ET /mincl eff ∆Rmin (jet, ℓ) Binned variable Bin width. Soft dimuon 2-jet. 1 electron or muon 2 muons [7,25] for electron, [6,25] for muon [6,25] No additional electron or muon with pT > 7 GeV or 6 GeV, respectively − − − [15,60]. [3,4] > 180, 25, 25 − >400. ≥5 > 180, 25, 25, 25, 25 −. − miss (ET /mincl eff in 4 bins) (0.1, 4th is inclusive). ≥2 > 80, 25 0. > 180. >300. > 100 > 0.3 (0.1) > 1.0. ≥3 > 130, 100, 25 0 >120 > 0.1 −. > 40 > 0.3 > 1.0 (2nd muon) − −. Table 2. Overview of the selection criteria for the soft single-lepton and dimuon signal regions. For each jet multiplicity in the single-lepton channel, two sets of requirements are defined, corresponding to single-bin and binned signal regions (see the text at the end of Section 6.1). The requirements of the binned signal region are shown in parentheses when they differ from those of the single-bin signal region. The variables ∆Rmin (jet, ℓ), mT and mincl eff are defined in equations 6.1, 6.2 and 6.3, respectively.. The following variables, derived from the kinematic properties of the objects, are used in the event selection.. – 12 –.
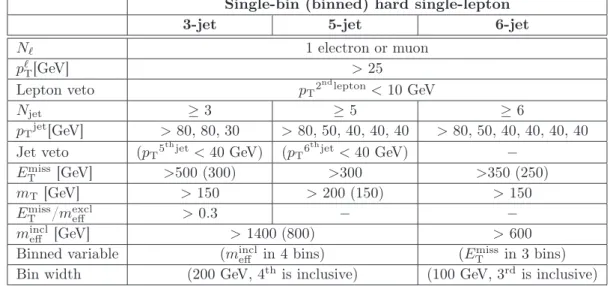
(15) Single-bin (binned) hard single-lepton 3-jet 5-jet 6-jet Nℓ pℓT [GeV] Lepton veto Njet pT jet [GeV] Jet veto miss ET [GeV] mT [GeV] miss ET /mexcl eff mincl eff [GeV] Binned variable Bin width. 1 electron or muon > 25 2nd lepton pT < 10 GeV ≥3 ≥5 ≥6 > 80, 80, 30 > 80, 50, 40, 40, 40 > 80, 50, 40, 40, 40, 40 th th (pT 5 jet < 40 GeV) (pT 6 jet < 40 GeV) − >500 (300) >300 >350 (250) > 150 > 200 (150) > 150 > 0.3 − − > 1400 (800) > 600 miss (mincl in 4 bins) (E in 3 bins) T eff (200 GeV, 4th is inclusive) (100 GeV, 3rd is inclusive). Table 3. Overview of the selection criteria for the hard single-lepton signal regions. For each jet multiplicity, two sets of requirements are defined, corresponding to single-bin and binned signal regions (see the text at the end of Section 6.1). The requirements of the binned signal region are shown in parentheses when they differ from those of the single-bin signal region. The variables excl mT and mincl eff are defined in equations 6.2 and 6.3, respectively, while meff is defined in the text. Single-bin (binned) hard dilepton Low-multiplicity (≤ 2-jet) 3-jet ee/µµ Nℓ pℓT [GeV] Nℓℓ with 81< mℓℓ <101 GeV Njet pT jet [GeV] Nb−tag R ′ MR [GeV] ′ MR bin width [GeV]. 0. eµ. ee/µµ. eµ. 2, 2 of opposite sign or ≥ 2 >14,10 − 0 − ≤2 ≥3 > 50,50 > 50, 50, 50 0. >0.5 >0.35 > 600 (> 400 in 8 bins) > 800 (> 800 in 5 bins) (100, the last is inclusive ). Table 4. Overview of the selection criteria for the hard dilepton signal regions. The requirements on the number and charge of the leptons depend on the model probed (see the text). For each jet multiplicity, two sets of requirements are defined, corresponding to single-bin and binned signal regions (see the text at the end of Section 6.1). The requirements of the binned signal region are ′ shown in parentheses when they differ from those of the single-bin signal region. The variables MR and R are defined in equations 6.4 and 6.6, respectively.. The minimum angular separation between the signal lepton ℓ and all preselected jets, ∆Rmin (jet, ℓ) = min (∆R(jet1 , ℓ), ∆R(jet2 , ℓ), ..., ∆R(jetn , ℓ)),. (6.1). is used to reduce the background coming from misidentified or non-prompt leptons in the. – 13 –.
(16) mT [GeV] T. miss. VR2. VR1. miss T. miss. (high E. T. region). VR3. CR. miss. (high E. 50. T. ATLAS 0 100. 200. region). VR3. (interm. E. CR. VR2 (interm. E. T. 100. region). 100. 50. SR3J (inclusive) 150. SR3J. (m region). VR1. SR5J. 200. T. 150. (m region). mT [GeV]. 200. 300. 400. region). ATLAS 500. 0 100. 600. 200. 300. Emiss [GeV] T. 400. 500. 600. Emiss [GeV] T. T. VR3. (low p region). mµµ [GeV]. 150 Top CR. VR2. (b-tag). (b-veto region). 100. (b-veto). 50. SR2MU. Z-mass veto. VR1 (low mµ µ region). ATLAS. 0 0. 20. 40. 60. 80 100 p (µ1) [GeV] T. Figure 2. Graphical illustration of the soft lepton signal regions (SR) used in this paper. The soft single-lepton signal regions are shown in the plane of transverse mass mT (see equation 6.2) miss versus missing transverse momentum ET : the 3- and 5-jet regions are depicted in the upper left plot while the 3-jet inclusive region is shown in the upper right plot; the soft dimuon signal region is shown in the bottom plot in the plane of the dimuon mass,mµµ , versus the pT of the leading muon, pT (µ1 ). The control regions (CR) and validation regions (VR) described in sections 7 and 9, respectively, are also shown.. soft-lepton signal region with three jets and in the soft dimuon signal region. In the latter case, the subleading signal muon is used to compute ∆Rmin . As the expected signal jet multiplicity grows, the ∆Rmin requirement starts to impair the signal acceptance; this requirement is hence not applied in the soft-lepton 5-jet and 3-jet inclusive signal regions (see table 2). The dilepton mass mℓℓ for leptons of the same flavour and opposite charge is required to be outside the Z boson mass window in the soft and hard dileptonic channels in order. – 14 –.
(17) 250 200. SR (single−bin) (meff > 1400 GeV,. SR (binned) /meff > 0.3) (Emiss T. Emiss /meff > 0.3) T. 300. ATLAS. 250. SR (single−bin) (meff > 1400 GeV). VR mT. mT [GeV]. 5−jet CR/VR/SR. ATLAS. VR mT. mT [GeV]. 3−jet CR/VR/SR 300. 200. SR (binned) 150. 150 CR. miss. VR ET. 100. meff > 800 GeV. 50. 50. Multijet control region (no m cut) 100. 200. 300. meff > 800 GeV. Multijet control region (no m cut). eff. 0 0. miss. VR ET. CR. 100. 400. 500. eff. 0 0. 600 700 Emiss [GeV] T. 100. 200. 300. 400. 500. 600 700 Emiss [GeV] T. ATLAS. 250. VR mT. mT [GeV]. 6−jet CR/VR/SR 300. 200. SR (single−bin) SR SR (binned) SR (binned). 150 TR. 100. meff > 600 GeV. miss. VR ET. WR WR WR. 50. Multijet control region (no m cut) eff. 0 0. 100. 200. 300. 400. 500. 600 700 Emiss [GeV] T. 1. 2-lepton CR/VR/SR1, ≤ 2 jets pT>50 GeV. ATLAS. 0.9 0.8 0.7. R. R. Figure 3. Graphical illustration of the hard single-lepton 3-jet (top left), 5-jet (top right) and 6-jet (bottom) signal regions (SR) used in this paper, shown in the plane of transverse mass mT (see miss equation 6.2) versus missing transverse momentum ET . The control regions (CR) and validation regions (VR) described in sections 7 and 9, respectively, are also shown.. Top VR1 (b-tag). Razor dilepton SR1. Razor dilepton SR2 (b-veto). Top VR2 (b-tag). 0.7. (b-veto). 0.6 0.5. Z VR1 (b-veto). 0.4 Top CR1 (b-tag). 0.3. Z CR1 (b-veto). 0.2. Top CR2 (b-tag). Z VR2 (b-veto). 0.2. 0.1 0 0. ATLAS. 0.9. 0.5 0.3. 2-lepton CR/VR/SR2, ≥ 3 jets pT>50 GeV. 0.8. 0.6 0.4. 1. Z CR2 (b-veto). 0.1 200. 400. 600. 800. 1000. 0 0. 1200. 200. 400. 600. 800. MR’ [GeV]. 1000. 1200. MR’ [GeV]. Figure 4. Graphical illustration of the hard dilepton signal regions (SR) used in this paper. The low-multiplicity (left) and 3-jet (right) hard dilepton signal regions are shown in the plane of R-frame mass MR′ versus razor variable R (see equations 6.2 and 6.6). The control regions (CR) and validation regions (VR) described in sections 7 and 9, respectively, are also shown.. to reject background events in which a real Z boson decays to leptons.. – 15 –.
(18) Model. Soft single-lepton dimuon. mSUGRA/CMSSM bRPV mSUGRA/CMSSM nGM NUHMG mUED 0 g̃g̃ production, g̃ → tcχ̃1 0 g̃g̃ production, g̃ → tt̄χ̃1 0 g̃g̃ production, g̃ → qqW χ̃1 0 q̃ q̃ production, q̃ → qW χ̃1. Hard single-lepton dilepton X X X X. X. X X X X X X. X X. 0 g̃g̃ production, g̃ → qq(ℓℓ/ℓν/νν)χ̃1 0 q̃ q̃ production, q̃ → q(ℓℓ/ℓν/νν)χ̃1 0 g̃g̃ production, g̃ → qqW Z χ̃1. X X. X. Table 5. Analysis channels used to probe each of the models described in section 3.1.. The transverse mass (mT ) of the lepton (ℓ) and pmiss is defined as T q miss (1 − cos[∆φ(~ ℓ, pmiss mT = 2pℓT ET T )]),. (6.2). and is used in all signal regions to reject events containing a W → ℓν decay, except in the hard dilepton signal regions where this background is expected to be small. In the soft dimuon channel, the transverse mass is defined using the subleading muon. The inclusive effective mass (minc eff ) is the scalar sum of the pT of the lepton(s), the jets miss and ET : Njet Nℓ X X inc ℓ miss meff = pT,i + pT,j + ET (6.3) i=1. j=1. where the index i identifies all the signal leptons and the index j all the signal jets in the event. The inclusive effective mass is correlated with the overall mass scale of the hard scattering and provides good discrimination against SM backgrounds, without being too sensitive to the details of the SUSY decay cascade. It is used in the hard single-lepton channel. miss /minc is used in the soft-lepton signal regions; it reflects the change in The ratio ET eff miss the ET resolution as a function of the calorimeter activity in the event. In the hard singlemiss /mexcl , where the exclusive effective mass, lepton channel, a similar ratio is computed, ET eff inc , with the exception that only the three leading mexcl , is defined in a similar way to m eff eff miss coming signal jets are considered. This variable is used to remove events with large ET from a poorly reconstructed jet. Razor variables [110] are used in the hard dilepton signal region. They are a set of kinematic variables that exploit the symmetry in the visible portion of sparticle decays when sparticles are produced in pairs. The final-state jets and leptons are grouped into two “mega-jets”, where all visible objects from one side of the di-sparticle decay are collected. – 16 –.
(19) together to create a single four-vector, representing the decay products of a single sparticle. The mega-jet construction involves iterating over all possible combinations of the fourvectors of the visible reconstructed objects, with the favoured combination being that which minimises the sum of the squared masses of the mega-jet four-vectors. Using this mega-jet configuration, with some simplifying assumptions (e.g. symmetric sparticle production), the rest frame of the sparticles (the so-called “R-frame” described in ref. [110]) can be reconstructed, and a characteristic mass MR′ can be defined in this frame: MR′. q = (j1,E + j2,E )2 − (j1,L + j2,L )2 ,. (6.4). where ji,L denotes the longitudinal momentum, and ji,E the energy in the R-frame, of the mega-jet i. The transverse information of the event is contained in another variable, miss from the MTR . In the di-sparticle decay there are two mega-jets, each with associated ET escaping LSPs. Assigning half of the missing transverse momentum per event to each of the LSPs, MTR is defined as MTR =. s. miss · (~ ~ ~ |pmiss j1,T + ~j2,T ) T |(|j1,T | + |j2,T |) − pT , 2. (6.5). where ji,T denotes the transverse momentum of the mega-jet i. Finally, the razor variable is defined as: R=. MTR . MR′. (6.6). For SM processes, R tends to have a low value, while it is approximately uniformly distributed between zero and one for SUSY-like signal events. Thus R can be used as a discriminant between signal and background. A selection using R is made to reduce background processes before a search for new physics phenomena is performed using the distribution of the variable MR′ . In order to have signal regions which are orthogonal to each other in lepton multiplicity, a veto is placed on the presence of a second lepton in the hard and soft single-lepton channels. Following this veto, all signal regions are orthogonal except the inclusive and exclusive soft single-lepton signal regions and the soft dilepton and hard dilepton signal regions. A veto on the third lepton in the soft dimuon channel is placed to reduce the fake lepton contribution (see section 7). For the hard dilepton channel, the requirements on the number of leptons and on their charge depends on the model probed: in the case of models where only two leptons are expected in the final state, events containing any additional lepton are vetoed. Furthermore, for models with squark pair production followed by one-step decays, only events with opposite-sign dilepton pairs are selected. In all the search channels except the soft dimuon channel, two sets of requirements are optimised for each jet multiplicity: one single-bin signal region optimised for discovery reach, which is also used to place limits on the visible cross section, and one signal region which is binned in an appropriate variable in order to exploit the expected shape of the distribution of signal events when placing model-dependent limits. The binned variables. – 17 –.
(20) miss /mincl in the soft single-lepton regions (four bins of width 0.1), mincl in the hard are: ET eff eff miss in the hard singlesingle-lepton 3-jet and 5-jet signal regions (four bins of 200 GeV), ET lepton 6-jet signal region (three bins of 100 GeV) and MR′ in the hard dilepton signal regions (eight bins of 100 GeV in the low-multiplicity signal region and five bins of 100 GeV in the 3-jet signal region). In all regions, the last bin is inclusive. The binned signal regions can differ from the single-binned signal regions in that some requirements may be relaxed. The binned hard single-lepton signal regions are made orthogonal in jet multiplicity to one another by placing a jet veto, as can be seen in table 3, in order to allow their statistical combination and have finer-grained requirements than in a single combined signal region.. 7. Background estimation. The dominant background in all the analyses presented here is top quark pair production. The W +jets and Z+jets backgrounds are also important in the single-lepton and hard dilepton channels, respectively. These backgrounds are estimated using control regions optimised to be enriched in SM events from the background process of interest,while containing only a small contribution from the signal of interest, as described below. The normalisation of the simulation for these background processes is obtained simultaneously in all control regions for each signal region using the fit described in section 9. The simulation is thus used only to extrapolate the results to the signal region, and is therefore not affected by potentially large theoretical uncertainties on the total expected rates in specific regions of phase space. The control regions are chosen to be kinematically close to the signal regions in order to minimise the theoretical uncertainties related to the extrapolation, while containing enough events to avoid compromising the background estimate with a large statistical uncertainty. Events with “fake” or non-prompt leptons can also mimic the signal if they have sufmiss . A jet can be misidentified as a lepton (fake lepton), or a real lepton ficiently large ET can arise as a decay product of b- or c-hadrons in jets but can still be sufficiently isolated (non-prompt lepton). Such lepton-like objects are collectively referred to as fake leptons in this paper. 7.1. Backgrounds from tt̄ and W/Z+jets. The control regions used in the soft single-lepton and soft dimuon channels are illustrated in figure 2 and summarised precisely in table 6. The soft single-lepton control regions are miss and m values than in the signal regions by requirbuilt using events with lower ET T miss < 250 GeV and 40 <m < 80 GeV, and by removing the requirement on ing 180 <ET T miss /mincl . The W +jets and tt̄ background components in these control regions are sepET eff arated by a requirement on the number of b-tagged signal jets. Events in the tt̄ control region are defined by requiring that at least one signal jet is b-tagged; otherwise, they are associated with the W +jets control region. In the soft dimuon analysis, the tt̄ control region is defined by requiring the leading muon to have pT >25 GeV instead of pt <25 GeV. The veto on b-tagged jets is reversed to require at least one b-tagged signal jet among the three leading jets and the requirement. – 18 –.
(21) miss /mincl is removed. The dimuon mass is required to be higher than in the signal on ET eff region, mµµ > 60 GeV, and at least 10 GeV away from the Z boson mass. The hard single-lepton control regions are defined by lowering the requirements on miss miss /mexcl requirement in the 3-jet region. Table 7 ET and mT and by removing the ET eff lists the control region requirements which differ from the signal region selections for the hard single-lepton channel. These various control regions are illustrated in figure 3. The different regions are kept orthogonal by vetoing on the presence of a fifth (sixth) jet in the 3 (5)-jet control region. To increase the number of events, the pT requirements on subleading jets are also lowered with respect to the signal regions. Finally, the W +jets and tt̄ components of these control regions are separated by a requirement on the number of signal jets which are b-tagged, considering the first three leading jets. In order to enhance the W +jets contribution over the tt̄ contribution in the 6-jet W +jets control region, the miss requirements are lowered in this region with respect to the 6-jet tt̄ control mT and ET region. As summarised in table 8 and illustrated in figure 4, the control regions for the hard dilepton channel are defined at lower values of the R variable for events in which there are exactly two leptons of opposite sign in order to enhance the background processes. The Z+jets and tt̄ components of these control regions are separated by a requirement on the number of signal jets which are b-tagged. The control regions are binned in the ′ discriminating variable MR in order to use the same shape information as in the signal regions. The tt̄ control regions in all channels include a small fraction of at most 11% of W t events; this background is not normalised by the fit in the control region, but evaluated directly from simulation, as are other lower-rate background processes involving top quarks (see section 7.3). Figures 5–7 show the mT and mµµ distributions, prior to the upper mT and lower mµµ cuts, in the soft single-lepton and soft dimuon control regions, respectively. Figures 8 and 9 miss distribution, prior to the upper E miss cut, in the hard single-lepton control show the ET T regions. Figure 10 shows the R distribution in the hard dilepton control regions. All these distributions are shown after the fitting procedure is applied to adjust the MC normalisation, as described in section 9. For illustration, examples of expected signal distributions are also shown in these figures. The fraction of events in the control regions coming from the background of interest, hereafter called purity, is given in the caption of these figures. As the normalisation factors are obtained in a simultaneous fit to all control regions for a given signal region, the cross-contamination of the control regions with different processes is taken into account and lower purity in some regions does not degrade significantly the accuracy of the background estimation. The agreement between the data and the SM background estimate is reasonable within the statistical and systematic uncertainties. The systematic uncertainties shown do not include an uncertainty on the cross sections of the backgrounds that are normalised using the fitting procedure, but do include the relevant theoretical uncertainties on the extrapolation of the background normalisation obtained from each CR to the relevant SR (see section 8). The results of the fit, in particular the signal region predictions, are further discussed in section 10.. – 19 –.
(22) pℓT [GeV] mµµ [GeV] Nb−tag miss ET [GeV] mT [GeV] ∆Rmin (jet, ℓ). Soft single-lepton 3-jet 5-jet 3-jet inclusive W +jets / tt̄. Soft dimuon 2-jet tt̄. [7,25] (electron) , [6,25] (muon) −. >25,6 > 60, |mµµ − mZ | > 10. 0/≥1 [180,250] [40,80]. > 1.0. −. ≥1 > 180 > 40 > 1.0. −. Table 6. Overview of the selection criteria for the CR used in the soft single-lepton and soft dimuon channels: only the criteria which differ from the corresponding signal region selections in at least one CR are shown (see figure 2 for an illustration of the above CRs).. 3-jet jet. pT [GeV] Jet veto Nb−tag miss ET [GeV] mT [GeV] miss ET /mexcl eff. Hard single-lepton 5-jet. W +jets / tt̄ > 80, 80, 30 > 80, 50, 30, 30, 30 th th pT 5 jet < 30 GeV pT 6 jet < 30 GeV 0/≥1 [150,300] [80,150] [60,150] − −. 6-jet. > 80, 50, 30, 30, 30, 30 − [100,200] / [150,250] [40,80] / [40,150] −. Table 7. Overview of the selection criteria for the W +jets and tt̄ CR used in the hard single-lepton channel: only the criteria which differ from the corresponding signal region selections in at least one CR are shown (see figure 3 for an illustration of the above CRs).. Hard dilepton Low-multiplicity ee/µµ Z CR tt̄ CR Nℓ Nb−tag R ′ MR [GeV] ′ MR bin width [GeV]. eµ tt̄ CR. 3-jet. ee/µµ Z CR tt̄ CR. eµ tt̄ CR. 2 of opposite sign 0 1 0 1 [0.15,0.3] [0.2,0.4] [0.05,0.2] [0.1,0.3] [400,1200] [800,1600] 100 200. Table 8. Overview of the selection criteria for the Z+jets and tt̄ CR used in the hard dilepton channel: only the criteria which differ from the corresponding signal region selections in at least one CR are shown (see figure 4 for an illustration of the above CRs).. – 20 –.
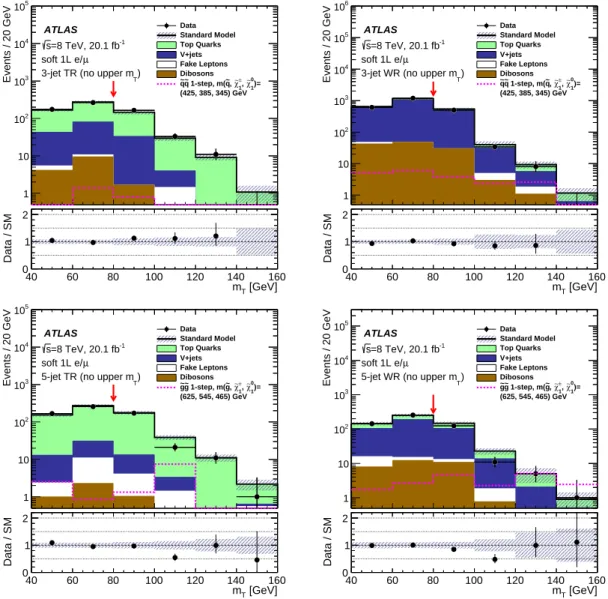
(23) Data Standard Model Top Quarks V+jets Fake Leptons Dibosons ~q ~ 1-step, m(q ~, χ ∼± , χ ∼0 )= q 1 1 (425, 385, 345) GeV. ATLAS 4. 10. 3. 10. Events / 20 GeV. Events / 20 GeV. 5. 10. -1. s=8 TeV, 20.1 fb soft 1L e/ µ 3-jet TR (no upper m ) T. 6. 10. 5. 10. 4. 10. Data Standard Model Top Quarks V+jets Fake Leptons Dibosons ~q ~ 1-step, m(q ~, χ ∼± , χ ∼0 )= q 1 1 (425, 385, 345) GeV. ATLAS -1. s=8 TeV, 20.1 fb soft 1L e/ µ 3-jet WR (no upper m ) T. 3. 10 102. 102. 1. 2. Data / SM. 1. 2 1 0 40. Events / 20 GeV. 10. 60. 80. 100. 120. 160 mT [GeV]. 5. 10. Data Standard Model Top Quarks V+jets Fake Leptons Dibosons ~g ~ 1-step, m(g ~, χ ∼± , χ ∼0 )= g 1 1 (625, 545, 465) GeV. ATLAS 4. 10. 3. 10. s=8 TeV, 20.1 fb-1 soft 1L e/ µ 5-jet TR (no upper m ) T. 80. 100. 5. 10. 104. 120. 140. 160 mT [GeV]. Data Standard Model Top Quarks V+jets Fake Leptons Dibosons ~g ~ 1-step, m(g ~, χ ∼± , χ ∼0 )= g 1 1 (625, 545, 465) GeV. ATLAS s=8 TeV, 20.1 fb-1 soft 1L e/ µ 5-jet WR (no upper m ) T. 3. 102 10. 1. 1. 2. 2. Data / SM. 10. 1 0 40. 60. 10. 102. Data / SM. 1 0 40. 140. Events / 20 GeV. Data / SM. 10. 60. 80. 100. 120. 140. 160 mT [GeV]. 1 0 40. 60. 80. 100. 120. 140. 160 mT [GeV]. Figure 5. Distribution of the transverse mass mT in the 3-jet (top) and 5-jet (bottom) tt̄ (left) and W +jets (right) control regions used in the soft single-lepton channel. The upper mT cut, indicated by the arrow, is not applied in these distributions. The purity in the background of interest is 56% (87%) for the 3-jet tt̄ (W ) control region and 82% (66%) for the 5-jet tt̄ (W ) control region. The “Data/SM” plots show the ratio of data to the summed Standard Model expectation, which is derived from the fit described in section 9. The uncertainty band on the Standard Model expectation shown here combines the statistical uncertainty on the simulated event samples with the relevant systematic uncertainties (see text). The last bin includes the overflow. The “Top Quarks” label includes all top-quark-related backgrounds, while “V+jets” includes W +jets, Z+jets and other Drell-Yan backgrounds such as Z → τ + τ − and γ ∗ /Z outside the Z pole region. For illustration, the expected signal distribution is shown for first- and second-generation squark pair production with mq̃ = 425 GeV, mχ̃± =385 GeV and mχ̃01 = 345 GeV (top), and for gluino pair 1 production with mg̃ = 625 GeV, mχ̃± =545 GeV and mχ̃01 = 465 GeV (bottom). 1. – 21 –.
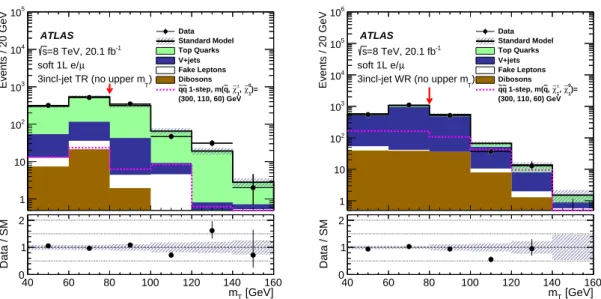
(24) ATLAS 104. 3. 10. s=8 TeV, 20.1 fb-1 soft 1L e/ µ 3incl-jet TR (no upper m ) T. Events / 20 GeV. Events / 20 GeV. 5. 10. Data Standard Model Top Quarks V+jets Fake Leptons Dibosons ~~ ~ ∼± ∼0 qq 1-step, m(q, χ1, χ1)= (300, 110, 60) GeV. 6. 10. 5. 10. 104. ATLAS s=8 TeV, 20.1 fb-1 soft 1L e/ µ 3incl-jet WR (no upper m ) T. 3. Data Standard Model Top Quarks V+jets Fake Leptons Dibosons ~~ ~ ∼± ∼0 qq 1-step, m(q, χ1, χ1)= (300, 110, 60) GeV. 10 102. 102 10. 1. 1. 2. 2. Data / SM. Data / SM. 10. 1 0 40. 60. 80. 100. 120. 140. 160 mT [GeV]. 1 0 40. 60. 80. 100. 120. 140. 160 mT [GeV]. Figure 6. Distribution of the transverse mass mT in the 3-jet inclusive tt̄ (left) and W +jets (right) control regions used in the soft single-lepton channel. The upper mT cut, indicated by the arrow, is not applied in these distributions. The purity in the background of interest is 70% (82%) for tt̄ (W ) control region. The “Data/SM” plots show the ratio of data to the summed Standard Model expectation, which is derived from the fit described in section 9. The uncertainty band on the Standard Model expectation shown here combines the statistical uncertainty on the simulated event samples with the relevant systematic uncertainties (see text). The last bin includes the overflow. The “Top Quarks” label includes all top-quark-related backgrounds, while “V+jets” includes W +jets, Z+jets and other Drell-Yan backgrounds such as Z → τ + τ − and γ ∗ /Z outside the Z pole region. For illustration, the expected signal distribution is shown for first- and secondgeneration squark pair production with mq̃ = 300 GeV, mχ̃± =110 GeV and mχ̃01 = 60 GeV. 1. – 22 –.
(25) Events / 20 GeV. 104. 3. 10. ATLAS s=8 TeV, 20.1 fb-1 soft 2MU TR, no lower mµµ. 102. Data Standard Model Top Quarks Z+jets Fake Leptons Dibosons mUED (1/Rc=1000 GeV, ΛR=5). 10. 1. Data / SM. 10-1. 2 1 0. 40 60 80 100 120 140 160 180 200 220 240. mµµ [GeV]. Figure 7. Distribution of the dimuon invariant mass mµµ in the tt̄ control region used in the soft dimuon channel. The lower mµµ cut, indicated by the arrow, is not applied in this distribution. The purity in tt̄ is 83% for this region. The “Data/SM” plots show the ratio of data to the summed Standard Model expectation, which is derived from the fit described in section 9. The uncertainty band on the Standard Model expectation shown here combines the statistical uncertainty on the simulated event samples with the relevant systematic uncertainties (see text). The last bin includes the overflow. The “Top Quarks” label includes all top-quark-related backgrounds, while “V+jets” includes W +jets, Z+jets and other Drell-Yan backgrounds such as Z → τ + τ − and γ ∗ /Z outside the Z pole region. For illustration, the expected signal distribution of the mUED model point with Rc−1 = 1000 GeV and ΛRc =5 is also shown.. – 23 –.
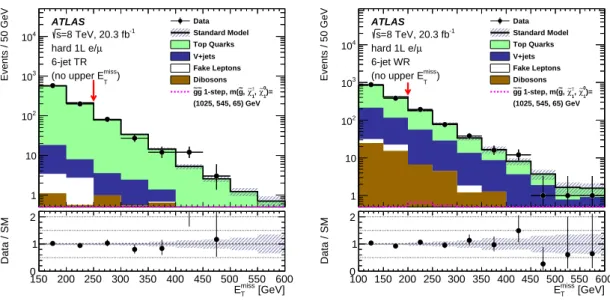
(26) 10. T. 2. 10. Events / 50 GeV. Events / 50 GeV. 3. ATLAS s=8 TeV, 20.3 fb-1 hard 1L e/µ 3-jet TR miss (no upper E ). Data Standard Model Top Quarks V+jets Fake Leptons Dibosons ~~ ~ ∼± ∼0 gg 1-step, m(g, χ1, χ1)= (1025, 545, 65) GeV. 1. 1. 2. 2. Data / SM. Data / SM. T. 1. 10. ATLAS s=8 TeV, 20.3 fb-1 hard 1L e/µ 5-jet TR miss (no upper E ) T. 2. 10. Standard Model Top Quarks V+jets Fake Leptons Dibosons ~~ ~ ∼± ∼0 gg 1-step, m(g, χ1, χ1)= (1025, 545, 65) GeV. Data Standard Model Top Quarks V+jets Fake Leptons Dibosons ~~ ~ ∼± ∼0 gg 1-step, m(g, χ1, χ1)=. 1 0 150 200 250 300 350 400 450 500 miss 550 600 ET [GeV]. Events / 50 GeV. 104. 3. Data. 10. 0 150 200 250 300 350 400 450 500 miss 550 600 ET [GeV]. (1025, 545, 65) GeV. 104. 3. 10. 10. 10. 1. 1. 2. 2. 1 0 150 200 250 300 350 400 450 500 miss 550 600 ET [GeV]. ATLAS s=8 TeV, 20.3 fb-1 hard 1L e/µ 5-jet WR miss (no upper E ) T. 102. Data / SM. Events / 50 GeV. 3. 10. ATLAS s=8 TeV, 20.3 fb-1 hard 1L e/µ 3-jet WR miss (no upper E ). 102. 10. Data / SM. 104. Data Standard Model Top Quarks V+jets Fake Leptons Dibosons ~~ ~ ∼± ∼0 gg 1-step, m(g, χ1, χ1)= (1025, 545, 65) GeV. 1 0 150 200 250 300 350 400 450 500 miss 550 600 ET [GeV]. miss Figure 8. Distribution of the missing transverse momentum ET in the 3-jet (top) and 5-jet (bottom) tt̄ (left) and W +jets (right) control regions used in the hard single-lepton channel. The miss upper ET cut, indicated by the arrow, is not applied in these distributions. The purity in the background of interest is 66% (72%) for the 3-jet tt̄ (W ) control region and 81% (45%) for the 5-jet tt̄ (W ) control region; the 5-jet W control region is cross-contaminated by tt̄ events at the level of 40%. The “Data/SM” plots show the ratio of data to the summed Standard Model expectation, which is derived from the fit described in section 9. The uncertainty band on the Standard Model expectation shown here combines the statistical uncertainty on the simulated event samples with the relevant systematic uncertainties (see text). The last bin includes the overflow. The “Top Quarks” label includes all top-quark-related backgrounds, while “V+jets” includes W +jets, Z+jets and other Drell-Yan backgrounds such as Z → τ + τ − and γ ∗ /Z outside the Z pole region. For illustration, the expected signal distributions are shown for gluino pair production with mg̃ = 1025 GeV, mχ̃± = 1 545 GeV and mχ̃01 = 65 GeV.. – 24 –.
(27) 3. 10. ATLAS s=8 TeV, 20.3 fb-1 hard 1L e/µ 6-jet TR miss (no upper E ) T. Events / 50 GeV. Events / 50 GeV. 104. Data Standard Model Top Quarks V+jets Fake Leptons Dibosons ~~ ~ ∼± ∼0 gg 1-step, m(g, χ1, χ1)=. 104. 3. 10. T. Data Standard Model Top Quarks V+jets Fake Leptons Dibosons ~~ ~ ∼± ∼0 gg 1-step, m(g, χ1, χ1)= (1025, 545, 65) GeV. 102. 102. 10. 10. 1. 1. 2. 2. Data / SM. Data / SM. (1025, 545, 65) GeV. ATLAS s=8 TeV, 20.3 fb-1 hard 1L e/µ 6-jet WR miss (no upper E ). 1 0 150 200 250 300 350 400 450 500 miss 550 600 ET [GeV]. 1 0 100 150 200 250 300 350 400 450 500miss550 600 ET [GeV]. miss Figure 9. Distribution of the missing transverse momentum ET in 6-jet tt̄ (left) and W +jets miss (right) control regions used in the hard single-lepton channel. The upper ET cut, indicated by the arrow, is not applied in these distributions. The purity in the background of interest is 90% (21%) for the tt̄ (W ) control region; the W control region is cross-contaminated by tt̄ events at the 70% level. The “Data/SM” plots show the ratio of data to the summed Standard Model expectation, which is derived from the fit described in section 9. The uncertainty band on the Standard Model expectation shown here combines the statistical uncertainty on the simulated event samples with the relevant systematic uncertainties (see text). The last bin includes the overflow. The “Top Quarks” label includes all top-quark-related backgrounds, while “V+jets” includes W +jets, Z+jets and other Drell-Yan backgrounds such as Z → τ + τ − and γ ∗ /Z outside the Z pole region. For illustration, the expected signal distributions are shown for gluino pair production with mg̃ = 1025 GeV, mχ̃± = 1 545 GeV and mχ̃01 = 65 GeV.. – 25 –.
(28) 104. ATLAS s=8 TeV, 20 fb-1 2L OS ee/µµ b-veto Z (≤ 2 jet) CR+SR. Events / 0.05. Events / 0.05. 5. 10. Data Standard Model Top Quarks Z+jets. 3. Fake Leptons 3. (825, 465, 285, 105) GeV. 10. Data / SM. 1. 1 0.1 0.2 0.3 0.4 0.5 0.6 0.7 0.8 0.9. ATLAS s=8 TeV, 20 fb-1 2L OS ee/µµ b-tag tt (≤ 2 jet) CR+SR. Data Standard Model Top Quarks Z+jets. 1 0 0. 1 R Events / 0.05. Data / SM. ∼0,~l/ ν∼, χ ∼0)= ~ ∼±/ χ q~ q 2-step, m(~ q, χ 1 1 2. 2. 10. Z+jets. 102. 1. 4. Top Quarks. Fake Leptons. 2. 5. Standard Model. 10. (825, 465, 285, 105) GeV. 10. 10. Data. Dibosons. ∼0,~l/ ν∼, χ ∼0)= ~ ∼±/ χ q~ q 2-step, m(~ q, χ 1 1 2. 102. 0 0. ATLAS s=8 TeV, 20 fb-1 2L OS ee/µµ b-veto Z (≥ 3 jet) CR+SR. Dibosons. 10. Events / 0.05. 104. 3. 10. 0.1 0.2 0.3 0.4 0.5 0.6 0.7 0.8 0.9. ATLAS s=8 TeV, 20 fb-1 2L OS ee/µµ b-tag tt (≥ 3 jet) CR+SR. Fake Leptons. 1 R. Data Standard Model Top Quarks Z+jets Fake Leptons. 3. 10. 102. Dibosons ∼± ∼0. ~ ∼0 ~ q~ q 2-step, m(~ q, χ1/ χ2, l/ ν∼, χ )= 1. 102. Dibosons ~ ∼±/ χ ∼0,~l/ ν∼, χ ∼0)= q~ q 2-step, m(~ q, χ 1 2 1. (825, 465, 285, 105) GeV. (825, 465, 285, 105) GeV. 10. 1. 2. 1 0 0. Events / 0.05. Data / SM. 1. 2. 5. 10. 4. 10. 0.1 0.2 0.3 0.4 0.5 0.6 0.7 0.8 0.9. ATLAS s=8 TeV, 20 fb-1 2L OS eµ b-tag tt (≤ 2 jet) CR+SR. Data Standard Model Top Quarks Z+jets. 1 0 0. 1 R Events / 0.05. Data / SM. 10. 3. 10. Fake Leptons. 0.1 0.2 0.3 0.4 0.5 0.6 0.7 0.8 0.9. ATLAS s=8 TeV, 20 fb-1 2L OS eµ b-tag tt (≥ 3 jet) CR+SR. 1 R. Data Standard Model Top Quarks Z+jets Fake Leptons. 3. 10. 102. Dibosons ~ ∼±/ χ ∼0,~l/ ν∼, χ ∼0)= q~ q 2-step, m(~ q, χ 1 2 1. 102. (825, 465, 285, 105) GeV. Dibosons ~ ∼±/ χ ∼0,~l/ ν∼, χ ∼0)= q~ q 2-step, m(~ q, χ 1 2 1 (825, 465, 285, 105) GeV. 10. 1. 1. 2. 2. Data / SM. Data / SM. 10. 1 0 0. 0.1 0.2 0.3 0.4 0.5 0.6 0.7 0.8 0.9. 1 R. 1 0 0. 0.1 0.2 0.3 0.4 0.5 0.6 0.7 0.8 0.9. 1 R. Figure 10. Distribution of the razor variable R in the low-multiplicity (left) and 3-jet (right) Z (top) control region and in the tt̄ control region with same-flavour (middle) or opposite-flavour (bottom) leptons used in the hard dilepton channel. The upper cut on R (illustrated by the arrow) separating signal from control regions is not applied in these distributions. The purity in the background of interest is 85% and 75% for the tt̄ and Z control regions, respectively. The “Data/SM” plots show the ratio of data to the summed Standard Model expectation, which is derived from the fit described in section 9. The uncertainty band on the Standard Model expectation shown here combines the statistical uncertainty on the simulated event samples with the relevant systematic uncertainties (see text). The “Top Quarks” label includes all top-quark-related backgrounds, while “V+jets” includes W +jets, Z+jets and other Drell-Yan backgrounds such as Z → τ + τ − and γ ∗ /Z outside the Z pole region. For illustration, the expected signal distributions are shown for squark pair production with mq̃ = 825 GeV, mχ̃± /χ̃0 = 465 GeV, mℓ̃/ν̃ = 285 GeV and mχ̃01 = 105 GeV. 1. 2. – 26 –.
(29) 7.2. Fake-lepton background. The multijet and Z(→ νν)+jets processes are important sources of fake-lepton background in the single-lepton analyses, while W (→ ℓν)+jets and tt̄ production (where one of the leptons comes from a W boson decay and the other is from a b-hadron decay) are expected to dominate the fake-lepton background in the soft dimuon and hard dilepton analyses. The fake-lepton background in the signal region as well as in the control regions, where it is more significant, is estimated entirely from the data by means of a matrix method described in ref. [111] and briefly summarised below; the procedure is applied separately for electrons and muons. In this method, the process creating the fake lepton is enhanced in a control sample where preselected leptons are used instead of the signal leptons, and all signal or control region criteria are applied. If Npass and Nfail are the number of events found passing or failing the signal lepton selection in this control sample, then the number of events with a fake lepton in a single-lepton signal or control region is given by: fake Npass =. Nfail − (1/ǫreal − 1)Npass 1/ǫfake − 1/ǫreal. (7.1). where ǫreal is the relative identification efficiency (from preselection to selection) for prompt leptons and ǫfake is the probability to misidentify jets or non-prompt leptons as prompt leptons. For dileptonic signal or control regions, the estimation of this background is based on the same principle, this time using a four-by-four matrix to take into account the different fake combinations for the leading and subleading lepton: one prompt and one fake lepton, two fake leptons, or two prompt leptons. The relative identification efficiency ǫreal is obtained from data in bins of pT and η using a tag-and-probe method in Z → ℓℓ events. The value of ǫfake is estimated in control regions enriched in multijet events. The multijet control region is composed of events with at least one preselected lepton and at least one signal jet with pT > 60 GeV, mT < 40 GeV and miss < 30 GeV. Since the control region is defined at low E miss values, the triggers described ET T in section 4 cannot be used. Instead, a combination of prescaled single-lepton triggers and unprescaled dilepton triggers is used. The prompt lepton contribution is subtracted from this multijet control region using MC simulation and ǫfake is given by the fraction of preselected leptons passing the signal lepton selection in this region. The events are split into two samples depending on whether they have at least one b-tagged jet or none, in order to allow ǫfake to vary as a function of the fake-lepton source. The value of ǫfake is also extracted in bins of pT and η. The same relative efficiencies are used across all analysis channels. 7.3. Other backgrounds. All other backgrounds are estimated from simulation, using the most accurate theoretical cross sections available. These include single-top (t-channel, s-channel, W t), t+Z , dibosons (W W , W Z, ZZ, W γ, Zγ), tt̄ + W , tt̄ + Z and tt̄ + W W production. In the soft dimuon channel, the Drell–Yan and Z+jets backgrounds are also estimated from simulation as there is no dedicated control region to evaluate their contribution.. – 27 –.
Figure

+7


Documento similar